

Abstract
Small molecule flexible alignment is a critical component of both ligand- and structure-based methods in computer-aided drug discovery. Despite its importance, the availability of high-quality flexible alignment software packages is limited. Here, we present BCL::MolAlign, a freely available property-based molecular alignment program. BCL::MolAlign accommodates ligand flexibility through a combination of pregenerated conformers and on-the-fly bond rotation. BCL::MolAlign converges on alignment poses by sampling the relative orientations of mutually matching atom pairs between molecules through Monte Carlo Metropolis sampling. Across six diverse ligand data sets, BCL::MolAlign flexible alignment outperforms MOE, ROCS, and FLEXS in recovering native ligand binding poses. Moreover, the BCL::MolAlign alignment score is more predictive of ligand activity than maximum common substructure similarity across 10 data sets. Finally, on a recently published benchmark set of 20 high quality congeneric ligand—protein complexes, BCL::MolAlign is able to recover a larger fraction of native binding poses than maximum common substructure-based alignment and ROSETTALIGAND. BCL::MolAlign can be obtained as part of the BIOLOGY AND CHEMISTRY LIBRARY (BCL) software package freely with an academic license or can be accessed via Web server at http://meilerlab.org/index.php/servers/molalign.
Graphical Abstract

INTRODUCTION
Small molecule flexible alignment is the process of organizing 3D molecular structures in space according to their similarities. It is a necessary step in a number of computer-aided drug discovery (CADD) strategies that utilize 3D structural information to evaluate putative ligands.1 Ligand alignment is necessary because the protein-bound ligand pose is distinct from the pose adopted by the ligand in free solution.2–4 Bioactive ligand conformations result not just from low-energy ligand conformational selection but also from protein conformational accessibility.5,6 Consequently, the binding conformation of the ligand cannot be reliably determined by minimizing ligand internal strain alone if the ligand can adopt multiple conformations that have comparable energy.
Determination of the most likely ligand binding-pose is a critical component of ligand- and structure-based drug discovery. One of the most extensively utilized and actively developed methods in CADD is pharmacophore modeling.7 Recent innovation has led to the development of interactive software for building pharmacophores and designing lead compounds from them.8,9 Among the most significant challenges in pharmacophore modeling is obtaining an accurate and informative molecular alignment.7 Structure-based methods are also enhanced by effective molecular alignment. Effective protein—ligand docking usually requires a priori knowledge of an approximate binding mode.10–14 Despite significant advances in the field,15–26 small molecule flexible alignment remains a challenging problem. Here, we present a novel small molecule flexible alignment algorithm in the BIOLOGY AND CHEMISTRY LIBRARY molecular modeling suite called BCL::MolAlign.
A successful alignment algorithm must provide the following: (1) efficient sampling of each molecule’s conformational space, (2) efficient sampling of possible alignments, and (3) scoring aligned poses according to their fit. There are generally two strategies employed to account for ligand flexibility during the search procedure: (1) rigid-body alignment with an ensemble of molecule conformers or (2) bond angle sampling as a discrete step during alignment.7 Methods which rely exclusively on pregenerated conformers (e.g., LIGSIFT, ROCS, Shapelets, PL-PatchSurfer) are limited in their predictive potential by the initial conformers produced.17,27–32 Several other approaches, such as FlexS33 or the flexible alignment software available through Chemical Computing Group’s MOE,34,35 account for ligand flexibility by including torsional sampling during the alignment procedure. These algorithms must simultaneously enforce rules minimizing ligand internal strain against rules maximizing alignment score. This can result in unrealistic ligand poses in cases where the molecules being compared are of substantially different size or shape.35
To address deficiencies in conformational sampling, we have implemented a unique combination of both of the above approaches. We first utilize BCL::Conf to generate an ensemble of conformers for one or both molecules. The difficulty in applying pregenerated conformations for molecular alignment is generating native-like, physically realistic conformations. BCL::Conf combines a CSD-derived rotamer library with a conformer scoring function based on dihedral rotamer propensity and atomic clashes to rate the likelihood of a given conformer. With this scoring scheme, BCL::Conf is able to recover more native-like conformers than other widely used conformer generation protocols.36 We subsequently apply limited on-the-fly flexible refinement of the target conformer during pose sampling. On-the-fly conformational changes that do not pass the BCL::Conf clash score are rejected.
An additional challenge is in developing a robust search algorithm to navigate the shared conformational space (co-space) of the molecules being aligned. The majority of programs employ a deterministic algorithm based on maximum overlap of molecular volume. 7,27,28 While rapid, such an approach necessarily becomes less effective as the number of rotatable bonds (and correspondingly, the nondegenerate conformations) of the target molecule increases. We address this deficiency by utilizing multi-trajectory Monte Carlo Metropolis (MCM) sampling to overlay nearby substructures of the molecules. Our method allows rapid convergence on the co-space of the molecules while maintaining dynamic conformational sampling. Moreover, BCL::MolAlign may optionally superimpose molecules based on maximal common substructures defined by specific atom and bond type features.
Finally, a scoring metric is needed that is capable of ranking molecule superimpositions on the basis of the degree to which chemically similar functional groups are best superimposed. Many algorithms implement a Tanimoto coefficient to grade chemical and/or shape similarity.17,27,28 Strict Tanimoto comparisons are incapable of grading alignments when the molecules being compared are of sufficiently different sizes. This prohibits accurate alignment and ranking of derivatives to substructure scaffolds. Many methods are based on Gaussian overlap, where a Gaussian decay is applied to each property and the score is simply the 3D-spatial integral of the overlap, often computed solely at the centers of each atom. 17,37 This approach suffers from the offset problem—if the properties are continuous, such as van der Waals volume, then the optimal alignment of two atoms very different in size will be offset. Additionally, Gaussian based methods typically define a single length scale for each property, which is arbitrary and inappropriate for binding pockets of different levels of flexibility.37 An alternative approach is to generate a comparison function from weighted linear combinations of chemical properties.34 We took the latter approach; our scoring function is computed by summing the weighted property-distance between nearest-neighbor atoms of the molecules being aligned. Our method has the added advantage that atoms in one molecule that have no corresponding partner in the other molecule do not influence the search procedure. In addition to offering BCL::MolAlign as part of the Biology and Chemistry Library molecular modeling suite, we have made our alignment algorithm publically available as a server at http://meilerlab.org/index.php/servers/molalign.
RESULTS AND DISCUSSION
BCL::MolAlign Uses a Three-Tiered Monte Carlo Metropolis Protocol to Identify Optimal Superimpositions for Two Molecules.
BCL::MOLALIGN perturbations are implemented primarily through a Monte Carlo Metropolis (MCM) search procedure (Table 1). An overview of the algorithm is presented in Figure 1. Briefly, at least one MC trajectory is performed for each alignment with the option to specify additional independent trajectories. Each trajectory will perform three tiers of optimization (Figure 1). In the first tier, pregenerated conformer pairs (one from each molecule) undergo limited optimization to remove the lowest scoring 25% of conformer pairs. The total number of conformer pairs tested is a user-specified quantity. Tier two iteratively refines the best alignments and removes the lowest scoring user-specified fraction after each iteration. Tier three performs a final optimization of the top N user-specified pairs from round two. BCL::MOLALIGN can align a single target molecule against another ligand in a known binding pose (herein referred to as the “scaffold” ligand), or it can independently move both molecules in a pair to optimize their alignment.
Table 1.
Summary of Sampling Strategies Employed in BCL::MolAlign
| move | use | description |
|---|---|---|
| BondAlign | rigid or flexible | superimpose an individual bond from two nearest-neighbor atoms in each molecule |
| BondAlign2 | rigid or flexible | superimpose two bonds from two nearest-neighbor atoms in each molecule |
| MatchAtomNeighbors | rigid or flexible | superimpose all matched atom pairs within the maximum distance threshold |
| BondSwap | rigid or flexible | transform the molecule such that the position coordinates of a random bonded atom pair are swapped with the position coordinates of a second random bonded atom pair |
| RotateSmall | rigid or flexible | randomly rotate the molecule 0–5° about a randomly selected axis |
| RotateLarge | rigid or flexible | randomly rotate the molecule 0–180° about a randomly selected axis |
| BondRotate | flexible only | randomly rotate the non-amide, non-ring, outermost single bond between heavy atoms that form dihedral angles with adjacent heavy atoms |
| ConformerSwap | flexible only | swap a current conformer for another in the library |
Figure 1.
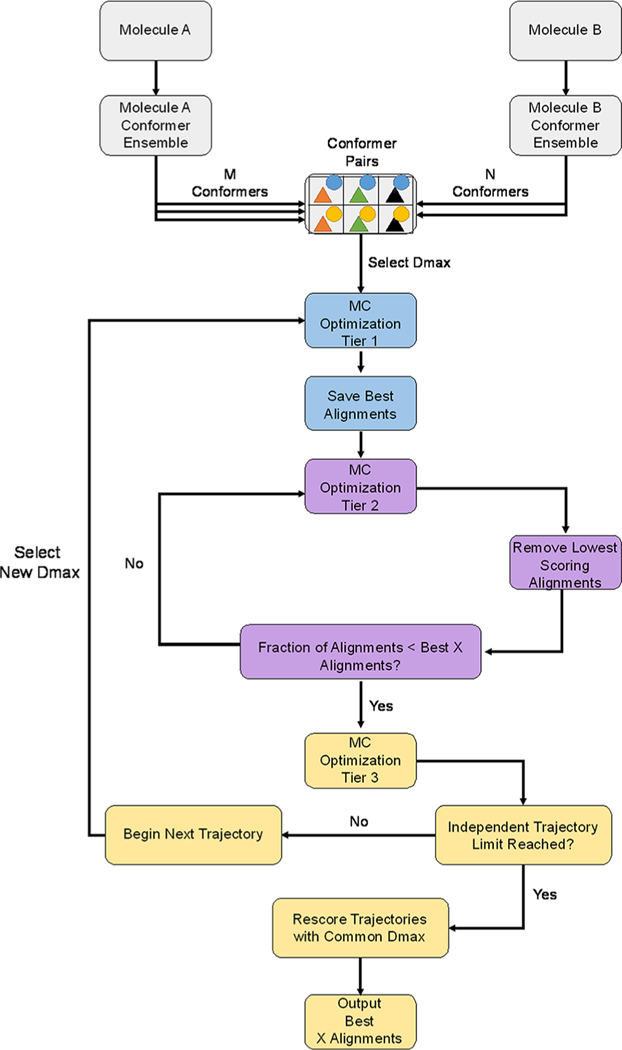
Outline of the BCL::MolAlign flexible alignment algorithm. Rigid alignment is equivalent to a single tier of MCM optimization with a single conformation each for molecule A and molecule b. MC moves alter the current molecule A or B during each optimization tier. The same moves are used in each tier, but the number of steps differs in each tier (see the Methods).
Each step of the MCM is scored. If the score is the best that has been sampled so far or if it is improved over the previously accepted step, then that step is automatically accepted. If the score is not improved, then there is a probability that it will be accepted dependent on the magnitude of the score difference and the temperature (Figure 1). The temperature automatically adjusts to satisfy user-specified acceptance ratios over the course of the simulation.38
At the beginning of each alignment, BCL::Conf will attempt to generate a user-specified number of conformations, or a default number of 100 unique conformations, for each molecule for which flexibility is allowed. Subsequently, conformers of the two molecules will be randomly paired until the number of conformer pairs is equal to the minimum of the total number of possible pairs and a user-specified conformer pair number (the default conformer pair number is equal to 100 pairs). For example, if BCL::Conf generates 50 conformers of each of the two molecules being aligned, then there are 2500 possible conformer pairs. With the default settings, 100 conformer pairs would be randomly selected as starting points for alignment. An MCM ConformerSwap mover is implemented to allow access to the other 2400 possible conformer pairs during the alignment. Alternatively, if each molecule has only one conformation, then only one conformation pair would be selected as a starting point because the total number of possible pairs is less than the default conformer pair number of 100.
Conformational sampling is incorporated into the search procedure through a combination of pregenerated conformer swapping and on-the-fly bond rotation. Specifically, we either swap one conformer for a separate conformer from those generated at the beginning of the alignment with BCL::Conf (ConformerSwap) or rotate particular bonds (BondRotate; Table 1). ConformerSwap randomly selects a conformer from the entire conformational ensemble of one of the molecules in the pair. The coordinates of that conformer in 3D real space are then transformed to minimize the RMSD to the original conformation of the same molecule.
BondRotate rotates non-conjugated, non-ring, single bonds between heavy atoms that form dihedral angles with adjacent heavy atoms. To ensure that the bond rotation yields an energetically favorable conformation, we first obtain a set of allowed rotations for each dihedral from BCL::Conf’s rotamer library. Initially, we observed that this move was very rarely accepted when it was applied to bonds near the core of the molecule, presumably because altering a dihedral near the core of the molecule often perturbs the entire conformation. Likewise, we restricted BondRotate to only work on the outermost heavy-atom dihedral angles in the molecule. The purpose of BondRotate is to allow refinement of otherwise well-aligned conformers when the probability of substituting the correct conformer is prohibitively low or null due to the necessarily incomplete coverage of conformational space. If BondRotate results in a molecule conformation which does not satisfy the BCL::Conf atom clash score,36 then the move is rejected prior to scoring and an alternative MCM move is attempted.
BCL::Conf, and by extension BCL::MolAlign, does not perform explicit calculations of conformer internal energy and instead relies on statistical potentials. While conformers with higher internal strain can potentially be sampled, it is also possible for protein-bound ligands to exhibit conformers of higher internal energy relative to the solution state.3,4 If additional restrictions on acceptable conformers are desired, conformation sampling can easily be turned off, and externally generated conformers can be used as the input for separate rigid alignment runs.
BCL::MolAlign Iteratively Samples Alignments through Superimposition of Bonded Atoms.
In addition to conformational changes, BCL::MolAlign samples possible alignments through multiple movers, or sampling functions, implemented in the MC protocol. The most intuitive perturbations for both rigid and flexible alignment implemented in BCL::MolAlign are rotation and translation of a whole molecule. Translate1 translates molecules between 0 and 1 Å (uniformly distributed) from their starting positions, in a randomly chosen direction. RotateSmall rotates molecules between 0 and 5°, uniformly distributed on the unit sphere within these bounds, from their starting conformations. RotateLarge rotates molecules randomly between 0 and 180°.39 BCL::MolAlign also utilizes a series of moves designed to superimpose the coordinates of nearest-neighbor atoms (BondAlign, BondAlign2, and MatchAtomNeighbors) without explicitly comparing common substructures. BondAlign, BondAlign2, and MatchAtomNeighbors provide progressively higher resolution sampling of the local alignment space.
Consider two molecules, designated A and B. The BondAlign mover identifies in A the heavy atom that is nearest in Cartesian space to a randomly chosen heavy atom in B, irrespective of their atom types. BondAlign then superimposes a randomly chosen bond from the selected atoms of A and B (Figure 2A).
Figure 2.
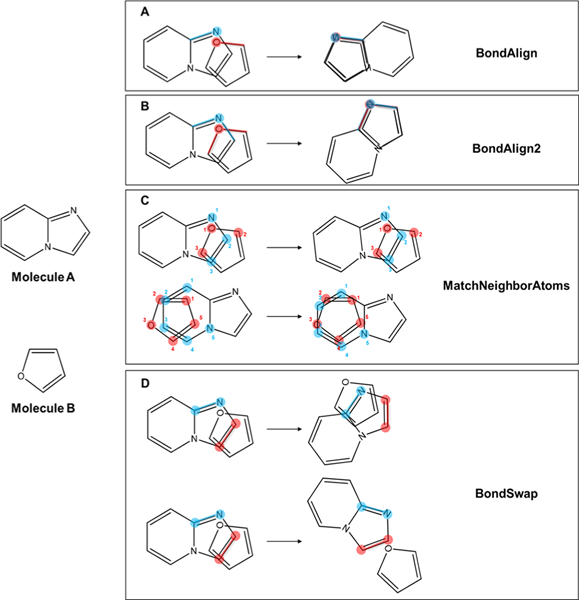
Schematic of sampling strategies implemented in BCL::MolAlign. From a given starting alignment on the left side of the arrow, the resulting alignment following each operation is depicted on the right side of the arrow. Once atoms and bonds have been chosen, BondAlign (A), BondAlign2 (B), and MatchAtomNeighbors (C) each have one possible outcome. BondSwap (D) has an equal probability of sampling two possible outcomes. Highlighted segments correspond to the chosen atoms and bonds for alignment. Atom numberings in MatchNeighborAtoms correspond to mutually matched pairs between molecules A and B.
Similarly, BondAlign2 superimposes two randomly chosen bonds of a randomly selected atom (S) in A with two randomly selected bonds from the closest atom in B to S. Only atoms with two or more bonds are considered for this step (Figure 2B).
The MatchAtomNeighbors mover computes all mutually nearest atom pairs between A and B within a maximum distance threshold (see the subsection “Variable Distance Cutoffs Dictate Which Atom Pairs Are Included in Alignment Scoring”). Subsequently, A is transformed such that the total mean square distance between the mutually nearest atoms in A and B is minimized (Figure 2C).
BondSwap differs from the previous three movers in that it is not based on nearest-neighbor atoms between the two molecules being aligned. The BondSwap mover randomly selects two unique bonds between heavy atoms within A. The molecule is rotated and translated such that the position of the first bond becomes the position of the second bond, or vice versa (Figure 2D).
The probability that a particular mover is selected is proportional to the total amount that each mover improved the scores on the Astra-Zeneca overlay set when all movers were used with equal probability.
Variable Distance Cutoffs Dictate Which Atom Pairs Are Included in Alignment Scoring.
The scoring system was inspired by previous work in our lab, which used Euclidean distance combined with a property value as an additional dimension to evaluate docked conformations of mGluR allosteric modulators.40 In the present study, we expanded that score function to compute the weighted property distances between atom pairs.
For a given alignment of molecules Ma and Mb, W(Mb, i, j) is the matching weight of the ith atom of molecule Mb on the ith atom of molecule Ma and is defined by
| (1) |
where D(Ma,i, Mb,j is the distance of the ith atom in molecule Ma from the jth atom in molecule Mb. Dmax is the maximum distance cutoff determining whether or not two atoms are paired (Figure 3). Similarly, we compute the matching weight of the jth atom of Ma on the ith atom of Mb as W(Ma,i, j).
Figure 3.
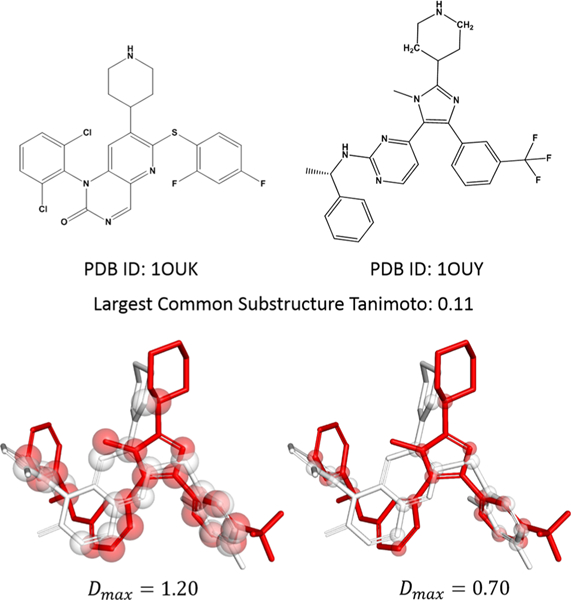
Rigid alignment of P38 inhibitors from PDB IDs 1OUK and 1OUY illustrates atom pairing at variable maximum atom distances. The 2D representations of the 1OUK and 1OUY ligands. The 3D representations depict the native pose of 1OUK rigidly aligned to the native pose of 1OUY. Spheres illustrate heavy atoms separated from a heavy atom in the opposite molecule by less than the specified maximum atom distance (Dmax). Sphere radii correspond to half of the indicated maximum atom distance. Red and white overlapping spheres are considered matched atoms.
For the vast majority of atoms, there is a simple one-to-one matching between these atom pairs based on the distance in our alignments. This enables a simplistic comparison of the properties on the associated atoms without any need for weighting relative contributions from other nearby atoms. However, our scoring function maintains the capacity to handle the cases where an atom straddles a covalently bonded atom pair in the other molecule (Figures 2D and 3).
Dmax is randomly selected in each independent MCM trajectory from a user-defined range. In this benchmark, each alignment was run with five independent trajectories each of which sampled a Dmax between 0.7 and 1.2 Å. The value 0.7 Å, the covalent radius of quaternary carbon, was chosen as the lower bound to allow a single carbon atom to straddle anywhere along a C–C bond, while effectively only matching to the nearer of the two C–C atoms. The upper cutoff of 1.2 Å was nominally chosen as the smallest covalent diameter of any common heavy atom type, alkyl-carbon (0.6 Å radius), to prevent smearing caused by neighboring heavy atoms. To allow comparison between the independent trajectories, the overall best alignments from each trajectory are rescored at a maximum atom distance of 1.0 Å to determine which trajectory yielded the best alignment.
Next, we compute the weighted property average of property p in molecule Mb at the coordinates of the ith atom in Ma, denoted by
| (2) |
The property square norm for property p, computed for molecules Ma and Mb, is the squared L2 norm between a property of atoms of molecule A and the corresponding matched atoms in B
| (3) |
where represents the value of property p for the ith atom of molecule Ma. This norm is asymmetric with respect to A and B, reflecting the notion that molecule A may very well cover the pharmacophore of B, while the converse is untrue. For some applications (i.e., clustering), a symmetric measure of dissimilarity is desired which is ideally normalized to 0−1. Likewise, we define the normalized property distance, PNorm (Ma, Mb, p), between molecules Ma and Mb
| (4) |
where is the sum of property value squares: . The total property distance between molecules Ma and Mb is determined by computing the weighted sum of the normalized property distances for all specified properties as (eq 1)
| (5) |
where wp is the weight of property p. Property weights were obtained as previously described by computing the inverse standard deviation of each property’s occurrence across a sample library of drug-like small molecules,40,41 so as to nominally give each property equal weight or influence over the results.
We noted that the size of the core subset of atoms in a molecule responsible for conferring bioactivity may vary dramatically between targets. However, approximately 80% of the experimentally determined pharmacophores available in the AstraZeneca Overlays Validation Test Set have at least 60% heavy atom overlap in their natively bound poses given a 1.0 Å max atom distance42 (Supporting Information Figure S1). Consequently, the final property distance score (PDS) is computed such that alignments with less than 60% of their total heavy atoms matching are penalized
| (6) |
where penalty as a function of the total fraction of atoms matched, PEN(m), is defined as
| (7) |
for a user-specified base mismatch penalty, C, and the ratio of paired-to-unpaired atoms, m. For the purposes of our benchmark, we nominally took C to be 2.0. The single alignment that minimized eq 6 was taken to be the final alignment. The BCL allows customizable implementation of molecule and atom descriptors for a multitude of tasks.41 For the purposes of this study, we used the atom properties and corresponding weights summarized in Supporting Information Table S1. For additional details, see the Methods section.
BCL::MolAlign Improves Recovery of Crystallographically Determined Ligand Binding Poses.
To evaluate the efficacy of our method in recovering native ligand binding poses, we used a previously published benchmark set of small molecule inhibitors for six protein targets: CDK2, HIV, P38, ESR1, trypsin, and rhinovirus34,43 (Table 2). For two of the data sets, P38 and ESR1, we also evaluated BCL::MolAlign on two previously distinguished pharmacophores,34,43 which yielded an additional four test cases. For each of the data sets, an N × N pairwise alignment of every molecule was performed. Rigid alignments were initiated by centering the native bound conformers of each ligand on one another and reorienting each with a random rotation in space. Flexible alignments were initiated by centering a random BCL-generated conformer of the target molecule on the native pose of the scaffold molecule and perturbing the target molecule with a random rotation in space. An alignment is considered successful if the final pose of the target molecule comes within 2.0 Å real-space symmetric RMSD of its native binding pose.34,43
Table 2.
| rigid |
flexible |
|||||||
|---|---|---|---|---|---|---|---|---|
| data set | ROCS | FLEXS | MOE | BCL | ROCS | FLEXS | MOE | BCL |
| CDK2 | 30% | 25% | 40% | 38% | 20% | 21% | 22% | 21% |
| HIV | 39% | 24% | 85% | 56% | 6% | 8% | 16% | 22% |
| P38 | 27% | 27% | 43% | 46% | 22% | 24% | 30% | 31% |
| ESR1 | 44% | 47% | 59% | 57% | 25% | 28% | 41% | 46% |
| trypsin | 57% | 73% | 80% | 61% | 55% | 29% | 61% | 61% |
| rhinovirus | 50% | 52% | 50% | 50% | 50% | 50% | 50% | 50% |
| rigid |
flexible |
|||
|---|---|---|---|---|
| data set | MOE | BCL | MOE | BCL |
| P38 Pharm 1 | 100% | 100% | 94% | 94% |
| P38 Pharm 2 | 73% | 73% | 53% | 45% |
| ESR1 Pharm 1 | 94% | 86% | 72% | 83% |
| ESR1 Pharm 2 | 92% | 92% | 65% | 82% |
Comparisons between four small molecule alignment methods on rigid and flexible alignment. Rigid alignment comparisons utilized the crystallographic native binding pose of each ligand as input. Flexible alignments began with a randomly generated conformer of the target molecule. In all flexible alignments, the target molecule was aligned to a rigid molecule in its crystallographic native binding pose. Bold values indicate categories in which one method recovered at least 5% of the total more native binding poses than the next best method.
The CDK2 data set was comprised of 57 unique ligands. Rigid alignment of the CDK2 system by BCL::MolAlign was comparable to results obtained via MOE (38 and 40% native pose recovery, respectively), and superior to those achieved with either ROCS or FLEXS (30 and 25%, respectively). Flexible alignments were similar across each method, ranging from 20 to 22%. After excluding self-aligned molecule pairs from the N × N alignment matrix, the best scoring alignment of each of the CDK2 ligands was able to recover 44 of 57 ligands less than 2.0 Å from the native binding pose (Table 2).
The HIV data set contained 28 unique ligands all of which have at least 10 rotatable bonds and 16 of which have 18 or more rotatable bonds, representing a challenging application for molecular alignment. MOE recovered 85% of the natively bound poses for the HIV ligand set via rigid alignment and 16% via flexible alignment, a considerable advancement over methods such as ROCS and FLEXS, which recovered 39 and 24% in rigid alignment and 6 and 8% in flexible alignment, respectively. BCL::MolAlign was able to recover 55% of native poses in rigid alignment and 22% in flexible alignment. Despite recovering fewer native poses than MOE via rigid alignment, BCL::MolAlign recovered more of the native binding poses during flexible alignment than all other methods (Table 2). This may be because BCL::MolAlign is able to assemble hundreds of possible conformers rapidly from a CSD-derived fragment library using BCL::Conf. Subsequent selection and refinement of these conformers with discrete bond rotations during alignment may be a more effective sampling strategy than relying on conformer sampling explicitly during the alignment stage. The bond align movers are crucial to our recovery of HIV-binding poses. We recovered only 8% of the natively bound HIV ligand poses during flexible alignment when our moves consisted of only rotation, translation, conformer swap, and bond angle perturbation. This may be because simple movers such as rotate and translate require many consecutive poorly scoring adjustments to be made to achieve a favorable pose.
The 13 P38 kinase ligands can be divided into two pharmacophores. The first, containing the four ligands from PDB IDs 1M7Q, 1OUK, 1OUY, and 1OVE, is characterized by a central aromatic structure extending a piperidine/piperizine ring directly beneath the P-loop and by a fluorinated aromatic ring accessing the back hydrophobic pocket. The second pharmacophore, represented by PDB IDs 1A9U, 1BL6, 1BL7, 1OZ1, 1W7H, 1W84, and 1YQJ, is larger with a more heterogeneous scaffold. With the exception of 1WBO, all P38 kinase ligands contain a hydrogen bond acceptor group oriented toward the backbone amide of the gatekeeper Met. In all cases with the P38 ligand set, BCL-aligned structures recovered more correct binding poses than ROCS and FLEXS. For the first pharmacophore, the BCL recovered an equivalent fraction of binding poses to MOE, with MOE achieving slightly more for the second (Table 2). Interestingly, the Dmax values that give the best recovery for the P38 compounds differ from those that give the best alignments in the CDK2 and HIV data sets (Supporting Information Figure S2). This indicates that the correct Dmax differs between data sets and that additional optimization of Dmax selection could further improve alignments. We also evaluated if we could improve recovery by sampling Dmax uniformly instead of randomly. On average, across the top six data sets presented in Table 2, uniform sampling of Dmax between 0.70 and 1.20 recovered 1.6% fewer native binding poses, though the difference is not statistically significant.
The 13 ESR1 ligands provide another example of a single binding pocket with two distinct but overlapping pharmacophores. The first pharmacophore contains six ligands that occupy the estradiol binding site (PDB IDs 1A52, 1GWQ, 1L2I, 1X7E, 1X7R, and 3ERD). The second pharmacophore is composed of tamoxifen-like compounds (1R5IK, 1SJ0, 1UOM, 1XP1, 1XP9, 1XQC, and 2BJ4). In each of these pharmacophores, BCL flexible alignment recovered an equivalent or higher fraction of native binding poses compared to MOE (83 and 82% vs 72 and 65%, respectively). Of all of the alignment methods, BCL was able to recover the highest fraction of native binding poses in the combined ESR1 data set (Table 2).
There are seven ligands in the trypsin data set, of which five share a near-identical binding mode, and BCL::MolAlign was able to recover their native binding poses in all of the 5 × 5 alignments. The remaining two ligands differ in size and binding mode, respectively. Despite these differences, during flexible alignment, we achieve 61% recovery of the 7 × 7 matrix, on par with the recovery of MOE flexible alignment.
Finally, the rhinovirus ligand set contains eight nearly symmetric ligands with heterocyclic rings connected on either end by a long alkyl linker. As was previously discussed,13 each ligand binds in two positions each of which is an inversion of the other. In this study, as in previous benchmarks, four ligands crystallized in each binding mode were used (PDB IDs 2RM2, 2RR1, 2RS1, and 2RS3 in one binding mode and 2R04, 2R06, 2R07, and 2RS5 in the other). Successful alignment of a ligand in binding mode one to a ligand in the inverted binding mode would not be evaluated as a correct alignment using the current metric. Therefore, the maximum score for this data set is 50%. Each alignment method including BCL::MolAlign was able to recover 50%.
Native Binding Pose Recovery Does Not Require, and Is Only Weakly Assisted by, High Substructure.
We investigated the extent to which maximum common substructure similarity between the target molecule and its scaffold influenced recovery of the native binding pose of the target molecule on the AstraZeneca Overlays Validation Set (1464 molecules from 121 targets, Supporting Information Table S2). We hypothesized that the best alignments would be between molecules that shared a high degree of 2D similarity. Across all alignment pairs in the data set, there is a weak negative correlation between native binding pose recovery and maximum common 2D substructure similarity between molecule pairs (R2 = 0.17, slope = –6.34) (Figure 4A). Considering only the best alignment pair per target molecule (R2 = 0.15, slope = –1.89) (Figure 4B) or only the alignment pairs where the native binding pose of the target molecule was recovered at ≤2.0 Å (R2 = 0.13, slope = –0.67) (Figure 4A), the correlation becomes slightly weaker. These results suggest that higher 2D similarity can increase the likelihood of recovering the native binding pose but that BCL::MolAlign recovers a large fraction of native binding poses by aligning dissimilar molecules.
Figure 4.

RMSD to native binding pose as a function of maximum common substructure similarity across the AstraZeneca overlay sets. Comparisons were made for all molecule pairs (A), the best alignment for each molecule as measured by symmetry RMSD to the native pose (B), and for all pairs with a symmetry RMSD to native pose ≤2.0 Å (C). The substructures were defined by comparing the atom by element IDs and the bonds by bond order (including specification of aromaticity and/or inclusion in a ring). Similarity between each molecule pair is the maximum common substructure Tanimoto similarity.
We also investigated whether or not BCL::MolAlign converged on energetically unfavorable conformations. For each pairwise alignment in the AstraZeneca Overlay Set benchmark, we computed the BCL::Conf score for the target molecule (i.e., the molecule being aligned to the rigid comparator). For each target molecule, we also generated conformers with BCL::Conf using the same settings that are run in the alignment protocol and selected the single highest scoring (worst) BCL::Conf conformer. Overall, there were no cases in which the conformer selected from alignment had a worse BCL::Conf rotamer-propensity score than the most unfavorable conformer generated by BCL::Conf conformer generation. We also evaluated the mean difference between the alignment conformers and either the (1) worst BCL::Conf conformer or (2) the native conformer. The resulting mean BCL::Conf score differences are –0.24 and 0.16, respectively, suggesting that overall BCL::MolAlign conformers converge on marginally more favorable poses than those generated strictly by BCL::Conf but that they are not always as favorable as native conformers. This latter observation is not unexpected, and overall, these findings suggest that the alignment conformers represent reasonable molecule conformations.
BCL::MolAlign Alignment Scores Positively Predict Bioactivity on Sample DUD Data Sets.
Given the high rate at which BCL::MolAlign was able to recover native-like ligand alignments, we hypothesized that the BCL::MolAlign alignment score could be used to distinguish active from inactive compounds. To test this hypothesis, we benchmarked the predictive capabilities of BCL::MolAlign against recently published state-of-the-art software44 on the 10 published data sets from the Directory of Useful Decoys (DUD) provided on the Kihara Lab server (http://kiharalab.org/ps_ligandset/). Each data set was comprised of 20–50 active and 1500–3000 inactive compounds from the DUD database.45,46 We first randomized molecular conformers by creating a 3D conformer for each molecule with BCL::Conf. We employed BCL::MolAlign to align all active and inactive compounds to a cognate ligand in its native binding pose (one cognate ligand was provided with each data set). We also compared BCL::MolAlign to predictions made on the basis of the maximum common substructure (MCS) Tanimoto similarity score to the cognate ligand. Because the DUD data sets were generated to enforce 2D substructure dissimilarity between active and decoy compounds,45,46 methods whose output correlates with 2D similarity are artificially advantaged relative to other methods. For this reason, we did not compare BCL::MolAlign to docking methods for virtual screening.
Overall, our results are competitive. The highest AUC on 7/10 data sets was achieved with predictions made with BCL::MolAlign, followed by MCS similarity and then PL-PatchSurfer2 (Table 3). AUC scores for BCL::MolAlign and the MCS similarity method are positively correlated with the mean MCS similarity of the active compounds to the cognate ligand (R2 = 0.64 for BCL::MolAlign; R2 = 0.65 for the MCS similarity method). In comparison, PL-PatchSurfer2 AUC scores were not correlated to the active compound mean MCS similarity (R2 = 0.02). Generally, BCL::MolAlign displays intermediate performance on metrics of early enrichment (Table 3), although PL-Patchsurfer2 typically performs best in early enrichment, possibly due to the use of receptor structural information.
Table 3.
Virtual Screening Results on 10 DUD Targetsa
| Method | |||||||||||
|---|---|---|---|---|---|---|---|---|---|---|---|
| Target | Average Similarity to Cognate Ligand | BCL::MolAlign | Maximum Common Substructure Similarity |
PL-PatchSurfer2 | |||||||
| Actives | Decoys | AUC | ROCE1% | ROCE5% | AUC | ROCE1% | roce5% | AUC | ROCE1% | roce5% | |
| ACHE | 0.45 ±0.21 | 0.20 ±0.07 | 0.9 | 71.6 | 15.3 | 0.9 | 95.6 | 28.8 | 0.7 | 28.6 | 7.2 |
| CDK2 | 0.19 ±0.04 | 0.20 ± 0.04 | 0.5 | 2.1 | 3.0 | 0.4 | 0.0 | 0.4 | 0.5 | 109.9 | 6.6 |
| ERA | 0.28 ±0.12 | 0.18 ±0.05 | 0.9 | 49.0 | 20.2 | 0.8 | 172.2 | 12.2 | 0.5 | 12.4 | 4.7 |
| HIVPR | 0.13 ±0.04 | 0.12 ±0.03 | 0.7 | 1.9 | 3.2 | 0.6 | 2.0 | 0.4 | 0.7 | 121.8 | 11.9 |
| NA | 0.34 ±0.14 | 0.14 ±0.07 | 0.9 | 107.0 | 19.9 | 0.9 | 10.3 | 25.4 | 0.5 | 29.6 | 3.1 |
| P38 | 0.16 ±0.09 | 0.15 ±0.04 | 0.7 | 14.5 | 7.4 | 0.3 | 14.5 | 2.1 | 0.6 | 18.6 | 5.3 |
| PPARG | 0.59 ±0.29 | 0.15 ±0.05 | 0.9 | 62.7 | 29.1 | 1.0 | 656.0 | 41.3 | 0.5 | 0.0 | 0.5 |
| RXRA | 0.69 ±0.13 | 0.18 ±0.07 | 1.0 | 1.0 | 48.0 | 1.0 | 145.0 | 52.7 | 0.7 | 14.5 | 5.8 |
| SRC | 0.14 ±0.03 | 0.18 ±0.06 | 0.6 | 1.7 | 2.1 | 0.2 | 0.0 | 0.0 | 0.6 | 148.3 | 10.0 |
| THROMBIN | 0.15 ±0.06 | 0.14 ±0.05 | 0.8 | 1.6 | 1.6 | 0.7 | 1.5 | 1.3 | 0.6 | 10.3 | 6.2 |
| Median | -- | -- | 0.8 | 8.3 | 11.4 | 0.8 | 12.4 | 7.2 | 0.6 | 23.6 | 6.0 |
Evaluation of the virtual screening performance of BCL::MolAlign compared to maximum common substructure similarity and PL-PatchSurfer2 on 10 targets originally reported by Shin et al.44 Similarity was measured as the maximum common connected substructure Tanimoto score. Substructures were defined by maching atoms by atomic numbers and bonds by bond order (with aromatic bonds given a distinct bond order), and ring membership.
Interestingly, BCL::MolAlign performs substantially worse at median ROCE1% than either the MCS similarity method or PL-PatchSurfer2 on these data sets while outperforming them on median ROCE5% and median AUC. A method that performs well on ROCE1% while performing worse on AUC or ROCE5% suggests an early enrichment/chemotype bias. This limited analysis potentially suggests that at least these other two methods are more subject to chemotype bias than BCL::MolAlign.
It is also worth noting that the predictive capabilities of the BCL::MolAlign scores are dependent on 2D similarity. This is interesting because a similar relationship was not observed when evaluating native binding pose recovery across the AstraZeneca Overlays set. Overall, these results suggest that the best method to use may depend on the similarity between the cognate ligand and other actives in the data set. Nevertheless, we anticipate that the use of such complementary metrics as descriptors in quantitative structure–activity relationship (QSAR) models could be advantageous.
BCL::MolAlign Outperforms Docking and Substructure-Based Alignment in Recovery of Receptor-Bound Poses of Congeneric Ligands.
In the later stages of drug discovery, protein–ligand docking is often employed to inform further derivatization of lead compounds. Accurate ranking of the small molecules based on their affinity depends on their accurate placement in the protein binding pocket. Here, we compared the speed and accuracy of BCL::MolAlign to RosettaLigand on 20 unique data sets each with 4–8 congeneric ligands bound in the same protein binding pocket with a similar binding mode.47 RosettaLigand is a fully flexible protein–ligand docking program distributed with the Rosetta software package, which is competitive with other state-of-the-art docking programs.47–53 We employed BCL::MolAlign to align each target ligand to a scaffold ligand from each data set. We took the geometric centroid of the same scaffold ligand as the starting position for RosettaLigand docking trials. The scaffold ligands were selected on the basis of the chronology of earliest deposition in the Protein Data Bank (PDB). All alignment and docking trials were performed starting from randomly generated ligand conformers. In this way, the benchmark emulates a realistic drug discovery process, in which the binding mode of the single earliest cocrystallized complex guides virtual screening.
Across all data sets, the top-scoring RosettaLigand model by protein-ligand interaction score for each protein-ligand complex was within 2.0 A of the experimentally determined binding poses in 60% of cases. In contrast, the top-scoring model by property distance to the scaffold ligand in BCL::MolAlign identified the correct binding pose in 86% of cases (82% of cases when self-alignments are excluded). To generate one model with RosettaLigand using the protocol described in the Methods section takes approximately 90 s. A typical docking run requires approximately 102–103 independent docking trials47,48 to produce a native-like binding pose. In this benchmark, we generated 1000 models for each data set. In comparison, a single alignment with five serial independent trajectories in BCL::MolAlign takes on average approximately 46 s (9.2 s per trajectory, single CPU thread) on Intel Xeon X5690 processors. On a 12-core workstation, for example, this allows screening of approximately 45,000 ligands against a single scaffold ligand in 24 h.
Performance on 3 of the 20 data sets in particular (HCV, TPPHO, and CTAP) was previously found to be improved by simultaneous docking of the ligands within each binding pocket compared to traditional docking.47 We found that BCL::MolAlign similarly provides an advantage over RosettaLigand docking in these data sets. This is most clear in the HCV data set (Figure 5, row 1). The binding pocket is large with multiple favorably scoring binding modes, and in only 2/6 cases did RosettaLigand recover a native-like binding pose as the top-scoring model. In contrast, BCL::MOLALIGN was able to recover native-like poses in 5/6 cases by superimposing to the earliest available scaffold (PDB ID 3BR9). Similarly, failure of RosettaLigand to properly place the core bisubstituted aromatic ring structure occurred systemically in the CTAP data set here and elsewhere47 (Figure 5, row 3). The resultant translational error caused RosettaLigand to only recover native-like binding poses in 3/6 cases, while BCL::MOLALIGN accurately recovered 6/6.
Figure 5.
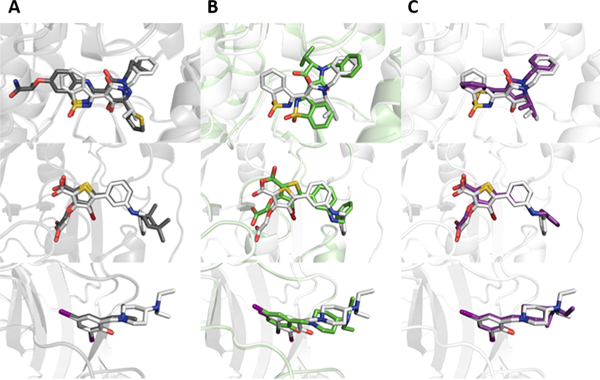
Visual representations of docked versus aligned poses in challenging docking targets. Comparisons show the protein–ligand complexes of the crystallized scaffold (gray) and crystallized target (white) molecules (A). The crystallized pose of the target molecule (white) is also shown with the RosettaLigand docked pose (green; B) and the BCL::MolAlign flexibly aligned pose (purple; C). Examples correspond to molecules from the HCV (row one), TPPHO (row two), and CTAP (row three) data sets.
Given the high degree of substructure similarity between the ligands in each congeneric set, an important question is whether or not BCL::MolAlign provides a benefit over a substructure-based alignment method. To test this, we generated 100 conformers of each ligand with BCL::Conf and aligned all conformers to their respective scaffold molecules based on maximum common substructure. Substructure-based alignments were performed with the BCL alignment tool AlignToScaffold (ATS) as described in the Methods section. First, we compared the abilities of BCL::MolAlign and ATS to recover native binding poses when the input target molecule was the native conformation. Across all 20 data sets, BCL::MolAlign recovered 96% of the native binding poses, while ATS recovered 89% (Table 4). Next, we utilized multiple scoring metrics to try and optimize recovery of the native pose with ATS. To evaluate which conformer of the target ligand yielded the best fit to the scaffold, we used an RMSD100-like metric.40 With this scoring system, we were able to recover 71% of the native binding poses. Subsequently, we used a property-weighted version of the RMSD100-like metric (previously termed “ChargeRMSD”)40 and improved recovery of the ATS alignments to 75%. Finally, we performed ATS and scored the resultant alignments with the BCL::MolAlign scoring system, with which we again improved recovery to 78%, but it was still below the 86% recovery of BCL::MolAlign (Table 4).
Table 4.
Comparison between BCL::MolAlign and Maximum Common Substructure-Based Alignment of Congeneric Ligands
| maximum common substructure alignment |
BCL::MolAlign |
||||||
|---|---|---|---|---|---|---|---|
| data set | total | native conformer | RMSD | ChargeRMSD | MolAlign score | native conformer | flexible alignment |
| AR | 5 | 5 | 5 | 5 | 5 | 5 | 5 |
| AVGLU | 5 | 5 | 5 | 4 | 4 | 5 | 4 |
| BETAX | 5 | 5 | 5 | 5 | 5 | 5 | 5 |
| CALM | 5 | 4 | 5 | 5 | 5 | 5 | 5 |
| CATB | 6 | 6 | 5 | 5 | 5 | 4 | 6 |
| CDK2 | 7 | 6 | 5 | 7 | 3 | 7 | 3 |
| CTAP | 6 | 6 | 3 | 3 | 3 | 6 | 6 |
| FXA | 4 | 4 | 3 | 4 | 3 | 3 | 3 |
| GLCB | 5 | 2 | 2 | 2 | 4 | 5 | 5 |
| HCV | 6 | 4 | 4 | 4 | 6 | 6 | 6 |
| HSP90 | 6 | 3 | 2 | 2 | 5 | 6 | 6 |
| LPXC | 5 | 5 | 5 | 5 | 5 | 5 | 5 |
| MTAN | 7 | 5 | 2 | 3 | 5 | 7 | 5 |
| P38 | 4 | 4 | 2 | 3 | 2 | 4 | 3 |
| PNMT | 5 | 5 | 2 | 2 | 2 | 5 | 2 |
| RET | 4 | 4 | 4 | 4 | 4 | 4 | 4 |
| SYK | 8 | 8 | 6 | 6 | 6 | 8 | 7 |
| THERM | 7 | 7 | 6 | 6 | 5 | 6 | 5 |
| THROM | 5 | 5 | 5 | 5 | 4 | 5 | 5 |
| TPPHO | 6 | 6 | 3 | 3 | 6 | 6 | 5 |
| total | 111 | 99 | 79 | 83 | 87 | 107 | 95 |
| % recovery | 89% | 71% | 75% | 78% | 96% | 86% | |
CONCLUSIONS
In summary, we have developed a novel small molecule flexible alignment algorithm called BCL::MolAlign. BCL::MolAlign utilizes multitiered MCM sampling to superimpose and flexibly refine molecular conformers according to a customizable property-based metric. It combines established molecular conformer generator capabilities with on-the-fly dihedral angle optimization for refinement. We have benchmarked BCL::MolAlign against state-of-the-art commercial and free software. Generally, BCL::MolAlign performs on par with, or superior to, similar software packages. Alignments generated with BCL::MolAlign can serve as pharmacophore hypotheses, aid in the selection of ligand conformers and starting poses for protein–ligand docking, and identify likely 3D conformers based on template compounds. When a starting binding pose is available for a protein–ligand complex, BCL::MolAlign is capable of identifying native-like binding poses for large libraries of small molecules in parallel. We demonstrate how BCL::MolAlign can be used to improve the efficacy of ensemble docking programs including RosettaLigandEnsemble.47 Moreover, we have demonstrated that the BCL::MolAlign alignment score has predictive value and can be used to distinguish active from inactive compounds. As an extension to this finding, we also anticipate that the alignment score could make a valuable descriptor in QSAR models. Finally, BCL::MolAlign was designed to facilitate high-throughput screening of small molecule libraries. It is “embarrassingly parallel” in its implementation, allowing independent alignments to occur simultaneously across multiple threads. As a result, BCL::MolAlign is fit for medium- to high-throughput application projects in academia and industry.
METHODS
Benchmarking Data Set Preparation.
The CDK2, HIV, P38, ESR1, trypsin, and rhinovirus data set comparisons were assembled from the PDB IDs in Chan and Labute.34 Protein–ligand cocrystal structures were superimposed by Cα atoms of the ligand binding pocket in PyMol.54 The positions of each ligand in the protein–ligand cocrystal structure alignment were taken to be native/scaffold poses. The DUD data sets prepared for the virtual screening comparisons were obtained from the Kihara Lab at http://kiharalab.org/ps_ligandset/. The cognate ligands provided with each data set were taken to be the scaffolds. All datasets used in the benchmark are available upon request. Comparisons with RosettaLigand were completed using 20 protein–ligand data sets from Fu and Meiler.47 Target ligands were assigned a random 3D conformer prior to flexible alignment to scaffolds. Tanimoto largest common substructure comparisons were performed in the BCL. Substructures were defined by matching atoms by atomic numbers and bonds by bond order (with aromatic bonds given a distinct bond order), and ring membership.
Chemical Properties.
All BCL::MolAlign alignments were performed with the same set of chemical properties. For each atom type, we computed Gasteiger partial charges,55 polarizability,56 electronegativity,57 hydrophobicity,34 van der Waals volume,58 aromaticity,59 hydrogen bond donor (OH/NH), and hydrogen bond acceptor (O/N) status. Aromaticity is calculated as the Marvin General method,59 which has similarities to the more common Daylight method.60 Electro-negativity values are determined by element type from standard periodic table values. As in Chan and Labute, those atoms which are at least two bonds away from a hydrogen-bonding atom are designated as hydrophobic.34 Property weights listed in Supporting Information Table S1 were obtained as previously described by computing the inverse standard deviation of each property’s occurrence across a sample library of drug-like small molecules.40,41
Alignment Parameters.
BCL::MolAlign is based on a Monte Carlo–metropolis architecture. Accordingly, random moves are scored and accepted if they either (1) improve upon the existing score or (2) fail to improve the existing score but win a “coin toss” with a probability of winning that is dependent on the change in score and on the temperature of the simulation.38 Higher temperatures increase the likelihood of a move being accepted. We utilize a temperature-control system which automatically adjusts every 10 iterations such that the initial acceptance rate at the beginning of the simulation is 50% and the final acceptance rate is 1%. The target ratio adjusts linearly over the course of a trajectory.
First, all molecules are assigned explicit hydrogen atoms and Gasteiger atom types.55 Next, a random 3D molecular conformer is generated for each molecule with BCL::Conf.36 BCL::MolAlign alignments were performed with the following parameters: 100 conformers were generated for each molecule except for those in the CDK2 and HIV data sets for which 500 and 2000 conformers were generated, respectively; the number of conformer pairs is set equal to the number of conformers for the purposes of this benchmark; 400 iterations were performed for the MC Optimization Tier 1 but terminated early if the score failed to improve after 160 consecutive iterations; 600 iterations were performed for the MC Optimization Tier 2 but terminated early if the score failed to improve after 240 consecutive iterations; 200 iterations were performed for the MC Optimization Tier 3 but terminated early if the score failed to improve after 80 consecutive iterations; 5 independent trajectories with random maximum atom distances between 0.70 and 1.20 Å; rescoring to normalized maximum atom distances was completed on the top 5 molecules from each independent trajectory; a mismatch penalty constant of 2.0 was used throughout. All alignments were performed with the properties and property weights outlined in Supporting Information Table S1. Collectively, these values are specified as the default settings in BCL::MOLALIGN, with the exception of the number of conformers and conformer pairs, which have been set to default values of 500 and 100, respectively. These settings are also implemented as defaults in the BCL::MolAlign Web server. For additional details and command lines, see the Supplementary Methods section of the Supporting Information. Performance benchmarks comparing RosettaLigand with BCL::MolAlign were completed on Intel Xeon X5690 processors using a single CPU thread per process.
Supplementary Material
ACKNOWLEDGMENTS
The authors gratefully acknowledge the assistance of Alex Geanes in the early stages of this work. Research reported in this publication was supported by NIGMS of the National Institutes of Health under award number T32GM007347. Work in the Meiler laboratory is supported through the NIH (R01GM080403, R01GM099842, R01GM073151). B.P.B. is supported through NIH (F30 DK118774). The content is solely the responsibility of the authors and does not necessarily represent the official views of the National Institutes of Health.
Footnotes
ASSOCIATED CONTENT
Supporting Information
The Supporting Information is available free of charge on the ACS Publications website at DOI: 10.1021/acs.jcim.9b00020.
Additional data for algorithm parametrization (Figures S1 and S2), chemical properties used for alignment and their corresponding weights (Table S1), pairwise alignment results across each of the AstraZeneca Overlays Benchmark Sets organized by UniProt ID (Table S2), summarized motivation for key aspects of algorithm development (Table S3), command lines to use BCL::MolAlign and other tasks in the BCL (Supplementary Methods), and additional methodological details (Supplementary Methods) (PDF)
The authors declare no competing financial interest.
REFERENCES
- (1).Wolber G; Seidel T; Bendix F; Langer T Molecule-Pharmacophore Superpositioning and Pattern Matching in Computational Drug Design. Drug Discovery Today 2008, 13, 23–29. [DOI] [PubMed] [Google Scholar]
- (2).Vieth M; Hirst JD; Brooks CL III Do Active Site Conformations of Small Ligands Correspond to Low Free-Energy Solution Structures? J. Comput.-Aided Mol. Des. 1998, 12, 563–572. [DOI] [PubMed] [Google Scholar]
- (3).Perola E; Charifson PS Conformational Analysis of Drug-Like Molecules Bound to Proteins: An Extensive Study of Ligand Reorganization Upon Binding. J. Med. Chem. 2004, 47, 2499–2510. [DOI] [PubMed] [Google Scholar]
- (4).Hao M-H; Haq O; Muegge I Torsion Angle Preference and Energetics of Small-Molecule Ligands Bound to Proteins. J. Chem. Inf. Model. 2007, 47, 2242–2252. [DOI] [PubMed] [Google Scholar]
- (5).Seo M-H; Park J; Kim E; Hohng S; Kim H-S Protein Conformational Dynamics Dictate the Binding Affinity for a Ligand. Nat. Commun. 2014, 5, No. 3724. [DOI] [PubMed] [Google Scholar]
- (6).Greives N; Zhou H-X Both Protein Dynamics and Ligand Concentration Can Shift the Binding Mechanism between Conformational Selection and Induced Fit. Proc. Natl. Acad. Sci. U. S. A. 2014, 111, 10197–10202. [DOI] [PMC free article] [PubMed] [Google Scholar]
- (7).Yang S-Y Pharmacophore Modeling and Applications in Drug Discovery: Challenges and Recent Advances. Drug Discovery Today 2010, 15, 444–450. [DOI] [PubMed] [Google Scholar]
- (8).Vlachakis D; Fakourelis P; Megalooikonomou V; Makris C; Kossida S Drugon: A Fully Integrated Pharmacophore Modeling and Structure Optimization Toolkit. PeerJ 2015, 3, No. e725. [DOI] [PMC free article] [PubMed] [Google Scholar]
- (9).Beccari AR; Cavazzoni C; Beato C; Costantino G Ligen: A High Performance Workflow for Chemistry Driven De Novo Design. J. Chem. Inf. Model. 2013, 53, 1518–1527. [DOI] [PubMed] [Google Scholar]
- (10).Leelananda SP; Lindert S Computational Methods in Drug Discovery. Beilstein J. Org. Chem. 2016, 12, 2694–2718. [DOI] [PMC free article] [PubMed] [Google Scholar]
- (11).Sliwoski G; Kothiwale S; Meiler J; Lowe EW Jr. Computational Methods in Drug Discovery. Pharmacol. Rev. 2014, 66, 334–395. [DOI] [PMC free article] [PubMed] [Google Scholar]
- (12).Hecker EA; Duraiswami C; Andrea TA; Diller DJ Use of Catalyst Pharmacophore Models for Screening of Large Combinatorial Libraries. J. Chem. Inf. Comput. Sci. 2002, 42, 1204–1211. [DOI] [PubMed] [Google Scholar]
- (13).Comparative Molecular Field Analysis (Comfa). 1. Effect of Shape on Binding of Steroids to Carrier Proteins - Journal of the American Chemical Society. https://pubs-acs-org.proxy.library.vanderbilt.edu/doi/abs/10.1021/ja00226a005 (October 27, 2018). [DOI] [PubMed] [Google Scholar]
- (14).Kubinyi H Comparative Molecular Field Analysis (Comfa) In Handbook of Chemoinformatics; Gasteiger J, Ed.; Wiley-VCH Verlag GmbH: 2003; pp 1555–1574. [Google Scholar]
- (15).Cleves AE; Jain AN Quantitative Surface Field Analysis: Learning Causal Models to Predict Ligand Binding Affinity and Pose. J. Comput.-Aided Mol. Des. 2018, 32, 731. [DOI] [PMC free article] [PubMed] [Google Scholar]
- (16).Chan SL Molalign: An Algorithm for Aligning Multiple Small Molecules. J. Comput.-Aided Mol Des. 2017, 31, 523–546. [DOI] [PubMed] [Google Scholar]
- (17).Roy A; Skolnick J Ligsift: An Open-Source Tool for Ligand Structural Alignment and Virtual Screening. Bioinformatics 2015, 31, 539–544. [DOI] [PMC free article] [PubMed] [Google Scholar]
- (18).Urniaz RD; Jozwiak K X-Ray Crystallographic Structures as a Source of Ligand Alignment in 3d-Qsar. J. Chem. Inf. Model. 2013, 53, 1406–1414. [DOI] [PubMed] [Google Scholar]
- (19).Thormann M; Klamt A; Wichmann K Cosmosim3d: 3d-Similarity and Alignment Based on Cosmo Polarization Charge Densities. J. Chem. Inf. Model. 2012, 52, 2149–2156. [DOI] [PubMed] [Google Scholar]
- (20).Sastry GM; Dixon SL; Sherman W Rapid Shape-Based Ligand Alignment and Virtual Screening Method Based on Atom/ Feature-Pair Similarities and Volume Overlap Scoring. J. Chem. Inf. Model. 2011, 51, 2455–2466. [DOI] [PubMed] [Google Scholar]
- (21).Tosco P; Balle T; Shiri F Open3dalign: An Open-Source Software Aimed at Unsupervised Ligand Alignment. J. Comput.-Aided Mol. Des. 2011, 25, 777–783. [DOI] [PubMed] [Google Scholar]
- (22).Korb O; Monecke P; Hessler G; Stutzle T; Exner TE Pharmacophore: Multiple Flexible Ligand Alignment Based on Ant Colony Optimization. J. Chem. Inf. Model. 2010, 50, 1669–1681. [DOI] [PubMed] [Google Scholar]
- (23).Heifets A; Lilien RH Ligalign: Flexible Ligand-Based Active Site Alignment and Analysis. J. Mol Graphics Modell. 2010, 29, 93–101. [DOI] [PubMed] [Google Scholar]
- (24).Jain AN Surflex-Dock 2.1: Robust Performance from Ligand Energetic Modeling, Ring Flexibility, and Knowledge-Based Search. J. Comput.-Aided Mol. Des. 2007, 21, 281–306. [DOI] [PubMed] [Google Scholar]
- (25).Richmond NJ; Abrams CA; Wolohan PR; Abrahamian E; Willett P; Clark RD Galahad: 1. Pharmacophore Identification by Hypermolecular Alignment of Ligands in 3d. J. Comput.-Aided Mol. Des. 2006, 20, 567–587. [DOI] [PubMed] [Google Scholar]
- (26).Wildman SA; Crippen GM Evaluation of Ligand Overlap by Atomic Parameters. J. Chem. Inf. Comput. Sci. 2001, 41, 446–450. [DOI] [PubMed] [Google Scholar]
- (27).McGaughey GB; Sheridan RP; Bayly CI; Culberson JC; Kreatsoulas C; Lindsley S; Maiorov V; Truchon JF; Cornell WD Comparison of Topological, Shape, and Docking Methods in Virtual Screening. J. Chem. Inf. Model. 2007, 47, 1504–1519. [DOI] [PubMed] [Google Scholar]
- (28).Tawa GJ; Baber JC; Humblet C Computation of 3d Queries for Rocs Based Virtual Screens. J. Comput.-Aided Mol. Des. 2009, 23, 853–868. [DOI] [PubMed] [Google Scholar]
- (29).Proschak E; Rupp M; Derksen S; Schneider G Shapelets: Possibilities and Limitations of Shape-Based Virtual Screening. J. Comput. Chem. 2008, 29, 108–114. [DOI] [PubMed] [Google Scholar]
- (30).Tervo AJ; Rönkkö T; Nyrönen TH; Poso A Brutus: Optimization of a Grid-Based Similarity Function for Rigid-Body Molecular Superposition. 1. Alignment and Virtual Screening Applications. J. Med. Chem. 2005, 48, 4076–4086. [DOI] [PubMed] [Google Scholar]
- (31).Cheeseright T; Mackey M; Rose S; Vinter A Molecular Field Extrema as Descriptors of Biological Activity: Definition and Validation. J. Chem. Inf. Model. 2006, 46, 665–676. [DOI] [PubMed] [Google Scholar]
- (32).Shin W-H; Zhu X; Bures M; Kihara D Three-Dimensional Compound Comparison Methods and Their Application in Drug Discovery. Molecules 2015, 20, 12841. [DOI] [PMC free article] [PubMed] [Google Scholar]
- (33).Andrews KM; Cramer RD Toward General Methods of Targeted Library Design. Topomer Shape Similarity Searching with Diverse Structures as Queries. J. Med. Chem. 2000, 43, 1723–1740. [DOI] [PubMed] [Google Scholar]
- (34).Chan SL; Labute P Training a Scoring Function for the Alignment of Small Molecules. J. Chem. Inf. Model. 2010, 50, 1724–1735. [DOI] [PMC free article] [PubMed] [Google Scholar]
- (35).Labute P; Williams C; Feher M; Sourial E; Schmidt JM Flexible Alignment of Small Molecules. J. Med. Chem. 2001, 44, 1483–1490. [DOI] [PubMed] [Google Scholar]
- (36).Kothiwale S; Mendenhall JL; Meiler J Bcl::Conf: Small Molecule Conformational Sampling Using a Knowledge Based Rotamer Library. J. Chem. inf. 2015, 7, 47. [DOI] [PMC free article] [PubMed] [Google Scholar]
- (37).Vainio MJ; Puranen JS; Johnson MS Shaep: Molecular Overlay Based on Shape and Electrostatic Potential. J. Chem. Inf. Model. 2009, 49, 492–502. [DOI] [PubMed] [Google Scholar]
- (38).Karakas M; Woetzel N; Staritzbichler R; Alexander N; Weiner BE; Meiler J Bcl::Fold-De Novo Prediction of Complex and Large Protein Topologies by Assembly of Secondary Structure Elements. PLoS One 2012, 7, No. e49240. [DOI] [PMC free article] [PubMed] [Google Scholar]
- (39).Kuffner JJ Effective Sampling and Distance Metrics for 3d Rigid Body Path Planning. IEEE International Conference on Robotics and Automation 2004. Proceedings. ICRA ‘04 2004, 4, 3993–3998. [Google Scholar]
- (40).Gregory KJ; Nguyen ED; Malosh C; Mendenhall JL; Zic JZ; Bates BS; Noetzel MJ; Squire EF; Turner EM; Rook JM; Emmitte KA; Stauffer SR; Lindsley CW; Meiler J; Conn PJ Identification of Specific Ligand-Receptor Interactions That Govern Binding and Cooperativity of Diverse Modulators to a Common Metabotropic Glutamate Receptor 5 Allosteric Site. ACS Chem. Neurosci. 2014, 5, 282–295. [DOI] [PMC free article] [PubMed] [Google Scholar]
- (41).Butkiewicz M; Lowe EW Jr.; Mueller R; Mendenhall JL; Teixeira PL; Weaver CD; Meiler J Benchmarking Ligand-Based Virtual High-Throughput Screening with the Pubchem Database. Molecules 2013, 18, 735–756. [DOI] [PMC free article] [PubMed] [Google Scholar]
- (42).Giangreco I; Cosgrove DA; Packer MJ An Extensive and Diverse Set of Molecular Overlays for the Validation of Pharmacophore Programs. J. Chem. Inf. Model. 2013, 53, 852–866. [DOI] [PubMed] [Google Scholar]
- (43).Chen Q; Higgs RE; Vieth M Geometric Accuracy of Three-Dimensional Molecular Overlays. J. Chem. Inf. Model. 2006, 46, 1996–2002. [DOI] [PubMed] [Google Scholar]
- (44).Shin W-H; Bures MG; Kihara D Patchsurfers: Two Methods for Local Molecular Property-Based Binding Ligand Prediction. Methods (Amsterdam, Neth.) 2016, 93, 41–50. [DOI] [PMC free article] [PubMed] [Google Scholar]
- (45).Mysinger MM; Carchia M; Irwin JJ; Shoichet BK Directory of Useful Decoys, Enhanced (Dud-E): Better Ligands and Decoys for Better Benchmarking. J. Med. Chem. 2012, 55, 6582–6594. [DOI] [PMC free article] [PubMed] [Google Scholar]
- (46).Huang N; Shoichet BK; Irwin JJ Benchmarking Sets for Molecular Docking. J. Med. Chem. 2006, 49, 6789–6801. [DOI] [PMC free article] [PubMed] [Google Scholar]
- (47).Fu DY; Meiler J Rosettaligandensemble: A Small-Molecule Ensemble-Driven Docking Approach. ACS Omega 2018, 3, 3655–3664. [DOI] [PMC free article] [PubMed] [Google Scholar]
- (48).DeLuca S; Khar K; Meiler J Fully Flexible Docking of Medium Sized Ligand Libraries with Rosettaligand. PLoS One 2015, 10, No. e0132508. [DOI] [PMC free article] [PubMed] [Google Scholar]
- (49).Lemmon G; Meiler J Rosetta Ligand Docking with Flexible Xml Protocols. Methods Mol. Biol. 2012, 819, 143–155. [DOI] [PMC free article] [PubMed] [Google Scholar]
- (50).Kaufmann KW; Meiler J Using Rosettaligand for Small Molecule Docking into Comparative Models. PLoS One 2012, 7, No. e50769. [DOI] [PMC free article] [PubMed] [Google Scholar]
- (51).Davis IW; Raha K; Head MS; Baker D Blind Docking of Pharmaceutically Relevant Compounds Using Rosettaligand. Protein Sci. 2009, 18, 1998–2002. [DOI] [PMC free article] [PubMed] [Google Scholar]
- (52).Davis IW; Baker D Rosettaligand Docking with Full Ligand and Receptor Flexibility. J. Mol. Biol. 2009, 385, 381–392. [DOI] [PubMed] [Google Scholar]
- (53).Meiler J; Baker D Rosettaligand: Protein-Small Molecule Docking with Full Side-Chain Flexibility. Proteins: Struct, Funct., Genet. 2006, 65, 538–548. [DOI] [PubMed] [Google Scholar]
- (54).DeLano WL The Pymol Molecular Graphics System 1.0; DeLano Scientific LLC: Palo Alto, CA, 2007.
- (55).Gasteiger J; Marsili M Iterative Partial Equalization of Oribital Electronegativity - a Rapid Access to Atomic Charges. Tetrahedron 1980, 36, 3219–3228. [Google Scholar]
- (56).Miller KJ Additivity Methods in Molecular Polarizability. J. Am. Chem. Soc. 1990, 112, 8533–8542. [Google Scholar]
- (57).Pauling L The Nature of the Chemical Bond. Iv. The Energy of Single Bonds and the Relative Electronegativity of Atoms. J. Am. Chem. Soc. 1932, 54, 3570–3582. [Google Scholar]
- (58).Labute P A Widely Applicable Set of Descriptors. J. Mol. Graphics Modell. 2000, 18, 464–477. [DOI] [PubMed] [Google Scholar]
- (59).Aromaticity Detection in Marvin.
- (60).Daylight Theory: Smiles.
Associated Data
This section collects any data citations, data availability statements, or supplementary materials included in this article.