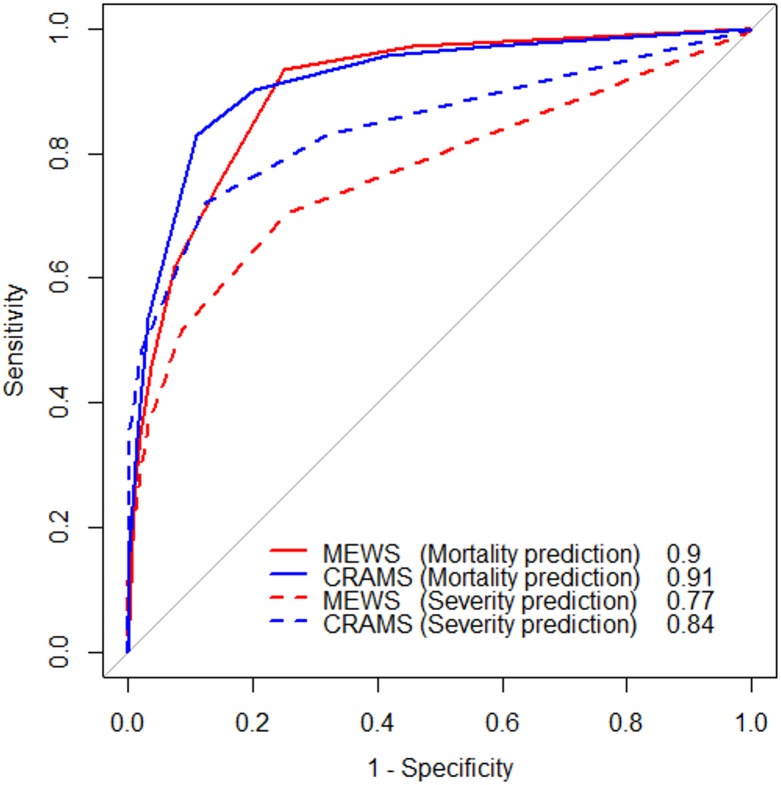
Figure 3. Receiver operating characteristic (ROC) curve of the study population.
The red solid line is the ROC curve of MEWS in-hospital mortality prediction. The blue solid line is the ROC curve of CRAMS in-hospital mortality prediction. The red dashed line is the ROC curve of MEWS trauma severity prediction. The blue dashed line is the ROC curve of CRAMS trauma severity prediction.

