Abstract
The purpose of this study was to determine the correlation between human observer performance for localization of small low contrast lesions within uniform water background versus an anatomical liver background, under the conditions of varying dose, lesion size, and reconstruction algorithm.
Liver lesions (5 mm, 7 mm, and 9 mm, contrast: −21 HU) were digitally inserted into CT projection data of ten normal patients in vessel-free liver regions. Noise was inserted into the projection data to create three image sets: full dose and simulated half and quarter doses. Images were reconstructed with a standard filtered back projection (FBP) and an iterative reconstruction (IR) algorithm. Lesion and noise insertion procedures were repeated with water phantom data. Two-dimensional regions of interest (66 lesion-present, 34 lesion-absent) were selected, randomized, and independently reviewed by three medical physicists to identify the most likely location of the lesion and provide a confidence score. Locations and confidence scores were assessed using the area under the localization receiver operating characteristic curve (AzLROC). We examined the correlation between human performance for the liver and uniform water backgrounds as dose, lesion size, and reconstruction algorithm varied.
As lesion size or dose increased, reader localization performance improved. For full dose IR images, the AzLROC for 5, 7, and 9 mm lesions were 0.53, 0.91, and 0.97 (liver) and 0.51, 0.96, and 0.99 (uniform water), respectively. Similar trends were seen with other parameters. Performance values for liver and uniform backgrounds were highly correlated for both reconstruction algorithms, with a Spearman correlation of ρ = 0.97, and an average difference in AzLROC of 0.05 ± 0.04.
For the task of localizing low contrast liver lesions, human observer performance was highly correlated between anatomical and uniform backgrounds, suggesting that lesion localization studies emulating a clinical test of liver lesion detection can be performed using a uniform background.
Keywords: computed tomography (CT), image quality, radiation dose, iterative reconstruction (IR), low contrast detectability, comparison study, lesion localization
Introduction
Computed tomography (CT) use in the United States has risen drastically in recent years, leading to increased concerns regarding potential cancer risks and increased research in achieving radiation dose reduction in CT applications (Brenner and Hall 2007, Mettler et al 2008, IMV 2016). To reduce the patients’ radiation dose, scanning and reconstruction parameters in CT exams are often modified (AAPM CT Dose Summit 2010, Hendee et al 2010); however, these modifications should not reduce the radiologists’ diagnostic performance in interpreting the images for evidence of disease, such as the presence or growth of liver lesions. To accomplish this goal, it is essential to perform objective and quantitative evaluation of the diagnostic performance as a function of dose level, reconstruction algorithm, and lesion characteristic for the task of liver lesion detection. Human observer studies by radiologists are considered reference standard; however, they are extremely time-consuming and cumbersome (Fletcher et al 2015, McCollough et al 2017). Techniques such as noise and lesion insertion can be used for generating multiple scanning and lesion conditions in an efficient manner, which have allowed for investigation into dose- and lesion-image quality relationships (Seltzer et al 1991, Yu et al 2012, Solomon and Samei 2014, Chen et al 2015, 2016, Xu et al 2015). To further simplify these human observer studies, one question is whether a realistic and anatomical background is needed. If the human observer performance on a uniform background is highly correlated with that on an anatomical liver background, then the quantitative and objective image quality evaluation can be performed on a uniform background, which may allow much more convenient and efficient observer studies.
While several studies have been performed using both anatomical and uniform backgrounds (Baker et al 2012, De Crop et al 2015, Solomon et al 2017), these studies have focused on characterizing the noise properties of the images as background or reconstruction algorithm change, rather than exploring the effect of background type on the diagnostic task under evaluation. Solomon et al performed two-alternative forced choice (2 AFC) perception experiments across six dose levels to compare filtered back projection (FBP) and iterative reconstruction (IR) (Solomon et al 2017). Sixteen readers (six radiologists, ten medical physicists) performed the liver lesion detection task. In addition, the study quantified the noise, lesion contrast, lesion sharpness, and contrast-to-noise ratio. Detection accuracy of the lesions was found to be 2% higher on average with IR (p = 0.03). The study did not compare background types, and the study only focused on lesion detectability, not localization. Our previous work measured diagnostic performance for low contrast object detection and localization in a uniform background (Leng et al 2013, Yu et al 2013). In the object detection task, cylindrical rods with contrast of −15 HU were imaged within a 36 × 25 cm2 water phantom under 21 conditions (three sizes, two reconstructions, three dose levels). Four medical physicists performed 21 2 AFC trials to quantify the impact of FBP and IR on 2D (128 × 128 pixels) CT images with differing doses (Yu et al 2013). In the localization task, three medical physicists identified the presence (or absence) and location of single lesions within 2D (128 × 128 pixels) CT images (Leng et al 2013). In this study, cylindrical rods once again were used to mimic −15 contrast lesions. Four doses and two size rods were used. Both these studies were limited by the use of a uniform water background, and cylindrical rods to mimic lesions.
In Part I of this study, we determined the relationship between human observer performance for two background conditions, namely in a uniform background compared to liver parenchyma. We specifically investigated the task of detection and localization of low contrast, patient-derived liver lesions in these two backgrounds as lesion size, radiation dose level, and reconstruction algorithm were varied. In Part II, we determined the ability of a mathematical model observer to predict the human observer performance demonstrated in Part I.
Methods and materials
Data collection and preparation
This study assessed and compared three readers’ performance in locating liver lesions of varying sizes as the dose, background, and reconstruction algorithm differed. The primary aim was to compare lesion detection and localization performance as the background complexity changed from a uniform water background to anatomical liver parenchyma. A secondary analysis looked at the influence of reconstruction algorithm, dose, and lesion size on localization performance.
To include real liver parenchyma as a background, contrast-enhanced abdominal CT images from ten patients with healthy livers were retrospectively collected with institutional review board approval. A single hypodense liver lesion was segmented from a separate patient data set containing liver lesions, forward projected, and inserted into varying locations of the ten healthy patients using a projection-based lesion insertion method (Chen et al 2015, 2016). A lesion contrast of −21 HU relative to the surrounding liver parenchyma was maintained throughout the insertion process. The locations of the inserted lesions were carefully selected to avoid anatomical landmarks such as liver vessels and organ boundaries. This was done to minimize the recall of the location of specific lesions due to their spatial relationship with such identifying features. To determine the effect of lesion size on reader performance, the same lesion was scaled to 5 mm, 7 mm, or 9 mm in maximum dimension prior to insertion. A validated, in-house noise insertion tool (Yu et al 2012) was used to create images that simulate acquisitions at half and quarter of the original (full) dose (full dose CTDIvol = 10.5 ± 8.5 mGy). All patient data were acquired using our routine abdominal CT exam parameters (CARE kV and CARE Dose, rotation time = 0.5 s, pitch = 0.8, additional settings in table 1) as part of a clinically-indicated contrast-enhanced CT scan (SOMATOM Definition AS +, Siemens Healthcare, Forchheim, Germany). Reconstructions were performed with both FBP and IR (SAFIRE, Siemens Healthcare, Forchheim, Germany) using B40f and I40f (strength = 3) reconstruction kernels, respectively.
Table 1.
Comparison of acquisition and reconstruction parameters between the liver and uniform backgrounds. Similar settings were used, although the liver cases contain greater variability in tube potential (kVp) and dose (CTDIvol).
| Liver background | Uniform background | |
|---|---|---|
| Acquisition parameters | ||
| kVp | 100, 120 kVp | 120 kVp |
| Rotation time | 500 ms | 500 ms |
| CTDIvol | 10.5 ± 8.5 mGy | 9.6 ± 0.1 mGy |
| Reconstruction parameters | ||
| Siice thickness | 5 mm | 5 mm |
| FBP kernel | B40f | B40f |
| IR kernei | I40f, strength 3 | I40f, strength 3 |
The same process of lesion insertion, noise insertion, and reconstruction was performed using a 35 cm × 26 cm torso-shaped phantom filled with water. A fixed CT number was added to the reconstructed images to yield a background of 110 HU, which was equivalent to the average background CT number of the liver in the contrast-enhanced CT scans that were used in our study. Average CTDIvol of the full dose water phantom images was 9.6 ± 0.1 mGy. Additional acquisition and reconstruction parameters for both background scenarios can be seen in table 1.
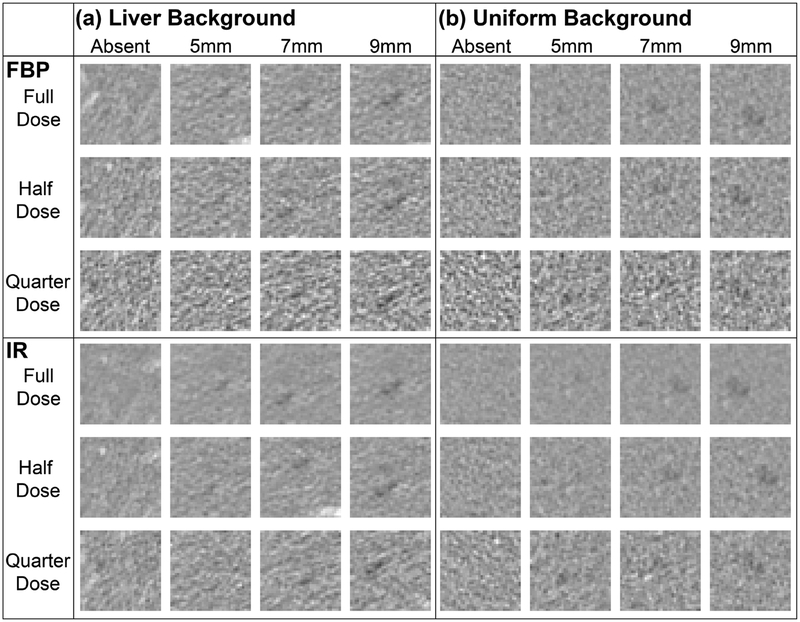
From the reconstructed images, 36 pixel × 36 pixel boxes were used to isolate square regions of interest (ROIs) containing either one lesion or a section of lesion-absent tissue. The boxes were placed such that the lesion location (if present) was randomly distributed within the ROIs with uniform probability of each location being selected so long as lesion truncation would not occur (i.e. the edges of the ROIs were not valid locations for lesion insertion as significant lesion truncation would be present). In total, 36 datasets (2 reconstructions × 2 backgrounds × 3 doses × 3 sizes) of 100 ROIs (66 lesion-present, 34 lesion-absent ROIs) were collected. Sample ROIs can be seen in figure 1.
Figure 1.
Side-by-side comparison of factors studied, including background ((a) liver versus (b) uniform), reconstruction algorithm (FBP versus IR), dose (full, half, and quarter of original acquisition dose), and lesion size (5 mm, 7 mm, and 9 mm).
Background characterization
Using the lesion-absent, full dose images, a background characterization study was performed to test for differences between the anatomical liver and the uniform water backgrounds. Since the liver images were cropped to eliminate anatomical landmarks, tests were needed to assess whether the liver background texture was distinct from the uniform background.
Analyzing the FBP and IR images independently, four texture features—contrast, correlation, energy, and homogeneity—were extracted from four grey-level co-occurrence matrices (GLCMs) (Haralick et al 1973). In addition to these 16 texture features (4 texture features ´ 4 GLCMs), three intensity features—average and standard deviation of grey level and entropy—from the original images were also extracted. These 19 features underwent feature selection, a process to reduce the feature space, and classification to assign the images as liver or uniform background via the least absolute shrinkage and selection operator (Lasso) method (Tibshirani 1996). In Lasso, the weighting parameter λ determines the number of features allowed within the model; as λ increases, the number of features in the model decreases. The 19 features and 360 cases were within the rule of thumb that the number of features should be limited to 1 feature per ten cases to prevent over-fitting (Jarvis 2011). Rather, feature selection was performed to identify which of the 19 features were the best predictors of the background. Lasso was performed using 10-folds cross validation to minimize performance estimate bias. By training the model on 90% of the images, and testing the fitted model on the remaining 10%, a more accurate estimate of performance can be achieved. A total of 100 models were fit to classify the data, with λ, the criteria for feature inclusion, becoming increasingly more stringent.
Human observer studies
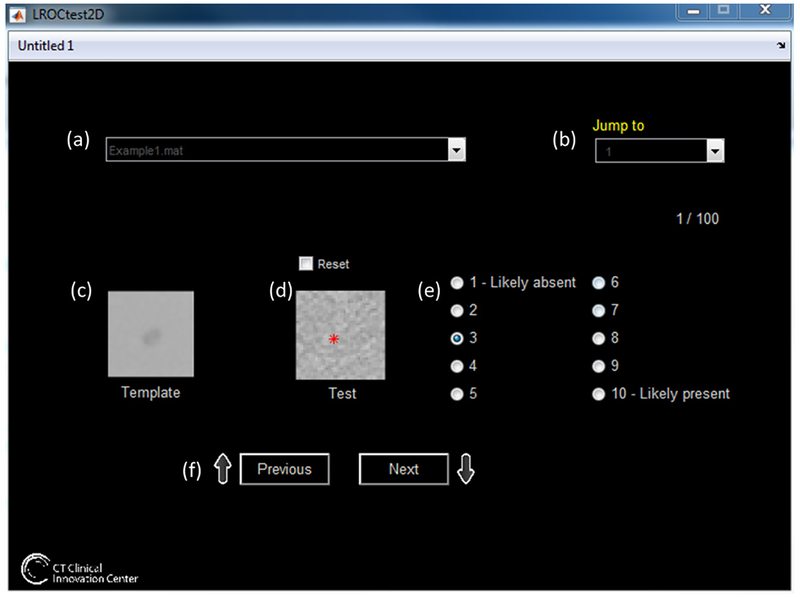
Three board-certified medical physicists (LY, CF, and SL) specializing in CT imaging independently reviewed all 36 image sets using a customized program in MATLAB (MATLAB Release 2015b, The MathWorks, Inc., Natick, Massachusetts, United States) with a graphical user interface (GUI) illustrated in figure 2, which displayed one image at a time to the reader in a random order. All images were displayed with a fixed window level/width of 40/400, the standard setting for abdomen CT at our institute, on a monitor that was appropriately calibrated for clinical diagnosis following the ACR Technical Standard for Electronic Practice (Norweck et al 2013). All studies were performed in a darkened room with consistent ambient lighting (<10 lux). Viewing sessions were limited to two hours to prevent reader fatigue, and readers were encouraged to sit directly in front of the workstation and maintain a fixed viewing distance of approximately 50−60 cm from the monitor.
Figure 2.
GUI for this reader study. (a) The user selected which set of data to analyze, with the option to (b) select which image to analyze. (c) The template (the lesion inserted into noise-free background) is displayed, and the current image (d) is shown to the user. The user selects the location (red asterisk in (d)), and ranks the confidence of the lesion’s presence in the image (e). In addition to choosing the image in (b), the user can scroll through the images using the previous and next buttons in (f). Upon conclusion of the image set, the user’s results are saved as a.mat file.
Readers were instructed to select the most likely location of the center of the lesion (asterisk in figure 2(d)) and provide a confidence score of how likely their selection was a true lesion (figure 2(e)). The confidence score ranged from 1: confident the image shown was a signal-absent image, to 10: confident the location selected is the true location of the signal in a signal-present image. At the end of each dataset review, the readers’ marked location coordinates and confidence scores for each 100-image set were automatically saved by the program. At the conclusion of the study, each reader had reviewed 3600 images: three dose levels, three lesion sizes, two backgrounds, and 2 reconstruction algorithms, each containing 100 images.
Evaluation of performance
The locations and confidence scores were assessed using localization receiver operating characteristic (LROC) analysis to examine the effects of reconstruction method, dose level, background, and lesion size on lesion detection and localization. Multi-reader, multi-case (MRMC) analysis was performed and nonparametric area under the LROC curve was estimated as described by Wunderlich and Noo (Wunderlich and Noo 2012). In LROC analysis, the true positive localized fraction (TPLF) is plotted against the false positive fraction (FPF). Unlike typical ROC curves, the conclusion of the LROC curve at (1.0, 1.0) is not a requirement as the number of correctly localized lesions may be less than the total number of lesion-present images at the lowest threshold, allowing the TPLF to have a maximum score of less than 1.0. A reader’s localization was deemed to be a true positive if it fell within the distance of the object radius from the true lesion location located at the lesion’s centroid; for example, the 9 mm lesion had a valid localization window within a 4.5 mm radius from the center of the lesion such that a reader’s localization within the boundary of the lesion would be a true positive localization.
LROC performance comparisons across backgrounds and reconstruction algorithms were assessed through Spearman’s rank correlation coefficient and root mean square error (RMSE, equation (1), where Y1 and Y2 are the LROC performances of (a) liver and uniform backgrounds, or (b) FBP and IR algorithms) and compared with respect to lesion size and dose level. Bootstrapping with 100 samples was performed to compute estimates of the confidence interval (CI) for these performance measures.
| (1) |
Results
Background characterization
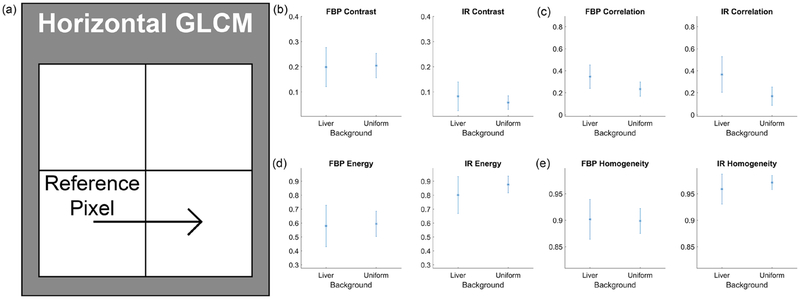
Sixteen GLCM features and three grey-level features were extracted from the full dose lesion-absent images in both backgrounds. The summary statistics of these features for the horizontal GLCM can be seen in figure 3, and the intensity features are shown in figure 4. As expected, the mean grey-level intensity was 110 HU for both liver and uniform background, regardless of reconstruction algorithm (see figure 4(a)). However, other features, such as contrast, energy, and homogeneity (figures 3(b), (d) and (e)) had differing characteristics depending on the reconstruction algorithm. Finally, the value of the texture correlation features differed between liver and uniform backgrounds for both FBP and IR (texture correlation feature of horizontal GLCM shown in figure 3(c)).
Figure 3.
Background texture characteristics of horizontal gray-level co-occurrence matrices (GLCM) from the full dose signal-absent images. (a) illustrates the definition of the horizontal GLCM, noting the relationship being quantified relative to a reference pixel. For the horizontal GLCM, the matrix is formed by comparing the intensities between each pixel in the image and its horizontal neighbor. The features extracted from the liver and uniform signal-absent images include (b) contrast, (c) correlation, (d) energy, and (e) homogeneity.
Figure 4.
Intensity features from the full dose signal-absent images. (a) shows the mean intensity between liver and uniform backgrounds for FBP and IR images. Similarly, (b) and (c) show the standard deviation and entropy from the signal-absent images.
These trends are illustrated in the Lasso feature selection process as well. In both FBP and IR trials, the texture correlation features from the GLCMs were the most robust and were selected for use in the fitted models until the most stringent criteria (λ = maximum value) was applied. Homogeneity, on the other hand, was a stronger feature in the IR classification than it was in FBP.
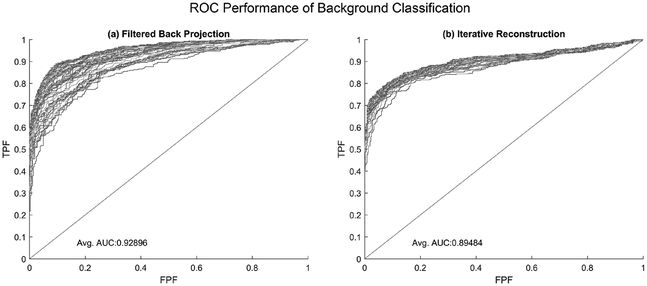
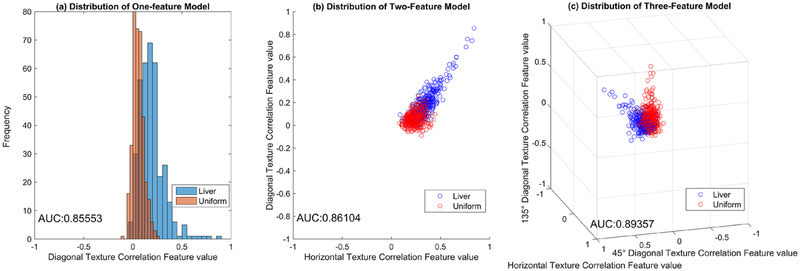
Performance of the background classification demonstrated the ability of these texture features to differentiate a uniform background from the anatomical liver background. For FBP, the average area under the ROC curve (AUC) was 0.929, and for IR, the average AUC was 0.894. The mean square error (MSE) of the fitted models ranged from 0.25 when using a single feature for classification (correlation in the diagonal (FBP) or horizontal (IR) direction) to 0.12 when all features were included in the model. Demonstration of background classification performances, stratified by reconstruction type, can be seen in figure 5. While figure 4 shows small differences in average feature performance between the two backgrounds, the combined small differences in feature space work to separate the two classes of data—liver and uniform backgrounds—to improve classification performance. This is illustrated in figure 6; while there is overlap between the two classes when assessing a single feature (figure 6(a)), greater separation and improved AUC are seen with the incorporation of additional features (figures 6(b) and (c)).
Figure 5.
Classification performances in separating images containing liver background from uniform background with 10-fold cross-validation. Each ROC line represents a different fitted model as fewer features are allowed for use in the prediction. Average performance of (a) FBP was 0.93 and for (b) IR was 0.89, illustrating the texture- and image-based features are capable of differentiating between the two backgrounds, regardless of reconstruction algorithm.
Figure 6.
Feature space plots with classification performance (AUC) for three background classification models (a) when one feature, (b) two features, and (c) three features are used in the model. Note that separation between classes (liver and uniform backgrounds) improves as more features are incorporated.
Human reader performances and trends
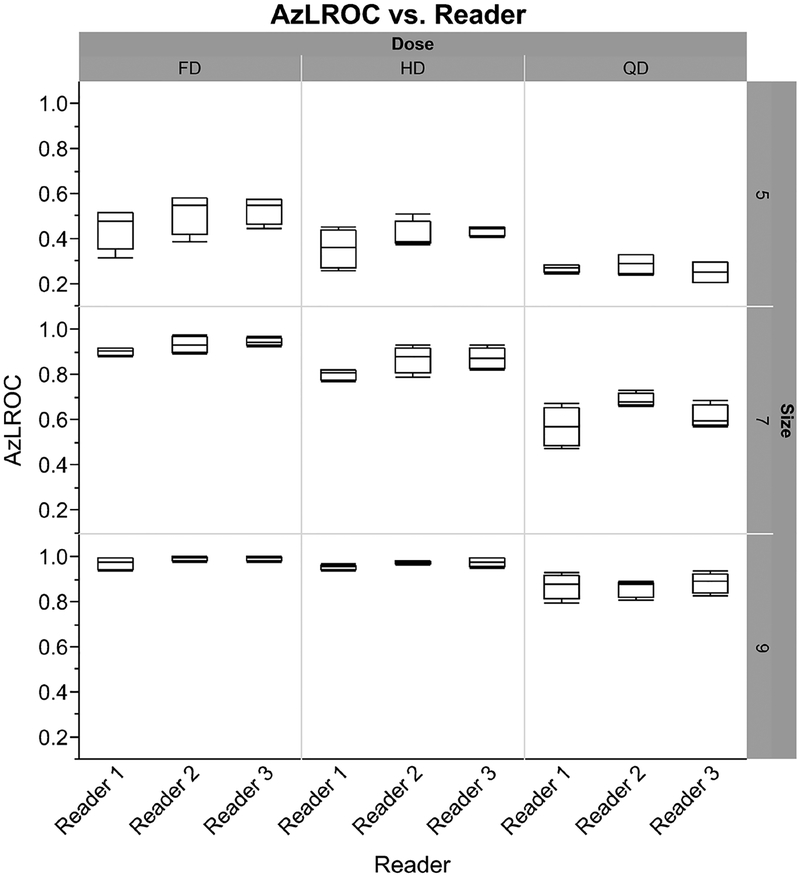
The LROC performance values stratified by reader across dose and size are shown in an outlier boxplot in figure 7. No outliers are present, and there is overlap between readers in their performances. While Reader 1 had slightly reduced average performance compared to Readers 2 and 3, the values fall within one standard deviation and are not significant when compared by one-way ANOVA (p = 0.73). The average performance values for both backgrounds and reconstruction algorithms, when stratified across both lesion size and dose level, can be seen in table 2. The average reader performance was 0.39 ± 0.11 for the 5 mm lesions, 0.80 ± 0.14 for the 7 mm lesions, and 0.94 ± 0.06 for the 9 mm lesions.
Figure 7.
Outlier box plots demonstrating localization performance (AzLROC) by reader, stratified by dose (x-axis) and lesion size (y -axis). Each box plot represents the average of four readings (FBP and IR in two backgrounds). All three readers have a similar mean performance for each stratification, and no outliers are present.
Table 2.
Average LROC performance ± standard deviation across all three readers when stratified by dose and lesion size for both reconstruction algorithms and backgrounds. Performance increases as the lesion size increases and the dose increases. Overall average for dose level and size are also shown.
| 5 mm | 7 mm | 9 mm | Average | |
|---|---|---|---|---|
| Full dose | 0.50 ± 0.08 | 0.93 ± 0.03 | 0.99 ± 0.02 | 0.80 ± 0.23 |
| Half dose | 0.40 ± 0.07 | 0.85 ± 0.05 | 0.97 ± 0.02 | 0.74 ± 0.25 |
| Quarter dose | 0.27 ± 0.04 | 0.63 ± 0.07 | 0.87 ± 0.04 | 0.59 ± 0.26 |
| Average | 0.39 ± 0.11 | 0.80 ± 0.14 | 0.94 ± 0.06 | 0.71 ± 0.26 |
Background influence on human reader performances
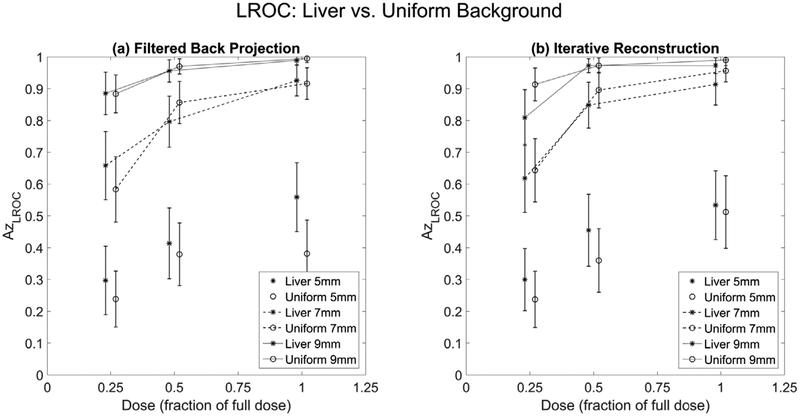
Figure 8 illustrates the average LROC performance values when the background type differed, with the average performance values across the three readers shown in tables 3 and 4. Spearman correlation coefficients (ρ) computed to compare the performance values in liver versus those in a uniform background found a correlation of ρ = 0.97 (95% CI: 0.96, 0.99). The RMSE (equation (1)), for the liver versus uniform background was 0.064 (95% CI: 0.045, 0.10). Overall, performance trends were visually similar, with the average difference between liver and uniform background being 0.05 ± 0.04. At smaller lesion sizes, the liver background had better performance, but when larger lesions were involved, the uniform background had better performance. The linear relationship was:
| (2) |
(95% CI for slope: 0.75, 0.92, 95% CI for intercept: 0.066, 0.19). The largest difference in performance between liver and uniform background occurred for the full dose, 5 mm lesions with a difference of 0.18.
Figure 8.
Liver versus Uniform background: average localization performances between liver (stars) and uniform water background (connected circles) for FBP (a) and IR (b) algorithms. Error bars represent 95% confidence intervals.
Table 3.
Average localization performances across readers for FBP, stratified by lesion size, dose level, and background (liver: L, uniform water: W).
| FBP | ||||||
|---|---|---|---|---|---|---|
| 5 mm | 7 mm | 9 mm | ||||
| Dose | L | W | L | W | L | W |
| Full | 0.56 | 0.38 | 0.93 | 0.92 | 0.99 | 0.99 |
| Half | 0.41 | 0.38 | 0.80 | 0.86 | 0.96 | 0.97 |
| Quarter | 0.30 | 0.24 | 0.66 | 0.58 | 0.89 | 0.88 |
Table 4.
Average localization performances across readers for IR, stratified by lesion size, dose level, and background (liver: L, uniform water: W).
| IR | ||||||
|---|---|---|---|---|---|---|
| 5 mm | 7 mm | 9 mm | ||||
| Dose | L | W | L | W | L | W |
| Full | 0.53 | 0.51 | 0.91 | 0.96 | 0.97 | 0.99 |
| Half | 0.45 | 0.36 | 0.85 | 0.90 | 0.97 | 0.97 |
| Quarter | 0.30 | 0.24 | 0.62 | 0.64 | 0.81 | 0.91 |
Secondary trends
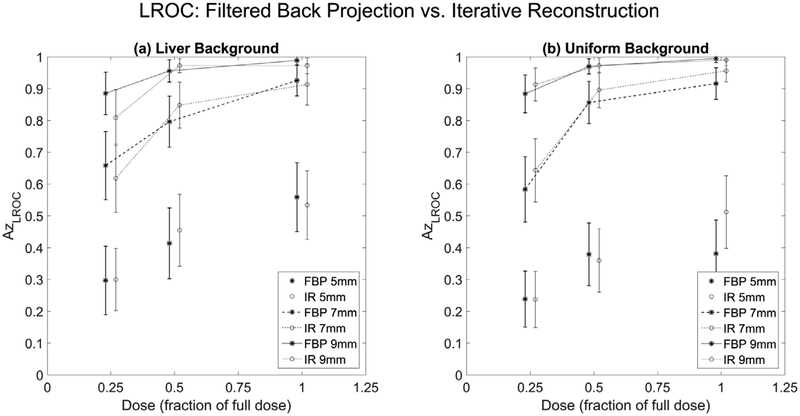
Analysis was also performed to determine whether the reconstruction algorithm influenced reader performances (figure 9). The average difference between FBP and IR was 0.03 ± 0.03, and the largest difference occurred for the full dose 5 mm lesions (difference of 0.18 between liver and water, and 0.13 between FBP and IR). The IR algorithm tended to have slightly higher performance values, though there was a one-to-one agreement between FBP and IR performance values. The linear relationship was
| (3) |
(95% CI for slope: 0.87, 1.05, 95% CI for intercept: −0.029, 0.10). The Spearman correlation coefficient between reconstruction algorithms was ρ = 0.96 (95% CI: 0.90, 1.0) and the RMSE = 0.046 (95% CI: 0.031, 0.080).
Figure 9.
Average localization performances between FBP (stars) and IR (connected circles) for (a) liver and (b) uniform background. Error bars represent 95% confidence intervals.
Discussion
The purpose of this study was to determine the correlation of human observer performance for localization of small low contrast lesions within uniform water background and anatomical liver background. Multiple papers have reported the importance of task-driven detectability, especially when IR methods, which challenge traditional image quality metrics such as contrast-to-noise ratio and image noise, are used (Racine et al 2016, Solomon et al 2017).
For this study, the backgrounds selected were water with a DC component added to mimic the density of average contrast-enhanced liver parenchyma background (110 HU) and anatomical liver parenchyma regions chosen to be free of major vessels. We found the human observers’ average performance values for a specific lesion size, dose level, and reconstruction type were highly correlated between anatomical and uniform backgrounds for the task of localizing low contrast liver lesions. While several studies have been designed with anatomical and uniform backgrounds (Baker et al 2012, De Crop et al 2015, Solomon et al 2017), these studies have focused on characterizing the noise properties of the images as background or reconstruction algorithm varied, rather than exploring the direct effect of differing backgrounds on the task (lesion localization). For example, De Crop et al compared a cadaver lung background to a standardized lung phantom background (CATPhan) and found good correlation between image quality parameters (noise, contrast-to-noise ratio, contrast detail) to visual graphical analysis (VGA) scores. To our knowledge, however, our study is the first to directly compare human observer lesion localization performance between clinical (liver parenchyma) and phantom (uniform water) backgrounds.
Of secondary interest was exploring the relationship between reconstruction algorithms and lesion detectability. Our comparison yielded high correlations in lesion detectability between FBP and IR images (ρ = 0.96). While IR algorithms have been shown to decrease the noise associated with the use of reduced doses, they have also been shown to decrease the conspicuity of subtle lesions, such as those associated with metastatic liver disease (Baker et al 2012, Solomon et al 2017). While a few of the configurations in this work had larger performance differences between reconstruction algorithms (i.e. 5 mm lesion at full dose), the average differences were small (0.03 ± 0.03) and the AzLROC scores between FBP and IR were highly correlated. The differences present due to lesion size and dose level were much larger than the differences seen between reconstruction algorithms.
We also examined the trends in lesion detectability as dose and lesion size changed. As expected, lesion detectability increased as lesion size increased and as dose increased. A larger difference in performance was seen between 5 mm and 7 mm lesions than between 7 mm and 9 mm lesions. This trend was also seen with the different dose levels; a larger performance difference was seen between quarter and half doses than between half and full doses. Several studies have sought to determine how much CT dose can be reduced while maintaining detectability. While results in previous studies have varied from 16% to as much 75% (Baker et al 2012, Kalra et al 2012, Xu et al 2015), Goenka et al and Fletcher et al demonstrated a 25% reduction is possible (Goenka et al 2014, Fletcher et al 2015). In our study, the number of dose levels (3: full, half, and quarter) do not allow us to thoroughly explore what amount of dose reduction is possible while maintaining localization performances; our data showed that half dose IR resulted in worse performance compared to full dose FBP. Additionally, performance drop-off is smaller between full and half dose images than between half and quarter dose images. In future work, exploring additional dose levels between half and full dose would allow for quantification of dose reduction between IR and FBP, as well as for better characterization of the dose-performance curves between half and full doses. However, this study sought to correlate readers’ localization performances in various backgrounds and reconstruction algorithms while keeping other parameters, such as dose and lesion size, constant.
The ROIs containing liver parenchyma free of major vessels is a limitation of the study. One of our concerns was that, by removing anatomical landmarks such as blood vessels, we would overly simplify the liver background, making it indistinguishable from the uniform water background. Classification of the background images demonstrated textural differences in CT number continue to exist between the liver and uniform background images; however, human reader performance showed high correlation and agreement in AzLROC across backgrounds. This, coupled with the visual similarity present in figure 1, suggests the textural differences present in anatomical liver parenchyma have negligible effect on lesion localization. As the task at hand is hypodense lesion localization, we believe the exclusion of the major vessels, which are hyperdense relative to the liver parenchyma, had minimal effect on the localization performances seen. Human readers can mentally construct a map of the major vessels and tend to ignore them when searching for lesions. Future studies to explore whether inclusion of major vessels influences reader detection and localization performance are underway.
An additional limitation is the use of medical physicists as readers instead of clinically trained radiologists. However, as Solomon et al also highlights, by cropping and presenting small ROI images, the task is simplified to a detection task as opposed to a clinical scenario of integrating patient information with the full imaging data (Solomon et al 2017). Medical physicists frequently perform low-contrast detection tasks during routine imaging protocol testing; the task presented here is similar to scenarios encountered by medical physicists. Thus, we do not believe this to be a significant limitation of the study. Finally, the window level and window width were limited to 40/400, the standard setting for abdominal CT imaging in many institutes. Although the window level and width settings may have some impact on lesion detectability and reader performance, exploring this impact is beyond the scope of this study.
Conclusion
The strong correlation demonstrated here between liver parenchyma and uniform backgrounds (ρ = 0.97) suggest that future human observer studies for liver lesion detection can be greatly simplified. Additionally, we found high correlation between the two reconstruction algorithms (ρ = 0.96). Using a uniform background and one reconstruction algorithm in future studies would allow a greater variability in lesion size and contrast, and a greater number of dose levels to further characterize the dose relationship, especially between half and full doses, on lesion detectability and localization. For the task of localizing low contrast liver lesions, human observer performance was highly correlated between anatomical and uniform backgrounds. This suggests that lesion localization studies emulating a clinical test of detecting liver lesions within a liver background can be performed using a uniform background.
Acknowledgments
Research reported in this article was supported by the National Institutes of Health under award numbers R01EB17095 and U01EB17185. The content is solely the responsibility of the authors and does not necessarily represent the official views of the National Institute of Health.
Abbreviations
- CT
Computed tomography
- FBP
Filtered back projection
- IR
Iterative reconstruction
- LROC
Localization receiver operating characteristic
- AzLROC
Area under the LROC curve
- ρ
Spearman correlation coefficient
- CTDIvol
Volume CT dose index
- mGy
milliGrays
- DICOM
Digital imaging and communications in medicine
- ROI
Region of interest
- GLCM
Grey-level co-occurrence matrix
- Lasso
Least absolute shrinkage and selection operator
- λ
Lasso weighting parameter
- GUI
Graphical user interface
- MRMC
Multi-reader, multi-case
- TPLF
True positive localization fraction
- FPF
False positive fraction
- ROC
Receiver operating characteristic
- MSE
Mean square error
- RMSE
Root mean square error
- CI
Confidence interval
Footnotes
Selected sections presented during oral presentation at 2017 RSNA Annual Meeting.
References
- AAPM CT Dose Summit 2010. Scan Parameter Optimization www.aapm.org/meetings/2010CTS/default.asp (Accessed: 2017)
- Baker ME, Dong F, Primak A, Obuchowski NA, Einstein D, Gandhi N, Herts BR, Purysko A, Remer E and Vachhani N 2012. Contrast-to-noise ratio and low-contrast object resolution on full- and low-dose MDCT: SAFIRE versus filtered back projection in a low-contrast object phantom and in the liver AJR Am. J. Roentgenol 1998–18 [DOI] [PubMed] [Google Scholar]
- Brenner DJ and Hall EJ 2007. Computed tomography—an increasing source of radiation exposure New Engl. J. Med 357 2277–84 [DOI] [PubMed] [Google Scholar]
- Chen B, Leng S, Yu L, Yu Z, Ma C and Mccollough C 2015. Lesion insertion in the projection domain: methods and initial results Med. Phys 42 7034–42 [DOI] [PMC free article] [PubMed] [Google Scholar]
- Chen B, Ma C, Leng S, Fidler JL, Sheedy SP, Mccollough CH, Fletcher JG and Yu L 2016. Validation of a projection-domain insertion of liver lesions into CT images Acad. Radiol 23 1221–9 [DOI] [PMC free article] [PubMed] [Google Scholar]
- De Crop A. et al. Correlation of clinical and physical-technical image quality in chest CT: a human cadaver study applied on iterative reconstruction. BMC Med. Imaging. 2015;15:32. doi: 10.1186/s12880-015-0075-y. [DOI] [PMC free article] [PubMed] [Google Scholar]
- Fletcher JG et al. 2015. Observer performance in the detection and classification of malignant hepatic nodules and masses with CT image-space denoising and iterative reconstruction Radiology 276 465–78 [DOI] [PMC free article] [PubMed] [Google Scholar]
- Goenka AH, Herts BR, Obuchowski NA, Primak AN, Dong F, Karim W and Baker ME 2014. Effect of reduced radiation exposure and iterative reconstruction on detection of low-contrast low-attenuation lesions in an anthropomorphic liver phantom: an 18-reader study Radiology 272 154–63 [DOI] [PubMed] [Google Scholar]
- Haralick R, Shanmugan K and Dinstein I 1973. Textural features for image classification IEEE Trans. Syst. Man Cybern 3 610–21 [Google Scholar]
- Hendee WR, Becker GJ, Borgstede JP, Bosma J, Casarella WJ, Erickson BA, Maynard CD, Thrall JH and Wallner PE 2010. Addressing overutilization in medical imaging Radiology 257 240–5 [DOI] [PubMed] [Google Scholar]
- IMV 2016. 2016 CT Market Outlook Report (Des Plains, IL: IMV Medical Information Division; ) www.imvinfo.com/index.aspx?sec=ct&sub=dis&itemid=200081 (Accessed: 2017) [Google Scholar]
- Jarvis S 2011. Data mining with learner corpora A Taste for Corpora: In Honour of Sylviane Granger vol 45 (Amsterdam: John Benjamins Publishing Company; ) pp 127–51 [Google Scholar]
- Kalra MK et al. 2012. Radiation dose reduction with sinogram affirmed iterative reconstruction technique for abdominal computed tomography J. Comput. Assist. Tomogr 36 339–46 [DOI] [PubMed] [Google Scholar]
- Leng S, Yu L, Zhang Y, Carter R, Toledano AY and Mccollough CH 2013. Correlation between model observer and human observer performance in CT imaging when lesion location is uncertain Med. Phys 40 081908. [DOI] [PMC free article] [PubMed] [Google Scholar]
- Mccollough CH et al. 2017. Low-dose CT for the detection and classification of metastatic liver lesions: results of the 2016 low dose CT grand challenge Med. Phys 44 e339–52 [DOI] [PMC free article] [PubMed] [Google Scholar]
- Mettler FA Jr, Thomadsen BR, Bhargavan M, Gilley DB, Gray JE, Lipoti JA, Mccrohan J, Yoshizumi TT and Mahesh M 2008. Medical radiation exposure in the US in 2006: preliminary results Health Phys 95 502–7 [DOI] [PubMed] [Google Scholar]
- Norweck JT, Seibert JA, Andriole KP, Clunie DA, Curran BH, Flynn MJ, Krupinski E, Lieto RP, Peck DJ, Mian TA and Wyatt M 2013. ACR–AAPM–SIIM Technical standard for electronic practice of medical imaging J. Digit. Imaging 26 38–52 [DOI] [PMC free article] [PubMed] [Google Scholar]
- Racine D, Ba AH, Ott JG, Bochud FO and Verdun FR 2016. Objective assessment of low contrast detectability in computed tomography with channelized hotelling observer Phys. Med 32 76–83 [DOI] [PubMed] [Google Scholar]
- Seltzer SE, Swensson RG, Nawfel RD, Lentini JF, Kazda I and Judy PF 1991. Visualization and detection-localization on computed tomographic images Invest. Radiol 26 285–94 [DOI] [PubMed] [Google Scholar]
- Solomon J, Marin D, Roy Choudhury K, Patel B and Samei E 2017. Effect of radiation dose reduction and reconstruction algorithm on image noise, contrast, resolution, and detectability of subtle hypoattenuating liver lesions at multidetector CT: filtered back projection versus a commercial model-based iterative reconstruction algorithm Radiology 284 777–87 [DOI] [PMC free article] [PubMed] [Google Scholar]
- Solomon J and Samei E 2014. A generic framework to simulate realistic lung, liver and renal pathologies in CT imaging Phys. Med. Biol 59 6637–57 [DOI] [PubMed] [Google Scholar]
- Tibshirani R 1996. Regression shrinkage and selection via the Lasso J. R. Stat. Soc B 58 267–88 [Google Scholar]
- Wunderlich A and Noo F 2012. A nonparametric procedure for comparing the areas under correlated LROC curves IEEE Trans. Med. Imaging 31 2050–61 [DOI] [PMC free article] [PubMed] [Google Scholar]
- Xu J, Fuld MK, Fung GS and Tsui BM 2015. Task-based image quality evaluation of iterative reconstruction methods for low dose CT using computer simulations Phys. Med. Biol 60 2881–901 [DOI] [PubMed] [Google Scholar]
- Yu L, Leng S, Chen L, Kofler JM, Carter RE and Mccollough CH 2013. Prediction of human observer performance in a 2-alternative forced choice low-contrast detection task using channelized Hotelling observer: impact of radiation dose and reconstruction algorithms Med. Phys 40 041908. [DOI] [PMC free article] [PubMed] [Google Scholar]
- Yu L, Shiung M, Jondal D and Mccollough CH 2012. Development and validation of a practical lower-dose-simulation tool for optimizing computed tomography scan protocols J. Comput. Assist. Tomogr 36 477–87 [DOI] [PubMed] [Google Scholar]


