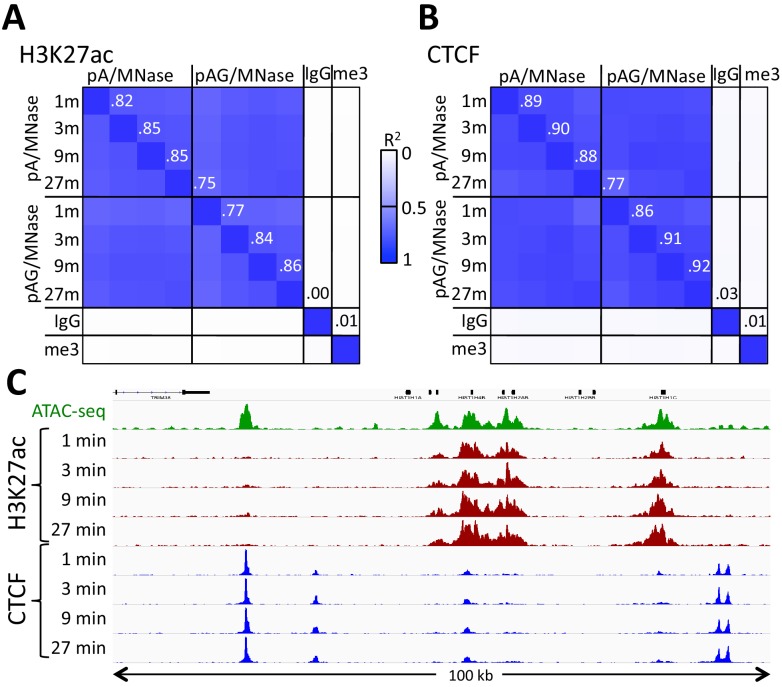
Figure 3. Similar performance using pA/MNase and pAG/MNase.
(A) CUT&RUN was performed with an antibody to H3K27ac (Millipore MABE647) and to CTCF (Millipore 07–729) with digestion over a 1 to 27 min range as indicated using pAG/MNase with the high-Ca++/low-salt protocol. Correlation matrix comparing peak overlaps for time points and fusion constructs. The datasets were pooled and MACS2 was used with default parameters to call peaks, excluding those in repeat-masked intervals and those where peaks overlapped with the top 1% of IgG occupancies, for a total of 52,425 peaks. Peak positions were scored for each dataset and correlations (R2 values shown along the diagonal and displayed with Java TreeView v.1.16r2, contrast = 1.25) were calculated between peak vectors. IgG and H3K27me3 (me3) negative controls were similarly scored. (B) Same as A, except the antibody was to CTCF. A set of 9403 sites with a CTCF motif within a hypersensitive site was used (Skene and Henikoff, 2017). High correlations between all time points demonstrate the uniformity of digestion over a 27-fold range. (C) Representative tracks from datasets used for panels A and B showing a 100 kb region that includes a histone locus cluster (chr6:25,972,600–26,072,600).

