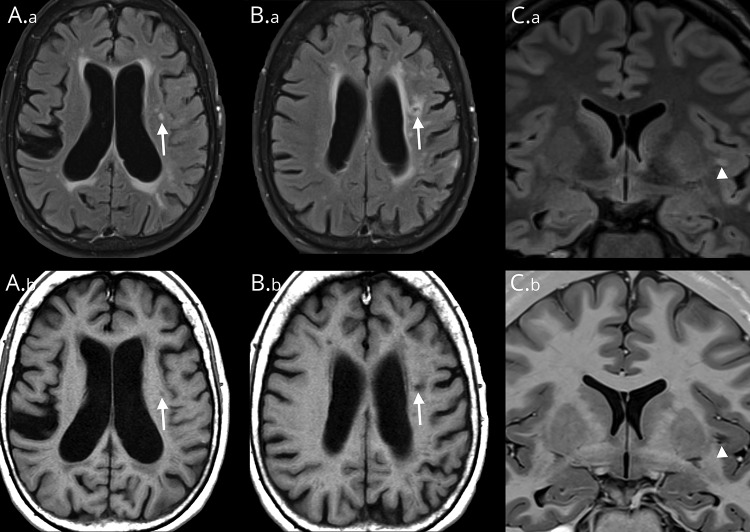
Figure 3. MRI findings of CNS small vessel disease.
Patient 1, images A.a, A.b, B.a, B.b. (A.a) Axial T2 FLAIR image shows a typical WMH (arrow) with increased FLAIR signal. (A.b) Corresponding intermediate-signal intensity (arrow) on T1-weighted MRI. (B.a) By contrast, an axial T2 FLAIR image taken slightly more superior in location shows a lacune with marginal increased FLAIR hyperintensity reflecting gliosis with central hypointensity (arrow) representing cavitation. (B.b) The corresponding axial T1-weighted image shows marginal intermediate signal (arrow) corresponding to areas of gliosis with central hypointensity indicating cavitation. Patient 2, images C.a and C.b. (C.a) Coronal T2 FLAIR image shows a left-sided FLAIR hyperintensity (arrowhead) that represents incomplete fluid suppression within a PVS, which is a common diagnostic pitfall and may be erroneously interpreted as a WMH. (C.b) Corresponding coronal T1-weighted image better illustrates the linear branching configuration (arrowhead) typical of a PVS. FLAIR = fluid-attenuated inversion recovery; PVS = perivascular space; WMH = white matter hyperintensity.

