Abstract
Objective
To determine the value of quantitative MRI in providing imaging biomarkers for disease in 20 different upper and lower leg muscles of patients with myotonic dystrophy type 1 (DM1).
Methods
We acquired images covering these muscles in 33 genetically and clinically well-characterized patients with DM1 and 10 unaffected controls. MRIs were recorded with a Dixon method to determine muscle fat fraction, muscle volume, and contractile muscle volume, and a multi-echo spin-echo sequence was used to determine T2 water relaxation time (T2water), reflecting putative edema.
Results
Muscles in patients with DM1 had higher fat fractions than muscles of controls (15.6 ± 11.1% vs 3.7 ± 1.5%). In addition, patients had smaller muscle volumes (902 ± 232 vs 1,097 ± 251 cm3), smaller contractile muscle volumes (779 ± 247 vs 1,054 ± 246 cm3), and increased T2water (33.4 ± 1.0 vs 31.9 ± 0.6 milliseconds), indicating atrophy and edema, respectively. Lower leg muscles were affected most frequently, especially the gastrocnemius medialis and soleus. Distribution of fat content per muscle indicated gradual fat infiltration in DM1. Between-patient variation in fat fraction was explained by age (≈45%), and another ≈14% was explained by estimated progenitor CTG repeat length (r2 = 0.485) and somatic instability (r2 = 0.590). Fat fraction correlated with the 6-minute walk test (r = −0.553) and muscular impairment rating scale (r = 0.537) and revealed subclinical muscle involvement.
Conclusion
This cross-sectional quantitative MRI study of 20 different lower extremity muscles in patients with DM1 revealed abnormal values for muscle fat fraction, volume, and T2water, which therefore may serve as objective biomarkers to assess disease state of skeletal muscles in these patients.
ClinicalTrials.gov identifier
Myotonic dystrophy type 1 (DM1) is a multisystem disease characterized by progressive muscle weakness, myotonia, and cognitive dysfunction.1,2 Its genetic cause is an expansion of a CTG trinucleotide repeat in the dystrophia myotonica protein kinase (DMPK) gene, whereby CTG repeat length correlates with disease severity.3,4
Although currently DM1 cannot be treated, promising therapeutic approaches are emerging.3,5 Objective assessment of these approaches in clinical trials requires quantitative biomarkers that can assess disease in individual muscles. Moreover, such biomarkers are important to follow the natural progression of DM1 and to understand its pathophysiologic mechanisms. Because MRI is a noninvasive, quantitative method that can provide relevant biomarkers such as muscle volume, fat fraction, and T2 relaxation time of water, it is well suited to study neuromuscular disorders.6–8 These biomarkers report the respective pathologic processes of muscle atrophy, fatty infiltration, and intracellular or extracellular edema, the last assumed to associate with disease activity.6 Previously, it has been shown that each muscle appears to be affected differently in DM1.9
The aim of our study is therefore to determine the value of quantitative muscle MRI to provide imaging biomarkers for fat infiltration, muscle mass, and T2 relaxation of putative edema in a broad set of upper and lower leg muscles in well-characterized patients with DM1. We first determined whether these imaging measures differ between patients and unaffected controls. Second, we examined whether DM1 exhibits a specific pattern and distribution of muscular fat infiltration. Third, we associated these MRI measures with age, CTG repeat length, and clinical outcomes.
Methods
Participants
In this cross-sectional study, we included participants with genetically confirmed DM1 and unaffected, apparently healthy controls comparable in age and sex. The patients with DM1 participated in the multicenter randomized controlled Observational Prolonged Trial in Myotonic Dystrophy Type 1 (OPTIMISTIC) trial.10 We invited patients from the study sites in the Netherlands (Radboud University Medical Center, Nijmegen) and France (Henri Mondor University Hospital, Paris). Participants who had a pacemaker, a prosthetic implant in the lower extremity, or claustrophobia or were unable to lie in the supine position for 60 minutes were excluded.
Standard protocol approvals, registrations, and patient consents
This study was conducted according to the principles of the Declaration of Helsinki (October 2013 version) and the Medical Research Involving Human Subjects Act. The local medical ethics committees approved this study, and prior written informed consent was obtained from all participants. This trial is registered with ClinicalTrials.gov (NCT02118779).
Clinical and genetic assessment of patients with DM1
The complete study design for the clinical and genetic assessment has been described.10 Physical capacity was evaluated by performing a 6-minute walk test (6MWT), and disease severity was assessed with the muscular impairment rating scale (MIRS).11 Moreover, activity and social participation were assessed with the DM1-Activ-c questionnaire,12 and fatigue was evaluated with the fatigue severity subscale of the Checklist Individual Strength.13 At the time of recruitment for OPTIMISTIC, blood DNA samples were taken and subjected to small-pool PCR and Southern blotting. Because only a small amount (300 pg) of DNA template was used, distinct bands of varying lengths derived from the CTG repeat expansion were observed. Somatic instability usually results in the repeats increasing in length over time, wherefore the lower edge of these bands on the blot was used to estimate the inherited, or progenitor, allele length (CTGePAL) and the densest region of bands was used to estimate the most frequent, or modal, repeat length at time of sampling (CTGmodal). Somatic instability was estimated by subtracting CTGmodal from CTGePAL. Furthermore, we tested for the presence of AciI-sensitive variant repeats in the expanded allele because they may result in milder symptoms and delayed disease onset.14–16 Individual-specific residual variation in somatic instability (CTGResSI) not accounted for by age at sampling, estimated progenitor allele length, or presence of variant repeats was calculated with data from the entire OPTIMISTIC cohort.
MRI acquisition
The upper and lower legs of patients and unaffected controls were examined with MRI, with random selection of the right or left leg. In patients, this MRI took place within 1 month of recruitment for the OPTIMISTIC trial. The MRI was performed on 3T MRI systems (Siemens, Tim TRIO, [Nijmegen] or Magnetom Verio [Paris], Erlangen, Germany) using a spine coil combined with phased arrays placed around the lower extremity. All images were in the transverse plane, positioned at the thickest part of the lower leg and middle of the femur in the upper leg, and oriented orthogonal to the tibia or femur bone, respectively (figure 1). First, we collected T1-weighted spin echo images (repetition time [TR] 670 milliseconds, echo time 10 milliseconds, field of view [FOV] 192 × 192 mm, voxel size 1 × 1 × 5 mm, number of slices 27, slice gap 0 mm). Thereafter, we acquired turbo inversion recovery magnitude (TIRM) images with a similar FOV, resolution, and slices (TR 4,000 milliseconds, echo time 41 milliseconds, inversion time 220 milliseconds). Furthermore, we collected data using 3D Dixon sequences (TR 10 milliseconds, flip angle 3°, FOV 256 × 192 mm, voxel size 1 × 1 × 5 mm, number slices 32) in either a 2-point version (TE1/TE2 = 2.45/3.675 milliseconds) or 3-point version (TE1/TE2/TE3 = 2.31/3.68/5.07 milliseconds). Finally, at the Nijmegen site, multi-echo spin-echo images were acquired (TR 3,720 milliseconds, echo train length 17, echo-spacing 8 milliseconds, voxel size 1.5 × 1.5 × 10 mm, number of slices 5, slice gap 20 mm).
Figure 1. Positioning of image slices, muscle delineation, and data processing pipeline.
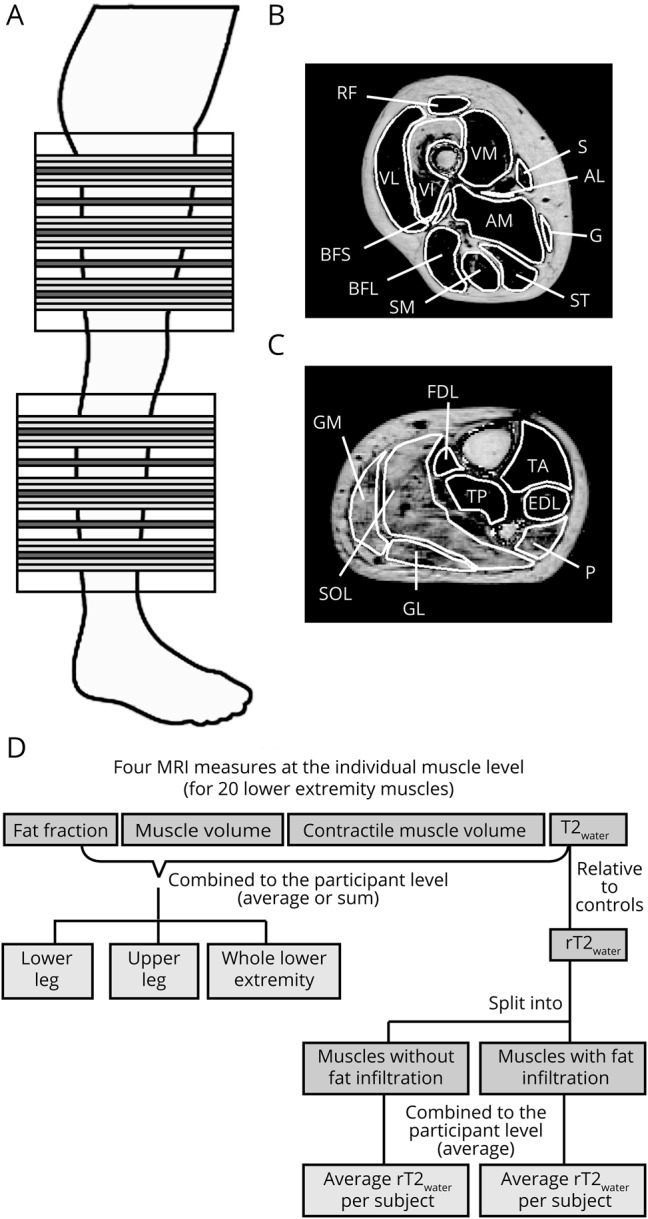
(A) Positioning of image slices at the lower and upper leg. Large blocks indicate the total area covered by MRI. Muscles were delineated on 17 slices of the Dixon images, depicted in light and dark gray using the out-phase images, water images, and fat fraction map. Dark gray slices correspond in slice position to the T2 water relaxation time (T2water) map. (B) Example of muscle delineation of the 12 quantitatively analyzed upper leg muscles on the fat fraction map. (C) Example of muscle delineation of the 8 quantitatively analyzed lower leg muscles on the fat fraction map. (D) Schematic overview of the data processing pipeline. AM/AL = adductor magnus/longus; BFS/BFL = biceps femoris short/long head; EDL = extensor digitorum longus; FDL = flexor digitorum longus; G = gracilis; GL/GM = gastrocnemius lateralis/medialis; P = peroneus; RF = rectus femoris; S = sartorius; SM = semimembranosus; SOL = soleus; ST = semitendinosus; TA/TP = tibialis anterior/posterior; VL/VI/VM = vastus lateralis/intermedius/medialis.
Data analysis
Semiquantitative MRI
An experienced radiologist (M.J.P.) scored 7 lower leg and 12 upper leg muscles (figure 1, B and C) semiquantitatively for signs of fat infiltration and putative edema on T1-weighted spin echo and TIRM images, respectively. For the T1-weighted images, the ordinal Lamminen score (range 1–4) was used, in which 1 represents normal muscle signal intensity and 4 reflects a total, homogeneous hyperintense signal change in the entire muscle.17 The TIRM images were scored with the ordinal Malattia score (range 0–2), with 0 meaning no muscle signal abnormalities and 2 indicating a high degree of signal hyperintensity.18 The Lamminen and Malattia individual muscle scores of each participant were summed over all lower extremity muscles for comparison between patients with DM1 and unaffected controls.
Quantitative MRI
Data analysis was performed with Matlab version 2014b (MathWorks, Natick, MA). A fat fraction map, with voxel values ranging from 0% to 100%, was calculated from the Dixon sequence data by voxel-wise dividing the signal intensity of the fat image by the summed signal intensity of the fat and water image:
 |
The T2 relaxation time of muscle water (T2water in milliseconds) was determined per voxel by fitting multi–spin echo data with a bicomponent extended-phase graph model (appendix available from Dryad, doi.org/10.5061/dryad.4nb96c1).19,20 Increased T2water is thought to reflect putative edema and disease activity.
For the quantitative evaluation, we analyzed the same 19 lower extremity muscles as evaluated semiquantitatively, plus the flexor digitorum longus, i.e., in total 8 calf and 12 thigh muscles. They were delineated on 5 distal, middle, and proximal slices of the Dixon images of the upper and lower leg using Medical Image Processing, Analysis, and Visualization (mipav.cit.nih.gov), thereby avoiding subcutaneous fat contamination (figure 1, A-C). Furthermore, delineation was performed on the 5 slices of the Dixon images corresponding in position to the T2water map and transposed to this T2water map (figure 1A). Average fat fraction, T2water, and estimated muscle volume were determined for each muscle (figure 1D). Average fat fraction was defined as the mean over all voxels, and muscle volume was defined as the number of voxels multiplied by the voxel volume using the 15 delineated slices of the fat fraction map. In addition, contractile muscle volume, i.e., the remaining muscle tissue still able to contract, was calculated as follows:
 |
To obtain T2water, the voxels with severe fat infiltration were excluded (data available from Dryad, doi.org/10.5061/dryad.4nb96c1) because sufficient water signal is required for reliable fitting of T2water.21 If the remaining number of voxels was >10% of the total number of voxels in that muscle, T2water was calculated as the average over these voxels in the 5 T2water map slices. Muscles were excluded from the analysis if visual inspection revealed the presence of movement artifacts. For the fat fraction and contractile muscle volume analysis, muscles were also excluded if artifacts in the fat/water reconstruction made the fat fraction estimate unreliable.
Outcomes for the 20 individual muscles were combined, resulting in per participant a value for the entire lower extremity and a value for the lower and upper leg level (figure 1D). For the fat fraction and T2water, muscles were combined by taking the average over all 20 muscles per participant and the average over the 8 lower leg and 12 upper leg muscles separately. For the muscle volume and contractile muscle volume, we took the sum of these muscles per participant. The outcome measures for the entire lower extremity were calculated only if upper and lower leg muscle data were available.
To investigate whether muscles with signs of fat infiltration differ in T2water with muscles without fat infiltration, muscles were divided into 2 groups based on their fat fraction. For all 20 muscles, a cutoff value was defined as the average fat fraction + 2 SDs of that muscle in unaffected controls (figure 1D). It was observed that, in unaffected controls, T2water differed between muscles; e.g., the average T2water was 27.6 milliseconds in the rectus femoris and 33.8 milliseconds in the gastrocnemius medialis (Friedman test, p < 0.001, figure e-4 available from Dryad, doi.org/10.5061/dryad.4nb96c1). Therefore, for each muscle, we determined the absolute difference in milliseconds relative to the average T2water over the 10 unaffected controls in that particular muscle (rT2water). Thereafter, we averaged per participant the rT2water of the individual non–fat-infiltrated muscles and rT2water of the fat infiltrated muscles to obtain for both a value for the lower extremity (figure 1D).
Statistical analysis
Statistical analysis was performed with IBM SPSS Statistics version 22 (SPSS, Chicago, IL) or R statistics using the RStudio package (R Foundation for Statistical Computing, Vienna, Austria).22,23 Differences between unaffected controls and patients with DM1 were assessed with a 2-tailed Mann-Whitney U test. A 2-tailed 1-sample t test to zero was applied to determine whether rT2water in DM1 differed from that in unaffected controls. The difference in rT2water between non–fat-infiltrated and fat-infiltrated muscles was evaluated with a 2-tailed Wilcoxon signed-rank test. Fat fraction and T2water were correlated with the Lamminen and Malattia scoring using the Spearman correlation, respectively. Multivariate linear regression was applied to predict fat fraction using age, CTGePAL, and CTGResSI. Fat fraction, age, and CTGePAL were log transformed to increase linearity and to improve normality. Model selection was based on the Akaike information criterion for each model using a backward stepwise selection procedure implemented with the step function in R.24 Whole lower extremity quantitative MRI measures were correlated with the MIRS and 6MWT. In addition, the 6MWT was correlated with quantitative MRI outcome measures of relevant muscle groups (knee extensors, knee flexors, ankle dorsiflexors, and ankle plantarflexors) using Bonferroni correction. Significance was set at p = 0.05. Data are presented as mean ± SD unless otherwise stated.
Data availability
We encourage researchers wishing to access the generated anonymized data to submit a request to the corresponding author. Requests for access will be reviewed by a panel, and a data access agreement needs to be signed.
Results
Participants
The age and fraction of men to women were not different between the 33 patients with DM1 (24 in Nijmegen, 9 in Paris) and 10 unaffected controls (table 1). The clinical forms by which the patients with DM1 were affected are presented in table 1. According to the clinical scores such as the MIRS, DM1-Activ-c, 6MWT, and Checklist Individual Strength-fatigue, patients varied from mildly to severely affected and exhibited a wide range of CTG repeat lengths (table 1). Semiquantitative evaluation of the MRI data included 615 muscles in patients with DM1 and 190 muscles in unaffected controls; quantitative evaluation included 633 muscles in patients with DM1 and 200 muscles in unaffected controls. Twelve upper leg muscles were not analyzed because 1 patient could not lie in the supine position long enough to acquire data with all MRI sequences. Further details on the number of muscles and participants analyzed per MRI outcome measure are presented in table 2.
Table 1.
Participant characteristics, patient clinical performance, and CTG repeat length
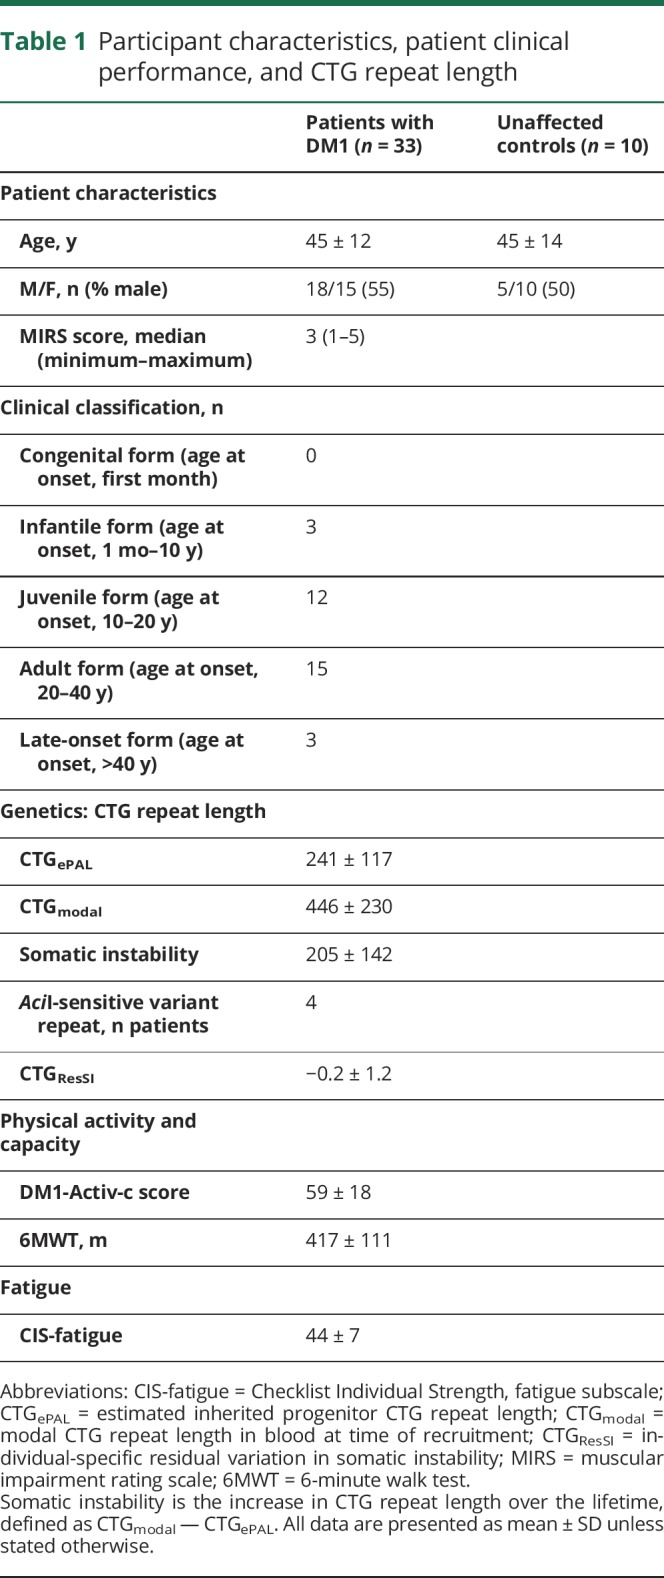
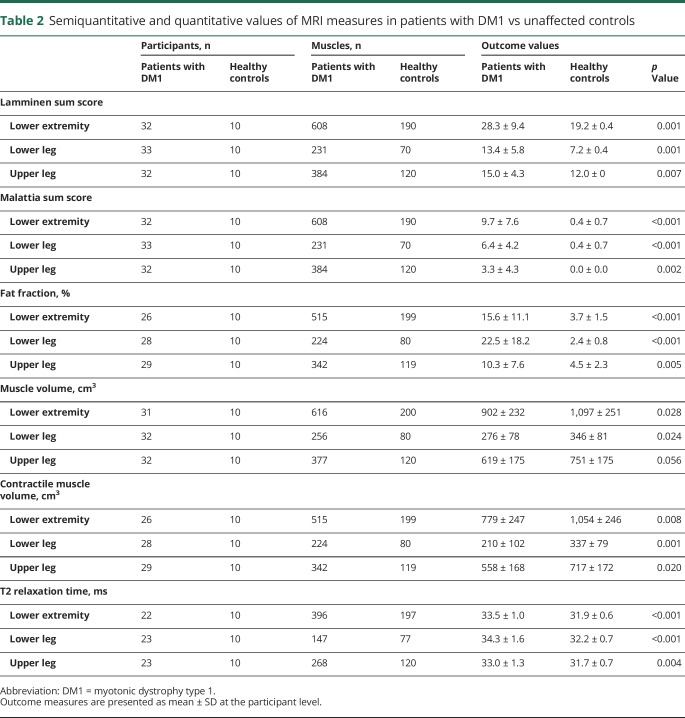
Table 2.
Semiquantitative and quantitative values of MRI measures in patients with DM1 vs unaffected controls
MRI outcome measures differ between patients with DM1 and unaffected controls
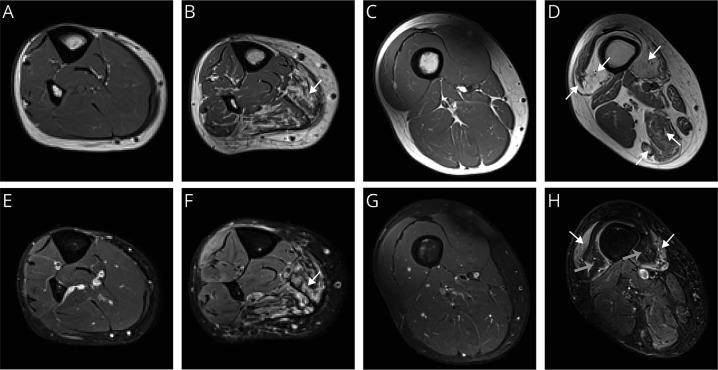
The T1-weighted MRIs of lower extremity muscles in patients with DM1 displayed hyperintense lesions indicative of fat infiltration (figure 2, A–D). The semiquantitative Lamminen score of these lesions was higher for muscles of patients with DM1 compared to unaffected controls (sum Lamminen mean ± SD score: DM1, 28.3 ± 9.4; controls, 19.2 ± 0.4; p = 0.001; table 2), with a more substantial relative increase in the lower leg muscles than in the upper leg muscles.
Figure 2. Typical example of T1-weighted and TIRM images of lower extremity muscles.
(A) T1-weighted image of the lower leg of an unaffected control. (B) T1-weighted image of the lower leg of a patient with myotonic dystrophy type 1 (DM1) showing fat infiltration in the soleus (white arrow). (C) T1-weighted image of the upper leg of an unaffected control. (D) T1-weighted image of the upper leg of a patient with DM1 showing fat infiltration in the vasti muscles and hamstring muscles (white arrows). (E) Turbo inversion recovery magnitude (TIRM) image of the lower leg of an unaffected control. (F) TIRM image of the lower leg of a patient with DM1 showing hyperintense lesions reflecting edema associated with disease activity in the soleus (white arrow). (G) TIRM image of the upper leg of an unaffected control. (H) TIRM image of the upper leg of a DM1 patient showing hyperintense lesions in the vastus lateralis and medialis (white arrow), while fat infiltration results in a hypointense signal in the vastus intermedius and medialis (grey arrow).
In TIRM images of patients with DM1, we observed hyperintense areas indicative for edema (figure 2, E–H). The semiquantitative Malattia score of these hyperintense lesions was higher compared to that of controls (sum Malattia score: DM1, 9.7 ± 7.6; controls, 0.4 ± 0.7, p < 0.001; table 2). Most TIRM-positive lesions were observed in the lower leg. In the 33 scored patients, the number of lower leg muscles with these lesions ranged from 20 tibialis posterior muscles (Malattia score >0) to 25 tibialis anterior and gastrocnemius medialis muscles. In the upper leg, the vastus lateralis and intermedius were most often TIRM positive (12 and 14 muscles, respectively), and only 4 of the scored gracilis, sartorius, and adductor longus muscles were TIRM positive. Of the 422 muscles that showed no fat infiltration (Lamminen score 1), 83 muscles (20%) showed hyperintense areas on the TIRM images (i.e., Malattia score 1 or 2). Detailed results on the individual Lamminen and Malattia scores are presented in table e-1 and figure e-1 (available from Dryad, doi.org/10.5061/dryad.4nb96c1).
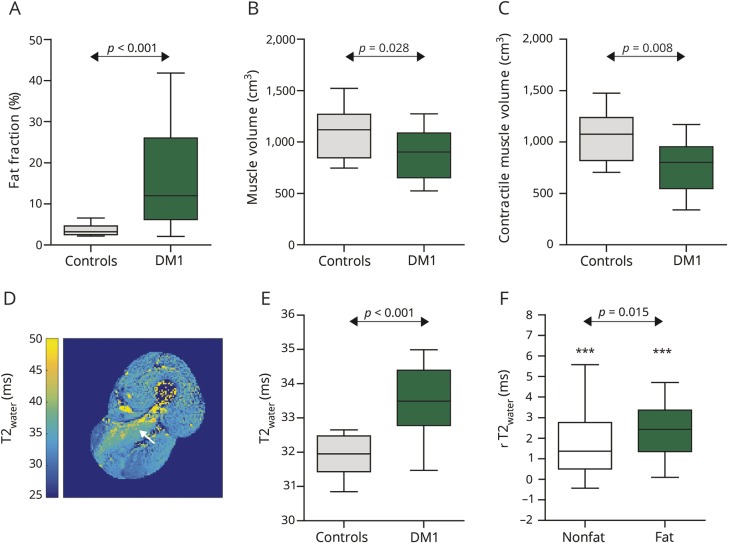
For the quantitative determination of muscle fat fraction, muscle volume, and contractile muscle volume, we analyzed the MRIs obtained with the Dixon method (figure 3 and table 2). These analyses revealed an increased fat fraction for patients with DM1 compared to unaffected controls: 15.6 ± 11.1% vs 3.7 ± 1.5%, respectively (p < 0.001; figure 3A). Analysis of these images also revealed that muscle volume was reduced in patients with DM1 (DM1: 902 ± 232 cm3; controls: 1,097 ± 251 cm3; p = 0.028), as well as contractile muscle volume (DM1: 779 ± 247 cm3; controls: 1,054 ± 246 cm3; p = 0.008) (figure 3, B and C).
Figure 3. Quantitative MRI measures in unaffected controls vs patients with DM1.
(A) Fat fraction. (B) Muscle volume. (C) Contractile muscle volume. (D) Example of a T2 water relaxation time (T2water) map of the upper leg of a patient with myotonic dystrophy type 1 (DM1) showing increased T2water in the adductor magnus (white arrow). (E) T2water. (F) Difference in T2water compared to unaffected controls (rT2water) in non–fat-infiltrated (non-fat) and fat-infiltrated muscles (fat) of patients with DM1. Data are presented as Tukey boxplots. *** p < 0.001.
To determine T2water values as a quantitative parameter for putative edema-associated disease activity, we analyzed MRIs of the lower extremity obtained with a multi-echo spin-echo sequence. The T2water maps derived from these images typically reveal increased T2water in some muscles of patients with DM1, e.g., in the adductor magnus (figure 3D). On average, T2water was elevated in muscles of patients with DM1 compared to unaffected controls: 33.5 ± 1.0 vs 31.9 ± 0.6 milliseconds respectively (p < 0.001; figure 3E and table 2). To account for differences in intrinsic T2water between muscles, we also evaluated rT2water to quantify edema-associated disease activity relative to the muscles of unaffected controls. rT2water was elevated in non–fat-infiltrated muscles (+1.4 ± 1.5 milliseconds, p < 0.001) and fat-infiltrated muscles (+2.4 ± 1.3 milliseconds, p < 0.001) and elevated in fat-infiltrated vs non–fat-infiltrated muscles (p = 0.015; figure 3F). Although these rT2water findings are highly significant at the group level, some muscles of patients with DM1 also showed normal T2water.
The quantitative values for fat fraction and T2water in DM1 muscles correlate well with the corresponding semiquantitative scores (Lamminen score vs fat fraction: ρ = 0.631, p < 0.001; Malattia score vs T2water: ρ = 0.400, p < 0.001). Average values for quantitative MRI measures per individual muscle are presented in figures e-2 through e-5 (available from Dryad, doi.org/10.5061/dryad.4nb96c1).
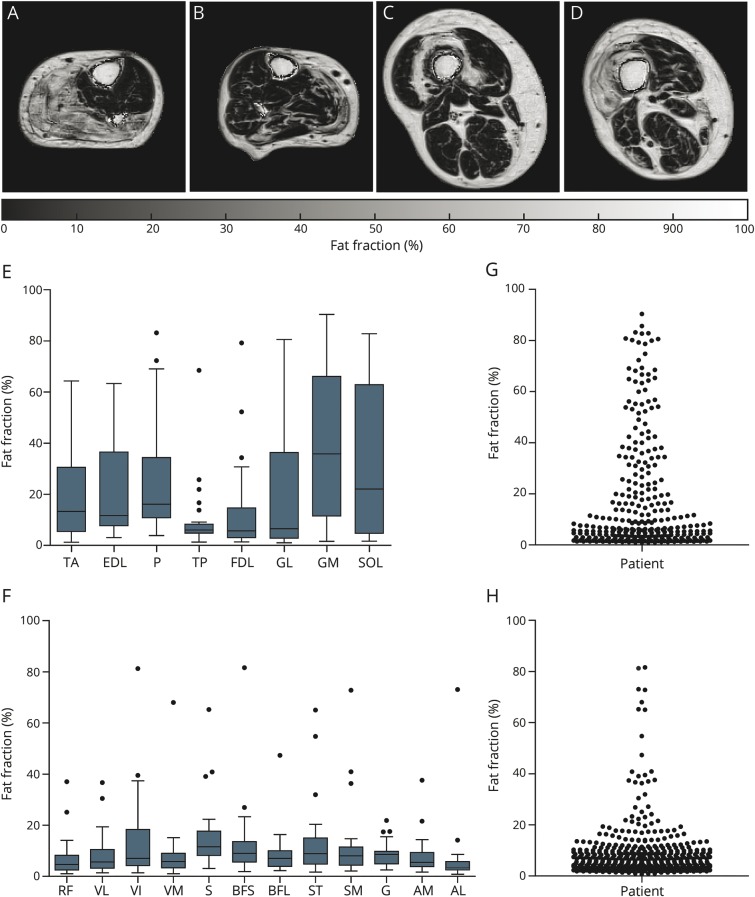
To assess the prevalence of fat infiltration in individual muscles of patients with DM1, we analyzed the fat fractions per muscle (figure 4, A–D). Fat fraction was higher in lower leg muscles compared to upper leg muscles (lower leg 22.5 ± 18.2%, upper leg 10.3 ± 7.6%; Wilcoxon signed rank test, p = 0.001). Among the lower leg muscles, the gastrocnemius medialis and soleus exhibited the highest fat fractions, while the vastus intermedius had the highest fat fraction in the upper leg (figure 4, E and F). The tibialis posterior appeared to be spared in the lower leg. The varying fat fractions in individual lower extremity muscles exhibited a pyramid-like distribution, with fewer highly fat-infiltrated muscles than non–fat-infiltrated muscles, indicating a gradual process of fat infiltration (figure 4, G and H).
Figure 4. Fat infiltration pattern in the lower extremity muscles of patients with DM1.
(A and B) Typical examples of fat fraction maps in the lower leg muscles of patients with myotonic dystrophy type 1 (DM1) showing fat infiltration as hyperintense areas. (C and D) Typical examples of fat fraction maps in the upper leg muscles of patients with DM1. (E) Fat infiltration pattern of the lower leg muscles presented as Tukey boxplots. (F) Fat infiltration pattern in the upper leg muscles presented as Tukey boxplots. (G) Prevalence of fat infiltration in the lower leg muscles; each dot represents 1 muscle in 1 patient. (H) Prevalence of fat infiltration in the upper leg muscles. AM/AL = adductor magnus/longus; BFS/BFL = biceps femoris short/long head; EDL = extensor digitorum longus; FDL = flexor digitorum longus; G = gracilis; GL/GM = gastrocnemius lateralis/medialis; P = peroneus; RF = rectus femoris; S = sartorius; SM = semimembranosus; SOL = soleus; ST = semitendinosus; TA/TP = tibialis anterior/posterior; VL/VI/VM = vastus lateralis/intermedius/medialis.
Effect of age and CTG repeat length on muscle fat infiltration
To assess the effect of age and CTG repeat length on fat infiltration, we applied a multivariate linear regression model, which uncovered age as the primary predictor of a participant's average lower extremity fat fraction (r2 = 0.447, p < 0.001). Fitting of the data was further improved by incorporating CTGePAL (r2 = 0.485, model p value, p < 0.001, parameter p value; age: p < 0.001; CTGePAL: p = 0.090) and CTGResSI with interactions between all parameters (r2 = 0.590, p = 0.001; see also table e-2 available from Dryad, doi.org/10.5061/dryad.4nb96c1). For the latter model, none of the individual parameters reached statistical significance, but stepwise model comparison using the Akaike information criterion confirmed this as the most informative model. The 2 participants with AciI-sensitive variant repeats and a successful fat fraction calculation had lower mean fat fractions than the other patients with DM1 (3.7% vs 16.0%, Welch t test, p = 0.002; figure e-5, available from Dryad, doi.org/10.5061/dryad.4nb96c1).
Fat fraction and contractile muscle volume correlate with disease severity and physical performance
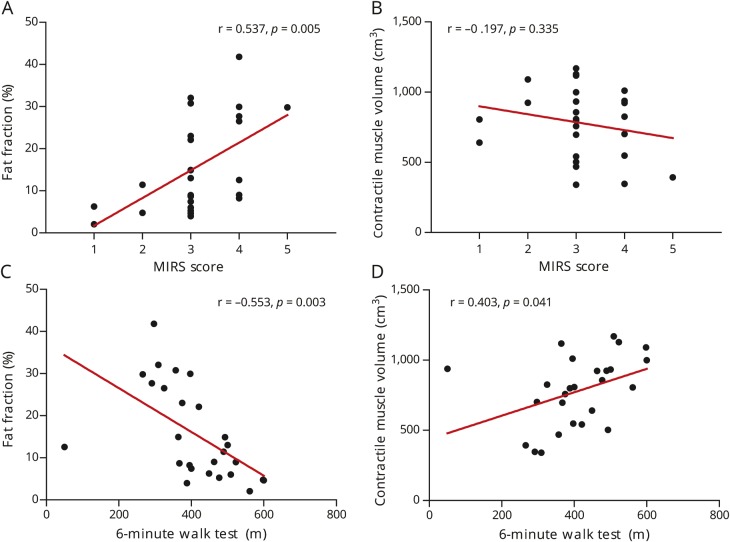
We investigated whether the quantitative MRI biomarkers explored in this study correlate with clinical features of the disease. The average lower extremity fat fraction correlated with the MIRS disease severity score (ρ = 0.537, p = 0.005; figure 5A). However, the MIRS score did not correlate with contractile muscle volume (ρ = −0.197, p = 0.335; figure 5B), muscle volume (ρ = −0.119, p = 0.525), and T2water (ρ = 0.389, p = 0.074). In the 2 patients with an MIRS score of 2, in whom a manual muscle test did not find distal weakness, 13 of the 16 muscles in the lower legs showed a higher fat content than these muscles in controls. In 6 of these muscles, the fat fraction was >10%. In the 16 patients with an MIRS score of 3 in whom no proximal weakness was found in a manual muscle test, we detected increased fat content in 54 upper leg muscles, of which 37 had a fat fraction of >10%.
Figure 5. Quantitative MRI measures vs disease severity and physical capacity.
(A) Fat fraction vs muscular impairment rating scale (MIRS). (B) Contractile muscle volume vs MIRS. (C) Fat fraction vs 6-minute walk test. (D) Contractile muscle volume vs 6-minute walk test.
Both fat fraction and contractile muscle volume correlated with the physical capacity measure 6MWT (fat fraction: r = −0.553, p = 0.003; contractile muscle volume: r = 0.403, p = 0.041; figure 5, C and D), but 6MWT did not correlate with muscle volume (r = 0.245, p = 0.184) and T2water (r = −0.251, p = 0.261). For the individual muscle groups after Bonferroni correction, 6MWT correlated with the fat fraction of the ankle dorsiflexors (r = −0.498, p = 0.007) and ankle plantarflexors (r = −0.574, p = 0.001). The 6MWT did not correlate with any of the other MRI outcome measures of the functional muscle groups (table e-3 available from Dryad, doi.org/10.5061/dryad.4nb96c1).
Discussion
In this international multicenter cross-sectional quantitative MRI study, we observed ≈3 times more fat, an ≈26% reduction in muscle mass, and increased values for MRI markers of pathologic edema in 20 lower extremity muscles of patients with DM1 compared to unaffected controls. In these genetically and clinically well-characterized patients with DM1, quantitative MRI measures correlated with age, CTG repeat length, and clinical outcomes for physical capacity and disease severity.
Using quantitative MRI derived muscle fat fractions, we observed more fat infiltration in muscles of patients with DM1 than in unaffected controls. This fat infiltration was more severe in distal muscles than proximal muscles, corresponding with DM1 being a distal myopathy.2 The gastrocnemius medialis and soleus were most severely affected, followed by the tibialis anterior. In contrast, clinically, ankle dorsiflexion weakness appears to dominate plantarflexion weakness. MRI changes may precede the soleus and gastrocnemius clinical weakness, considering that strength measurements of this strong muscle group are difficult to assess. In agreement with the magnetic resonance results, force measurements using a dynamometer showed a similar decline in ankle plantarflexion and ankle dorsiflexion.25 In the upper leg, the vastus intermedius was the most severely fat-infiltrated muscle. This corresponds with the qualitative observation of a preferential semilunar anterolateral perifemoral area of fatty infiltration on T1-weighted images.9 The typical fat infiltration pattern recorded by our quantitative MRI investigation largely agrees with the semiquantitative Lamminen score in this and other qualitative MRI studies.9,26–29 However, in the objective assessment of disease severity and progression and the evaluation of clinical trials, quantitative analysis of MRIs covering entire muscles—as presented in this study—is essential. To date, only 1 quantitative MRI study, limited to the tibialis anterior, has been performed in DM1.30 Although the results of the MRI-determined changes in fat fraction identify it as a promising biomarker to assess treatments, its real value must be investigated in longitudinal studies.31
An interesting feature of the lower extremity muscles of patients with DM1 is their distribution over different levels of fat infiltration. This shows that, in patients with DM1, the higher the fat content in muscles is, the less prevalent they are, which is reflected in a pyramid-like shape for their distribution over different fat fractions. This is in contrast to lower extremity muscles in patients with facioscapulohumeral dystrophy, in whom a quasi-binary distribution over low and high fat infiltration was observed.32,33 This suggests that fat infiltration progresses more gradually in the muscles of patients with DM1 than in the muscles of patients facioscapulohumeral dystrophy, in which individually affected muscles exhibit a relatively fast transition from apparently normal to completely fat infiltrated.
By quantitative MRI, we determined an average reduction in muscle volume and contractile muscle volume in patients with DM1 compared to unaffected controls, in line with an earlier observation for the tibialis anterior.30 Reduced muscle cross-sectional areas have also been reported for Duchenne muscular dystrophy, Charcot-Marie-Tooth 1A, and inclusion body myositis.34,35 The reduced muscle volume in patients with DM1, containing both fat and muscle tissue, indicates that contractile muscle volume is reduced by muscle atrophy and fat infiltration. These findings support the use of muscle volume and contractile muscle volume as MRI biomarkers to monitor changes in muscle mass.
To analyze the presence of putative edema associated with disease activity, we determined the Malattia score on TIRM images and the T2water. We found an increased sum Malattia score and increased average T2water in the muscles of patients with DM1. The results indicate that edema-associated processes occur before the presence of fat infiltration; i.e., 20% of the muscle with a Lamminen score of 1 had a Malattia score of 1 or 2, and T2water was increased in non–fat-infiltrated muscles. Increased T2water in muscles with apparently normal fat fractions was also observed in Pompe disease, Duchenne muscular dystrophy, inclusion body myositis, and Charcot-Marie-Tooth 1A.35–37 This suggests that T2water is an early marker of pathologic changes in muscles of patients with DM1 and may be useful for evaluating early treatment effects. Increased T2water indicates edema caused by inflammation, necrosis, or swelling of myocytes, although, as in other muscular dystrophies, it remains unknown what the precise origins are for the observed increases in all cases.6
After establishing the fat fractions for the lower extremity muscles of patients with DM1, we compared the amount of fat infiltration in these muscles with determinants of disease severity, i.e., age and CTG repeat length. In our patients with DM1, age explained ≈45% of the between-participant variation in fat fraction. This variation is attributed mainly to the progressive nature of DM1 because in healthy volunteers the effect of age is negligibly small (1%–2% higher fat fraction in elderly compared to young persons).38 An additional amount of this variation was explained by the estimated progenitor allele length (≈48%) and individual-specific residual variation in somatic instability (≈59%). This suggests that ongoing somatic CTG expansions accrued during a patient's lifetime directly contribute to disease severity, as was established for age at onset.39 Previously, a relation between the radiologic scoring of T1-weighted images and the average CTG repeat length at time of recruitment was observed.28 Furthermore, the patients with DM1 who carried AciI-sensitive variant repeats, most likely CCG or CGG variants, exhibited a slower increase in fat fractions than patients with DM1 without detectable variant repeats. This is consistent with the literature on the effect of variant repeats and is probably mediated via the stabilizing effect of variant repeats reducing the rate of somatic expansion.14–16 Individual parameters or interactions in the multivariate regression models were not significant, and only 2 patients with AciI-sensitive variant repeats were assessed. Nevertheless, our data highlight the value of genetic profiling for future randomized controlled trials, because age and CTG repeat length determine the severity of muscle involvement at baseline and most likely its progression over time.
Finally, we investigated whether the quantitative MRI outcome measures reflect disease severity and physical capacity of the patients with DM1. We observed that the 6MWT results correlate with fat fraction and contractile muscle volume and that the MIRS disease score correlates with fat fraction. This is in agreement with other DM1 studies that showed correlations between semiquantitatively scored fat infiltration and 6MWT and between fat infiltration and contractile muscle volume of the tibialis anterior and ankle dorsiflexion torque.28,30 The fat fraction in the ankle dorsiflexors and plantarflexors had the best correlation with the 6MWT, indicating that assessment of the lower leg gives a good representation of the patient’s physical capacity. The probable reason is that in DM1 these muscles are affected earliest. Furthermore, we observed in patients with an MIRS score of 2, in whom no distal weakness is expected, increased fat fractions in lower leg muscles and in patients with an MIRS score of 3, in whom no proximal weakness is expected, an increased fat fraction in upper leg muscles. This demonstrates that quantitative MRI can detect subclinical muscle involvement and thus may serve in the prediction of clinical muscle affliction. This capacity of quantitative MRI has also been observed for other muscular dystrophies and further emphasizes its value as a potential tool in the evaluation of therapies.32,40–42
We observed 1 outlier, a patient with a low 6MWT (50 m) and a relatively normal fat fraction (12.5%) and contractile muscle volume (938 cm3). In this case, the 6MWT likely reflected this patient's overall condition or motivation as opposed to muscle function alone. This further illustrates the more objective value of quantitative MRI in assessing muscle involvement in DM1, as has been established for other muscular dystrophies.6,43
Quantitative MRI of 20 different lower extremity muscles in 33 patients with DM1 demonstrated increased fat infiltration, reduced contractile muscle mass, and the presence of putative edema, the last reflected by an elevated T2water. Fat infiltration was determined primarily by age, followed by inherited CTG repeat length, and ongoing CTG repeat expansion accrued over time. Abnormal MRI parameter values correlated with decreased physical capacity and disease severity but also identified subclinical involvement and therefore can potentially serve as objective, quantitative biomarkers to assess disease state and to evaluate therapies. For the latter, larger longitudinal natural history studies are required for validation.
Acknowledgment
The authors thank all participants for participating in this study. They thank the OPTIMISTIC Consortium for critical remarks on the data analysis and interpretation. In addition, they thank Barbara Janssen for help with the MRI protocol, Ferroudja Daidj for participant management in Paris, and Sjaak van Asten, Lydia Overtoom, and Justine van Eerden for their help with data acquisition or processing.
Glossary
- DM1
myotonic dystrophy type 1
- DMPK
dystrophia myotonica protein kinase
- FOV
field of view
- MIRS
muscular impairment rating scale
- OPTIMISTIC
Observational Prolonged Trial in Myotonic Dystrophy Type 1
- 6MWT
6-minute walk test
- TIRM
turbo inversion recovery magnitude
- TE
echo time
- TR
repetition time
Appendix. Authors

Study funding
Funding provided by the European Union's Seventh Framework Programme for research, technological development and demonstration (grant agreement 305697).
Disclosure
The authors report no disclosures relevant to the manuscript. Go to Neurology.org/N for full disclosures.
References
- 1.Udd B, Krahe R. The myotonic dystrophies: molecular, clinical, and therapeutic challenges. Lancet Neurol 2012;11:891–905. [DOI] [PubMed] [Google Scholar]
- 2.Meola G, Cardani R. Myotonic dystrophies: an update on clinical aspects, genetic, pathology, and molecular pathomechanisms. Biochim Biophys Acta 2015;1852:594–606. [DOI] [PubMed] [Google Scholar]
- 3.Chau A, Kalsotra A. Developmental insights into the pathology of and therapeutic strategies for DM1: back to the basics. Dev Dyn 2015:377–390. [DOI] [PubMed] [Google Scholar]
- 4.Brook JD, McCurrach ME, Harley HG, et al. Molecular basis of myotonic dystrophy: expansion of a trinucleotide (CTG) repeat at the 3' end of a transcript encoding a protein kinase family member. Cell 1992;68:799–808. [DOI] [PubMed] [Google Scholar]
- 5.Mulders SAM, van Engelen BGM, Wieringa B, Wansink DG. Molecular therapy in myotonic dystrophy: focus on RNA gain-of-function. Hum Mol Genet 2010;19:90–97. [DOI] [PubMed] [Google Scholar]
- 6.Carlier PG, Marty B, Scheidegger O, et al. Skeletal muscle quantitative nuclear magnetic resonance imaging and spectroscopy as an outcome measure for clinical trials. J Neuromuscul Dis 2016;3:1–28. [DOI] [PMC free article] [PubMed] [Google Scholar]
- 7.Burakiewicz J, Sinclair CDJ, Fischer D, Walter GA, Kan HE, Hollingsworth KG. Quantifying fat replacement of muscle by quantitative MRI in muscular dystrophy. J Neurol 2017;264:2053–2067. [DOI] [PMC free article] [PubMed] [Google Scholar]
- 8.Hollingsworth KG, de Sousa PL, Straub V, Carlier PG. Towards harmonization of protocols for MRI outcome measures in skeletal muscle studies: consensus recommendations from two TREAT-NMD NMR workshops, 2 May 2010, Stockholm, Sweden, 1–2 October 2009, Paris, France. Neuromuscul Disord 2012;22:S54–S67. [DOI] [PubMed] [Google Scholar]
- 9.Kornblum C, Lutterbey G, Bogdanow M, et al. Distinct neuromuscular phenotypes in myotonic dystrophy types 1 and 2: a whole body highfield MRI study. J Neurol 2006;253:753–761. [DOI] [PubMed] [Google Scholar]
- 10.van Engelen B. Cognitive behaviour therapy plus aerobic exercise training to increase activity in patients with myotonic dystrophy type 1 (DM1) compared to usual care (OPTIMISTIC): study protocol for randomised controlled trial. Trials 2015;16:224. [DOI] [PMC free article] [PubMed] [Google Scholar]
- 11.Mathieu J, Boivin H, Meunier D, Gaudreault M, Bégin P. Assessment of a disease-specific muscular impairment rating scale in myotonic dystrophy. Neurology 2001;56:336–340. [DOI] [PubMed] [Google Scholar]
- 12.Hermans MCE, Hoeijmakers JGJ, Faber CG, Merkies ISJ. Reconstructing the Rasch-built myotonic dystrophy type 1 activity and participation scale. PLoS One 2015;10:310–318. [DOI] [PMC free article] [PubMed] [Google Scholar]
- 13.Vercoulen J, Alberts M, Bleijenberg G. De Checklist Individual Strength (CIS). Gedragstherapie 1999;32:131–136. [Google Scholar]
- 14.Braida C, Stefanatos RKA, Adam B, et al. Variant CCG and GGC repeats within the CTG expansion dramatically modify mutational dynamics and likely contribute toward unusual symptoms in some myotonic dystrophy type 1 patients. Hum Mol Genet 2010;19:1399–1412. [DOI] [PubMed] [Google Scholar]
- 15.Santoro M, Masciullo M, Pietrobono R, et al. Molecular, clinical, and muscle studies in myotonic dystrophy type 1 (DM1) associated with novel variant CCG expansions. J Neurol 2013;260:1245–1257. [DOI] [PubMed] [Google Scholar]
- 16.Botta A, Rossi G, Marcaurelio M, et al. Identification and characterization of 5′ CCG interruptions in complex DMPK expanded alleles. Eur J Hum Genet 2017;25:257–261. [DOI] [PMC free article] [PubMed] [Google Scholar]
- 17.Lamminen AE. Magnetic resonance imaging of primary skeletal muscle diseases: patterns of distribution and severity of involvement. Br J Radiol 1990;63:946–950. [DOI] [PubMed] [Google Scholar]
- 18.Malattia C, Damasio MB, Madeo A, et al. Whole-body MRI in the assessment of disease activity in juvenile dermatomyositis. Ann Rheum Dis 2014;73:1083–1090. [DOI] [PubMed] [Google Scholar]
- 19.Weigel M. Extended phase graphs: dephasing, RF pulses, and echoes—pure and simple. J Magn Reson Imaging 2015:266–295. [DOI] [PubMed] [Google Scholar]
- 20.Marty B, Baudin PY, Reyngoudt H, et al. Simultaneous muscle water T2 and fat fraction mapping using transverse relaxometry with stimulated echo compensation. NMR Biomed 2016;29:431–443. [DOI] [PubMed] [Google Scholar]
- 21.Azzabou N, De Sousa PL, Caldas E, Carlier PG. Validation of a generic approach to muscle water T2 determination at 3T in fat-infiltrated skeletal muscle. J Magn Reson Imaging 2015;41:645–653. [DOI] [PubMed] [Google Scholar]
- 22.RStudio Team. RStudio: Integrated Development for R Version 1.0.136. Boston: RStudio Inc; 2016. Available at: rstudio.com/. Accessed January 24, 2018. [Google Scholar]
- 23.R Core Team. R: A Language and Environment for Statistical Computing. Vienna: R Foundation for Statistical Computing; 2016. Available at: www.r-project.org/. Accessed January 24, 2018. [Google Scholar]
- 24.Venables WN, Ripley BD. Modern Applied Statistics With S-Plus. 4th ed. New York: Springer; 2002. [Google Scholar]
- 25.Andersen G, Ørngreen MC, Preisler N, et al. Muscle phenotype in patients with myotonic dystrophy type 1. Muscle Nerve 2013;47:409–415. [DOI] [PubMed] [Google Scholar]
- 26.Damian MS, Bachmann G, Herrmann D, Dorndorf W. Magnetic resonance imaging of muscle and brain in myotonic dystrophy. J Neurol 1993;240:8–12. [DOI] [PubMed] [Google Scholar]
- 27.Stramare R, Beltrame V, Dal Borgo R, et al. MRI in the assessment of muscular pathology: a comparison between limb-girdle muscular dystrophies, hyaline body myopathies and myotonic dystrophies. Radiol Med 2010;115:585–599. [DOI] [PubMed] [Google Scholar]
- 28.Park D, Lee SH, Shin JH, Park JS. Lower limb muscle magnetic resonance imaging in myotonic dystrophy type 1 correlates with the six-minute walk test and CTG repeats. Neuromuscul Disord 2018;28:29–37. [DOI] [PubMed] [Google Scholar]
- 29.Peric S, Maksimovic R, Banko B, et al. Magnetic resonance imaging of leg muscles in patients with myotonic dystrophies. J Neurol 2017;264:1899–1908. [DOI] [PubMed] [Google Scholar]
- 30.Hiba B, Richard N, Hébert LJ, et al. Quantitative assessment of skeletal muscle degeneration in patients with myotonic dystrophy type 1 using MRI. J Magn Reson Imaging 2012;35:678–685. [DOI] [PubMed] [Google Scholar]
- 31.Carlier PG, Azzabou N, de Sousa PL, et al. Skeletal muscle quantitative nuclear magnetic resonance imaging follow-up of adult Pompe patients. J Inherit Metab Dis 2015;38:565–572. [DOI] [PMC free article] [PubMed] [Google Scholar]
- 32.Janssen BH, Voet NBM, Nabuurs CI, et al. Distinct disease phases in muscles of facioscapulohumeral dystrophy patients identified by MR detected fat infiltration. PLoS One 2014;9:e85416. [DOI] [PMC free article] [PubMed] [Google Scholar]
- 33.Andersen G, Dahlqvist JR, Vissing CR, Heje K, Thomsen C, Vissing J. MRI as outcome measure in facioscapulohumeral muscular dystrophy: 1-year follow-up of 45 patients. J Neurol 2017;264:438–447. [DOI] [PubMed] [Google Scholar]
- 34.Wokke BH, van den Bergen JC, Versluis MJ, et al. Quantitative MRI and strength measurements in the assessment of muscle quality in Duchenne muscular dystrophy. Neuromuscul Disord 2014;24:409–416. [DOI] [PubMed] [Google Scholar]
- 35.Morrow JM, Sinclair CDJ, Fischmann A, et al. MRI biomarker assessment of neuromuscular disease progression: a prospective observational cohort study. Lancet Neurol 2016;15:65–77. [DOI] [PMC free article] [PubMed] [Google Scholar]
- 36.Forbes SC, Willcocks RJ, Triplett WT, et al. Magnetic resonance imaging and spectroscopy assessment of lower extremity skeletal muscles in boys with Duchenne muscular dystrophy: a multicenter cross sectional study. PLoS One 2014;9:1–8. [DOI] [PMC free article] [PubMed] [Google Scholar]
- 37.Hooijmans MT, Niks EH, Burakiewicz J, Verschuuren JJGM, Webb AG, Kan HE. Elevated phosphodiester and T2 levels can be measured in the absence of fat infiltration in Duchenne muscular dystrophy patients. NMR Biomed 2017;30:e3667. [DOI] [PubMed] [Google Scholar]
- 38.Azzabou N, Hogrel JY, Carlier PG. NMR based biomarkers to study age-related changes in the human quadriceps. Exp Gerontol 2015;70:54–60. [DOI] [PubMed] [Google Scholar]
- 39.Morales F, Couto JM, Higham CF, et al. Somatic instability of the expanded CTG triplet repeat in myotonic dystrophy type 1 is a heritable quantitative trait and modifier of disease severity. Hum Mol Genet 2012;21:3558–3567. [DOI] [PubMed] [Google Scholar]
- 40.Sookhoo S, MacKinnon I, Bushby K, Chinnery PF, Birchall D. MRI for the demonstration of subclinical muscle involvement in muscular dystrophy. Clin Radiol 2007;62:160–165. [DOI] [PubMed] [Google Scholar]
- 41.Fischmann A, Hafner P, Fasler S, et al. Quantitative MRI can detect subclinical disease progression in muscular dystrophy. J Neurol 2012;259:1648–1654. [DOI] [PubMed] [Google Scholar]
- 42.Janssen B, Voet N, Geurts A, Van Engelen B, Heerschap A. Quantitative MRI reveals decelerated fatty infiltration in muscles of active FSHD patients. Neurology 2016;86:1700–1707. [DOI] [PubMed] [Google Scholar]
- 43.Willis TA, Hollingsworth KG, Coombs A, et al. Quantitative muscle MRI as an assessment tool for monitoring disease progression in LGMD2I: a multicentre longitudinal study. PLoS One 2013;8:6–12. [DOI] [PMC free article] [PubMed] [Google Scholar]
Associated Data
This section collects any data citations, data availability statements, or supplementary materials included in this article.
Data Availability Statement
We encourage researchers wishing to access the generated anonymized data to submit a request to the corresponding author. Requests for access will be reviewed by a panel, and a data access agreement needs to be signed.


