Abstract
Objective
We present an objective and quantitative approach for diagnosing internuclear ophthalmoplegia (INO) in multiple sclerosis (MS).
Methods
A validated standardized infrared oculography protocol (DEMoNS [Demonstrate Eye Movement Networks with Saccades]) was used for quantifying prosaccades in patients with MS and healthy controls (HCs). The versional dysconjugacy index (VDI) was calculated, which describes the ratio between the abducting and adducting eye. The VDI was determined for peak velocity, peak acceleration, peak velocity divided by amplitude, and area under the curve (AUC) of the saccadic trajectory. We calculated the diagnostic accuracy for the several VDI parameters by a receiver operating characteristic analysis comparing HCs and patients with MS. The National Eye Institute Visual Function Questionnaire–25 was used to investigate vision-related quality of life of MS patients with INO.
Results
Two hundred ten patients with MS and 58 HCs were included. The highest diagnostic accuracy was achieved by the VDI AUC of 15° horizontal prosaccades. Based on a combined VDI AUC and peak velocity divided by amplitude detection, the prevalence of an INO in MS calculated to 34%. In the INO group, 35.2% of the patients with MS reported any complaints of double vision, compared to 18.4% in the non-INO group (p = 0.010). MS patients with an INO had a lower overall vision-related quality of life (median 89.9, interquartile range 12.8) compared to patients without an INO (median 91.8, interquartile range 9.3, p = 0.011).
Conclusions
This study provides an accurate quantitative and clinically relevant definition of an INO in MS. This infrared oculography-based INO standard will require prospective validation. The high prevalence of INO in MS provides an anatomically well described and accurately quantifiable model for treatment trials in MS.
An internuclear ophthalmoplegia (INO) is an eye movement disorder in multiple sclerosis (MS) in which the adducting eye movement is slowed down compared to the abducting eye movement. The cause of an INO is demyelination in the medial longitudinal fasciculus (MLF). The MLF connects the abducens nucleus of one side of the brainstem with the oculomotor nucleus of the other side. Conjugacy of horizontal saccades therefore depends on conduction through the MLF. With clinical assessment, the diagnosis can be easily missed,1 and consequently no gold standard is available for diagnosis.
Infrared oculography is a noninvasive, objective, and quantitative tool to assess an INO, which recently has become more widely available. Earlier studies have established the versional dysconjugacy index (VDI)2 as a sensitive way to describe an INO.3,4 However, the few studies that investigated VDI parameters in patients with MS had important limitations, such as small sample sizes and inclusion bias by subjective selection of patients with a clinically evident INO.3–5 Furthermore, there was a lack of a systematic approach to the analytical evaluation of the various VDI parameters and cutoff points.
The aim of this study was to provide prevalence figures of INO in MS based on an objective and quantitative definition. Next, we investigated the effect of an INO on patients' visual functions and vision-related quality of life (QoL).
Methods
Standard protocol approvals, registrations, and patient consents
This study (study number 2015.227) was approved by the Medical Ethical Committee on Human Research of the Amsterdam University Medical Centers (location VUmc). Written informed consent was obtained from all participants prior to inclusion.
Study design and patient population
For this observational cross-sectional study, patients with MS and healthy controls (HCs) were included from the Amsterdam MS cohort, an ongoing observational cohort of the Amsterdam University Medical Center.6–8 For this cohort, eligible patients were prospectively recruited from our MS Center. Participants were at least 18 years of age. All patients with MS had to fulfill clinical and radiologic criteria for a diagnosis of clinically definite MS.9 The disease course was described as relapsing-remitting (RR), secondary progressive, or primary progressive.10 Exclusion criteria included immunodeficiency syndrome, relapse or course of steroids within 6 weeks of inclusion, pregnancy, or history of drug or alcohol abuse. HCs were recruited via advertisements in the hospital and nonrelated family and friends.
Clinical and ophthalmologic assessment
All assessments (clinical, infrared oculography, and questionnaires) were performed on the same day and in the same order of sequence.
The disease duration was calculated in years from the first MS symptom. The Expanded Disability Status Scale (EDSS) score11 was determined by a certified examiner to assess the level of disability. The global Multiple Sclerosis Severity Score, which combines disease duration and EDSS in one variable, was taken from the lookup table provided in reference 12. History of symptomatic MS-associated optic neuritis (MSON) was based on a consensus protocol,13 including recording of the best corrected high- and low-contrast visual acuities (HCVA and LCVA, respectively) using Sloan letter charts (100% for HCVA, 2.5% for LCVA).14 The vision-related QoL was assessed with the National Eye Institute Visual Function Questionnaire–25.15,16 In addition, an in-house questionnaire for complaints specific to problems with eye movement was included (available from Protocols.io [Questionnaire Eye Movement Complaints] protocols.io/view/questionnaire-eye-movements-complaints-vrxe57n).
Infrared oculography
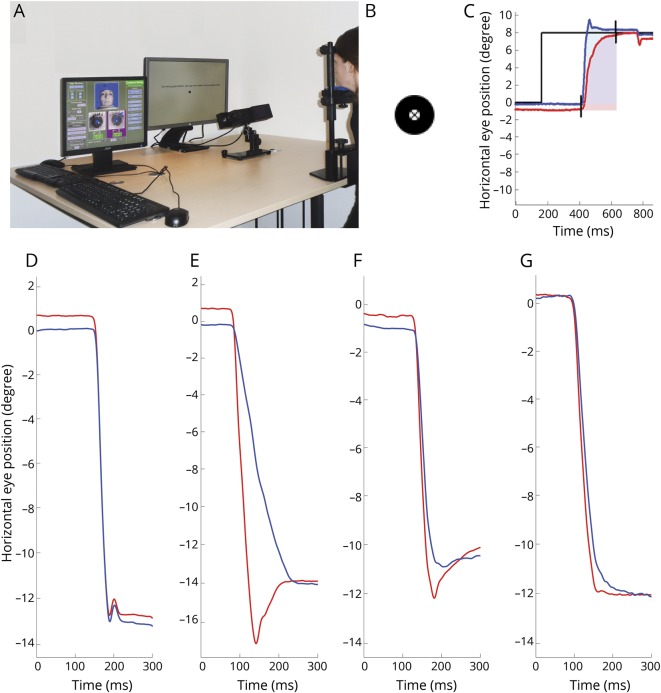
The eye movements were measured using the EyeLink 1000 Plus eye tracker (SR Research, Ottawa, Canada), which uses the pupil and corneal reflection for determining eye position. Data were sampled at a frequency of 1,000 Hz. Participants were seated at 92 cm (eye-monitor distance) in front of a display monitor (HP EliteDisplay E241i, 24 inch, resolution of 1,024 × 768 pixels used). The head was stabilized by means of a chin and a forehead rest. The EyeLink 1000 Plus desktop mount (with the camera) was located 50 to 55 cm in front of the chin rest, just below the display monitor (figure 1A). All experiments were performed in a quiet room under dim lighting conditions (20–50 Lux). Proprietary built-in algorithms were used for calibration and validation procedures.
Figure 1. Measurement with infrared oculography.
(A) Setup of the measurement. Participants were seated in front of a display monitor with their head stabilized with a chin and forehead rest. The camera was located in front of the chin rest, just below the line of sight. (B) Target used in the measurements: circle with a black cross in the center. (C) Schematic representation of the AUC. The AUC is assessed from the first starting saccade (left eye in red, right eye in blue) until the last ending saccade (left or right eye). In this period, the area is calculated for both eyes separately by summing the horizontal eye position at every time point minus the horizontal start position of the saccade. (D–G) Horizontal eye position (y-axis) against the time (x-axis) of a leftward saccade of 4 different patients with multiple sclerosis, captured by infrared oculography. The blue line represents the right eye; the red line represents the left eye. (D) Leftward saccade without adduction delay, VDI AUC 1.07 and VDI Pv/Am 1.00. (E) Leftward saccade with clear adduction delay, VDI AUC 1.60 and VDI Pv/Am 2.32. (F) Leftward saccade with mild adduction delay, VDI AUC 1.37 and VDI Pv/Am of 1.15. (G) Leftward saccade with mild adduction delay, VDI AUC 1.12 and VDI Pv/Am of 1.25. AUC = area under the curve of the saccadic trajectory; Pv/Am = peak velocity divided by amplitude; VDI = versional dysconjugacy index.
We developed and validated a standardized protocol suitable for a multicenter setting, the DEMoNS [Demonstrate Eye Movement Networks with Saccades] protocol.17 The prosaccadic task of this protocol was used for the present study. This assessment contains 5 trials of 12 horizontal prosaccades, from the center of the screen to an eccentric location, either 8° or 15° left or 8° or 15° right, in a random order and after a fixation period with a random duration between 1 and 3.5 seconds. The target of the measurement is shown in figure 1B. Four examples of saccades of patients with MS captured by infrared oculography are shown in figure 1, D–G.
For the automatic and offline analysis of the eye movement data, we used an in-house written program in MATLAB (MathWorks, Inc., Natick, MA).17 To pass quality control, at least 50% of centrifugal saccades needed to be acceptable for a participant to be included.
The mean VDI values were calculated for the following parameters: peak velocity (the maximum saccadic velocity during the saccadic trajectory), peak acceleration (the maximum acceleration during the saccadic trajectory), and first-pass amplitude (FPA) (ratio of the eye position when the abducting eye first reaches the target position5). Furthermore, we included 2 new VDI parameters, the main sequence relationship (peak velocity divided by saccadic amplitude [Pv/Am]) and the area under the curve (AUC) of the horizontal saccadic trajectory (figure 1C). The VDI is a ratio of the abducting to the adducting eye movement. The advantage of using the VDI instead of the primary monocular parameters is that it eliminates the majority of the within- and between-subject variability of these parameters. The reproducibility of these VDI parameters is excellent with all intraclass correlation coefficients above 0.9.17 Mean VDI of rightward saccades and mean VDI of leftward saccades were added separately in the analysis.
Statistical analyses
In absence of a quantitative gold standard for an INO, we were required to calculate reasonable cutoff values. Our assumption was that there was no pathologic INO in the asymptomatic HCs. Therefore, we calculated a range of cutoff points for the various VDI parameters by a receiver operating characteristic (ROC) analysis using HCs and patients with MS. Because the only certain factor in this analysis is the expected absence of INO in HCs, high specificity values are needed. We decided to compare sensitivity of the individual parameters in the specificity range above 97.5%, because a specificity of 97.5% is analogous to the commonly used z score of >1.96 of a HC group (1.96 is the value of the 97.5 percentile point of the normal distribution). Subsequently, detection of the different parameters was compared. Based on the highest accuracy, a VDI threshold or combination of VDI thresholds was picked for detecting an INO. Next, patients with MS were dichotomized in a group with (INO group) and without (non-INO group) INO. Finally, the adduction delay was used to subclassify the INO group into bilateral, left, and right.
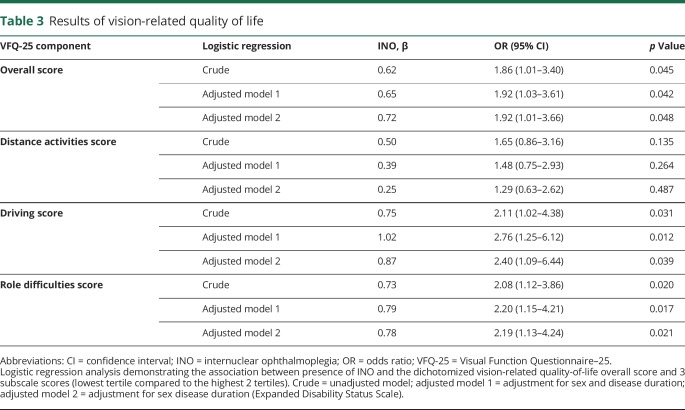
Data were analyzed visually and statistically for normality. Independent t tests (gaussian data) and nonparametric tests (nongaussian data) were used for the comparison of parameters between patients with MS and HCs and between patients with and without INO. The χ2 test was used for categorical data. Logistic regression analyses were used to analyze the relationship of presence of an INO in MS to differences in vision-related QoL (lowest vs highest 2 tertiles). These analyses were adjusted for the possible confounders age, sex, and EDSS score.
Statistical analyses were performed using SPSS Statistics 22.0 (IBM Corp., Armonk, NY). The visual comparisons of VDI parameters were performed with Venny 2.1 (J.C. Oliveros, bioinfogp.cnb.csic.es/tools/venny/index.html).
Data availability
Anonymized, General Data Protection Regulation–compliant data can be shared by request from qualified investigators. The protocol for measurement and analysis of eye movements is available from Protocols.io.
Results
Study population
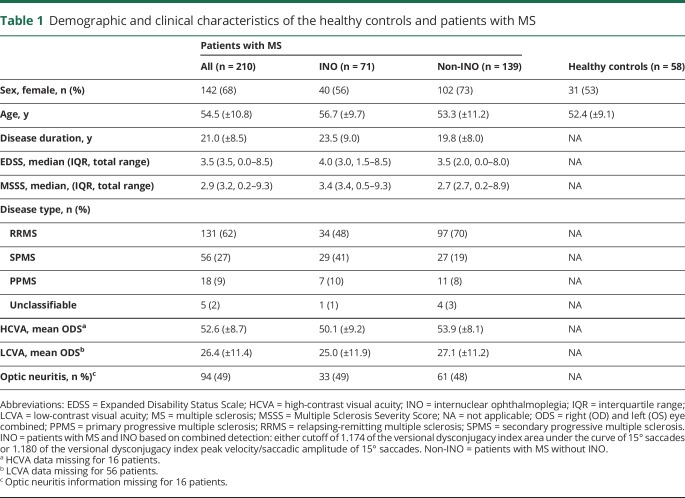
In total 226 patients with MS and 61 HCs were recruited to this study. Of these, we had to exclude 16 patients with MS and 3 HCs because of corrupted data files (n = 6), quality of the data (n = 12), and one mono-ocular measurement. The demographic and clinical characteristics of the included participants are summarized in table 1. The percentage of females in the patient group was higher than in the HC group (p = 0.046). Patients had a mean disease duration of 21.0 (±8.5) years and the majority (62%) had an RR disease course.
Table 1.
Demographic and clinical characteristics of the healthy controls and patients with MS
INO detection
On average, 6.2 (±6.0) saccades per participant were excluded based on automated quality control.
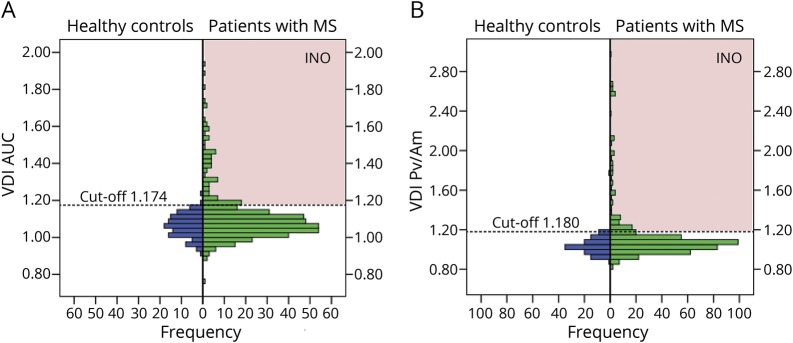
The raw data of the VDI AUC of 15° saccades (VDI AUC15) is summarized in figure 2A. The left side of the graphs shows a gaussian distribution of the VDI AUC15 in the HCs, with a mean VDI AUC15 of 1.063 (±0.062). Based on ROC analyses, a cutoff value of 1.174 for the VDI AUC15 (horizontal dotted line in figure 2B) gave the highest accuracy. With this threshold, the specificity for separating HCs from patients with MS was 98%.
Figure 2. VDI distribution.
Distribution of the VDI AUC and Pv/Am of 15° saccades of healthy controls and patients with MS. Both leftward and rightward VDIs are included. The INO detection thresholds are indicated by the dashed lines. Patients with MS who had VDIs above one of these thresholds (red-shaded areas) are classified as INO. (A) VDI AUC, detection threshold 1.174. (B) VDI Pv/Am, detection threshold 1.180. AUC = area under the curve; INO = internuclear ophthalmoplegia; MS = multiple sclerosis; Pv/Am = peak velocity divided by amplitude; VDI = versional dysconjugacy index.
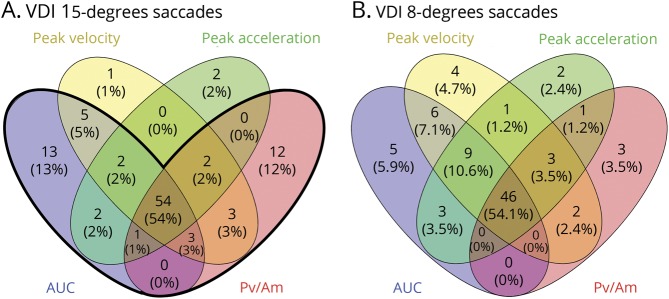
This ROC-based analysis was systematically repeated for all VDI parameters (except the VDI FPA). The cutoff values for 3 levels of diagnostic specificity (100%, 99%, 98%) are summarized in table 2; for nearly all parameters, the specificity level of 98% gave the highest accuracy. Comparisons between the VDI parameters at a specificity level of 98% are shown in figure 3. The total number of VDIs above the thresholds in the MS group was higher for 15° (figure 3A) than for 8° saccades (figure 3B) at this same specificity level. Furthermore, addition of the VDI Pv/Am15 parameter (specificity level 98%, cutoff 1.180; figure 2B) to the detection with the VDI AUC15, the percentage of VDIs above the threshold increased from 19% to 23%, with minimal change of specificity (from 98% to 97%). This indicated that using a combined detection of the VDI Pv/Am15 and VDI AUC15 resulted in the highest accuracy. Therefore, for the remainder of this study, an INO was diagnosed in a patient if at least one of these VDIs exceeded the threshold.
Table 2.
Summary of the upper reference values (VDI cutoff) for detection of an INO in MS (MS INO+) based on receiver operating characteristic analysis
Figure 3. VDI parameter comparisons.
Venn diagram showing the (overlap between) the detection of internuclear ophthalmoplegias with different VDI parameters. For every parameter, the number and percentage of VDIs in the multiple sclerosis group that exceeded the VDI cutoffs at a specificity level of 98% (table 2) are presented. Both leftward and rightward VDIs are included. (A) VDIs of 15° saccades. Total number of VDIs above the thresholds: 100. The bold black line indicates the combined detection of the VDI AUC and VDI Pv/Am of 15° saccades, which resulted in the highest accuracy. With this detection, 97% of the number of VDIs above the threshold is included, which corresponds to 23% of all VDIs of patients with multiple sclerosis included in the analysis. The corresponding specificity (percentage of VDIs of healthy controls that do not exceed the threshold) is 97%. (B) VDIs of 8° saccades. Total number of VDs above the thresholds is 85. AUC = area under the curve of saccadic trajectory; Pv/Am = peak velocity divided by amplitude; VDI = versional dysconjugacy index.
An additional 12.7 (±8.3) saccades per measurement had to be discarded when calculating the VDI FPA, which resulted in exclusion of more than 50% of the saccades in 59 participants. Therefore, this VDI was excluded from further analysis.
INO prevalence and MS characteristics
The VDI AUC15 and VDI Pv/Am15 (figure 2) were used to dichotomize patients into INO and non-INO. In total, 71 patients (34%) with MS were classified as having an INO. The INO was bilateral in 26 (37%), to the right in 21 (30%), and to the left in 24 (34%).
In table 1, differences in disease characteristics are shown in the INO and non-INO groups. Patients with an INO had a longer disease duration compared to patients without INO (p = 0.006). Likewise, patients with an INO were more disabled on the EDSS (p < 0.001) and the Multiple Sclerosis Severity Score (p = 0.012) compared to patients without INO. The median difference in the Brainstem Functional System Score of the EDSS was 1.0 (p = 0.005). Furthermore, an INO was more frequent in patients with a progressive disease course (primary progressive, secondary progressive) compared to patients with an RR disease course (p = 0.006). Finally, HCVA was slightly lower in the INO group (p = 0.003) and there were no significant differences in LCVA or MSON between the INO and non-INO groups.
INO and visual complaints and vision-related QoL
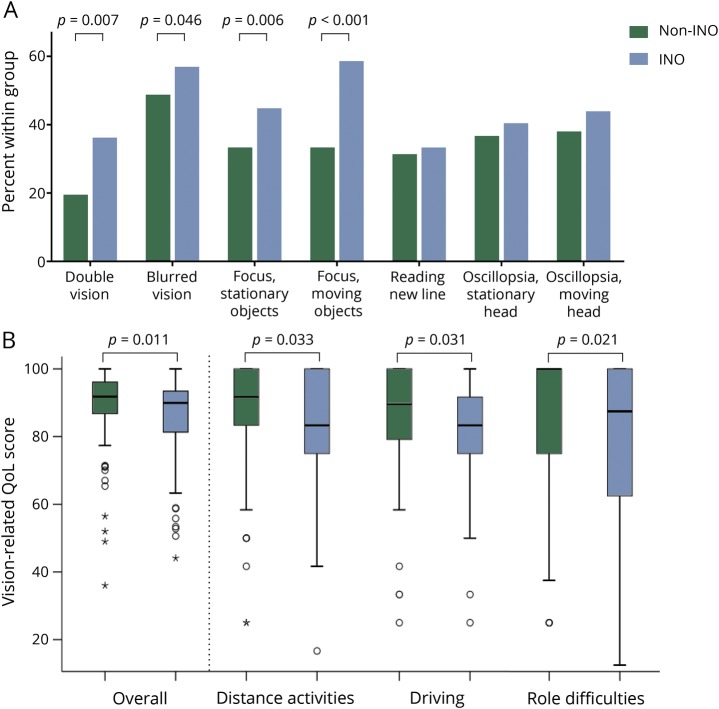
The prevalence of complaints on the eye movement questionnaire is shown in figure 4A. In the INO group, 35.2% of the patients with MS reported visual complaints consisting of diplopia compared to 18.4% in the non-INO group. Only 3 patients (1.4%) reported “severe” or “very severe” complaints of diplopia; they were all classified as having an INO. Likewise, 49.3% of the patients with an INO reported complaints of visually focusing stationary objects and 60.6% of visually focusing moving objects, compared to, respectively, 29.9% and 29.9% of patients without an INO.
Figure 4. Eye movement complaints and vision-related QoL.
(A) Frequency of complaints (of any severity) on the eye movement questionnaire of patients with and without INO. (B) Vision-related QoL scores of patients with and without INO. The overall score and the scores of a few subdomains are shown. INO = internuclear ophthalmoplegia; QoL = quality of life.
Patients with MS reported a median overall vision-related QoL score of 91.4 (interquartile range [IQR] 10.6). The lowest scores were seen on the subdomains general vision (median 80.0, IQR 20.0) and driving (median 83.1, IQR 25.0). When investigating the effect of having an INO on vision-related QoL, it was shown that MS patients with an INO had a lower overall vision-related QoL (median 89.9, IQR 12.8) compared to patients without an INO (median 91.8, IQR 9.3; figure 4B). This difference was apparent at different subdomains, most prominently in the subdomains distance activities, role difficulties, and driving (figure 4B).
Furthermore, of the patients with MS who scored in the lowest tertile of the overall vision-related QoL score, 44.1% were classified as having an INO. Logistic regression analysis revealed a significant effect of the presence of an INO on the overall vision-related QoL score with an odds ratio of 1.86 (95% confidence interval 1.01–3.40, p = 0.045; table 3), indicating that the odds of having low vision-related QoL is almost twice as high for patients with INO compared to patients without. Similar effect sizes were shown with adjustments for sex, disease duration, and EDSS score (table 3). A similar pattern was found for the subdomain role difficulties. For the subdomain driving, there was an increase in effect size after adjustments. The effect of the presence of an INO on the distance activities score was not significant and the effect size decreased after adjustments (table 3). These findings were independent from direction or severity (VDI level) of the INO.
Table 3.
Results of vision-related quality of life
Discussion
This study introduces a systematic, quantitative, infrared oculography approach for definition of an INO in MS. The data are based on the validated DEMoNS protocol suitable for a multicenter setting with excellent levels of reproducibility (intraclass correlation coefficients >0.9) for the VDI parameters used in this study.17 The systematic assessment of a range of parameters shows that the VDI AUC and VDI Pv/Am are new and robust measures for determining an INO. The found prevalence of 34% implies that there are enough patients with an INO in MS to use INO as a well-defined model for testing treatment strategies.
The VDI AUC was developed against the theoretical background of the ocular dysconjugacy in INO. This consists of the primary delay in adduction, the overshoot of the abducting eye, and the subsequent converging eye movement for achieving an aligned fixation (or nonaligned if adduction is limited). With the VDI AUC, we tried to describe as many aspects of this pathologic saccadic movement as possible since it describes the accumulated effects of all 3 types of dysconjugacy. The VDI peak velocity is mostly described in the literature2–4 and resulted in comparable results regarding specificity and sensitivity as the VDI AUC.
At first glance it may seem that the VDI peak velocity, on which we and others reported before,2–4,18 already covers the essential pathologic feature (adduction delay). The limitation is that the VDI peak velocity considers one moment in time. At second glance, the VDI Pv/Am has the advantage of describing the main sequence relationship of saccades. The VDI Pv/Am therefore provides a purer description of the difference of saccadic behavior between the 2 eyes compared to the VDI peak velocity. The VDI Pv/Am is also less vulnerable to artifacts because of the elimination of small-amplitude differences between the different saccades and small calibration differences between eyes. We have found that adding the VDI Pv/Am parameter to the detection with the VDI AUC resulted in an increased percentage of VDIs above the thresholds, with only a minor decrement in specificity. This is probably because these 2 parameters describe distinct features of INOs, which was supported by our VDI comparison. Furthermore, when investigating a conjoined INO detection in which both VDI AUC15 and VDI Pv/Am15 have to surpass their threshold (14% of VDIs, data not shown), the resulting specificity in our dataset was 100% (no HC classified as INO). Therefore, we think this detection could be considered if a higher level of specificity is desirable. The VDI peak acceleration, although theoretically sound, discriminates less presumably to higher variability both in HCs and patients with MS. We would be hesitant to recommend using the VDI FPA, as hypometric saccades cannot be used for the calculation of this parameter.
Previous studies reporting prevalence of INO in MS are sparse; the described prevalence values are between 24% and 55%.19–22 However, these studies are based on clinical examinations, outdated techniques, small sample sizes, and/or populations that are not well described. In our study, we found an increasing prevalence with a longer disease duration and higher EDSS scores in patients with MS, which indicates that INO prevalence depends on the specific characteristics of the MS population that is investigated in a study.
In previous studies, z scores based on HCs were used for determining the threshold of INO detection.4,5 Our approach was in essence similar, because we also based our threshold on a healthy control population. However, we did not choose a predefined z score but looked at different high-specificity levels to the corresponding sensitivity. This approach enables direct comparison of different VDI parameters and thresholds. For almost every VDI parameter, the highest combination of sensitivity and specificity was found at a specificity level of 0.983, which corresponds to a z score of 2.12. Designing cutoff points based on continuous parameters risks losing more detailed information as it is reductionistic. More in-depth physiologic studies, such as a “physiologic INO” and aging-related phenomena, will benefit from the use of the more detailed data presented in figure 2. More important, other centers are strongly advised to establish and validate their own cutoff values when making use of our approach. Various devices, even of the same manufacturer and setups, can result in relevant differences in parameters.17
As abducting saccades are slightly faster and larger than adducting saccades in most HCs, the mean VDI is expected to lie just above unity.23 However, it has been shown that not all recording techniques are able to pick up this subtle asymmetry to the same extent, as is especially the case for electro-oculography.2,4,24,25 This study shows that high-frequency infrared oculography is capable of detecting these small intraocular differences.
Even though infrared oculography devices are increasingly commercially available, the costs of high-frequency devices such as the EyeLink are one limitation of this technique. Furthermore, some expertise is required in measurement and analysis. Our analyst performing the measurements experienced a learning curve for performing the measurement in our center, especially for problem-solving during the calibration procedure. In addition, the development of a measurement protocol and software routines for data analysis can provide even more challenging obstacles. Therefore, we have made all of our measurement and analysis protocols available as open source (protocols.io). Lastly, an important limitation of the infrared oculography technique is that the measurement is unreliable if patients cannot properly fixate the target during the calibration procedure. This can occur, for example, in patients with a nystagmus or with substantial ocular motor paresis. In these cases, the magnetic search coil technique26,27 is still preferred. In our study, 4 such patients were excluded based on quality-control criteria.
Visual complaints and vision-related QoL in patients with MS who have INO have rarely been described in detail before. A difficulty is that visual complaints in MS may have various causes apart from oculomotor problems. However, this study shows that despite a similar prevalence of MSON in both groups, patients with INO do have more visual complaints influencing daily functioning than patients without INO, independent of disease duration and (physical) disability. We think that detecting (subclinical) INO with infrared oculography can aid in clarifying misunderstood visual complaints in patients with MS. More insight can be gained from longitudinal assessments. This will be relevant for interrogating the relevance of changes over time on presence and severity of patients' symptoms. Finally, our results are in line with other studies that showed a relationship between eye movement abnormalities and disease severity. Therefore, longitudinal data will permit testing of the prognostic relevance of an INO on a whole range of clinometric relevant variables.21,22,28
Furthermore, because the neuroanatomy of INO is clearly described, quantification of presence and severity of INO can provide an opportunity to link neuroradiologic abnormalities to specific clinical disabilities in MS. Moreover, eye movement measures in patients with INO could serve as a surrogate outcome measure for nerve conduction in the MLF in therapeutic trials. A case study in 2014 and a recent placebo-controlled study showed that fampridine decreases the adduction delay in patients with MS and INO, measured with high-frequency infrared oculography.29,30
Because of the ease of measurement and the shown response to therapy, INO is a promising model for testing remyelination strategies in MS clinical trials. For such future trials, this systematic infrared oculography approach, using our accurate and quantitative outcome measures, may be of value.
Glossary
- Am
saccadic amplitude
- AUC
area under the curve
- DEMoNS
Demonstrate Eye Movement Networks with Saccades
- EDSS
Expanded Disability Status Scale
- FPA
first-pass amplitude
- HC
healthy control
- HCVA
high-contrast visual acuity
- INO
internuclear ophthalmoplegia
- IQR
interquartile range
- LCVA
low-contrast visual acuity
- MLF
medial longitudinal fasciculus
- MS
multiple sclerosis
- MSON
multiple sclerosis–associated optic neuritis
- Pv
peak velocity
- QoL
quality of life
- ROC
receiver operating characteristic
- RR
relapsing-remitting
- VDI
versional dysconjugacy index
Appendix. Author contributions


Footnotes
Editorial, page 929
Study funding
No targeted funding reported.
Disclosure
J. Nij Bijvank and L. van Rijn report no disclosures relevant to the manuscript. L. Balk reports that the Amsterdam MS Center received research support from TEVA. H. Tan reports no disclosures relevant to the manuscript. B. Uitdehaag has received consultancy fees from Biogen Idec, Genzyme, Merck Serono, Novartis, Roche, and TEVA. A. Petzold is a member of the steering committee for the OCTiMS study (Novartis), no consulting fees, and performs OCT QC for the Passos study (Novartis), receives consulting fees. Go to Neurology.org/N for full disclosures.
References
- 1.Frohman TC, Frohman EM, O'Suilleabhain P, et al. Accuracy of clinical detection of INO in MS: corroboration with quantitative infrared oculography. Neurology 2003;61:848–850. [DOI] [PubMed] [Google Scholar]
- 2.Ventre J, Vighetto A, Bailly G, Prablanc C. Saccade metrics in multiple sclerosis: versional velocity disconjugacy as the best clue? J Neurol Sci 1991;102:144–149. [DOI] [PubMed] [Google Scholar]
- 3.Flipse JP, Straathof CSM, van der Steen J, et al. Binocular saccadic eye movements in multiple sclerosis. J Neurol Sci 1997;148:53–65. [DOI] [PubMed] [Google Scholar]
- 4.Frohman EM, Frohman TC, O'Suilleabhain P, et al. Quantitative oculographic characterisation of internuclear ophthalmoparesis in multiple sclerosis: the versional dysconjugacy index Z score. J Neurol Neurosurg Psychiatry 2002;73:51–55. [DOI] [PMC free article] [PubMed] [Google Scholar]
- 5.Frohman EM, O'Suilleabhain P, Dewey RB, Frohman TC, Kramer PD. A new measure of dysconjugacy in INO: the first-pass amplitude. J Neurol Sci 2003;210:65–71. [DOI] [PubMed] [Google Scholar]
- 6.Eijlers AJ, Meijer KA, Wassenaar TM, et al. Increased default-mode network centrality in cognitively impaired multiple sclerosis patients. Neurology 2017;88:952–960. [DOI] [PubMed] [Google Scholar]
- 7.Schoonheim MM, Hulst HE, Brandt RB, et al. Thalamus structure and function determine severity of cognitive impairment in multiple sclerosis. Neurology 2015;84:776–783. [DOI] [PubMed] [Google Scholar]
- 8.Steenwijk MD, Geurts JJ, Daams M, et al. Cortical atrophy patterns in multiple sclerosis are non-random and clinically relevant. Brain 2016;139:115–126. [DOI] [PubMed] [Google Scholar]
- 9.Polman CH, Reingold SC, Banwell B, et al. Diagnostic criteria for multiple sclerosis: 2010 revisions to the McDonald criteria. Ann Neurol 2011;69:293–302. [DOI] [PMC free article] [PubMed] [Google Scholar]
- 10.Lublin FD, Reingold SC. Defining the clinical course of multiple sclerosis: results of an international survey. National Multiple Sclerosis Society (USA) Advisory Committee on Clinical Trials of New Agents in Multiple Sclerosis. Neurology 1996;46:907–911. [DOI] [PubMed] [Google Scholar]
- 11.Kurtzke JF. Rating neurological impairment in multiple sclerosis: an Expanded Disability Status Scale (EDSS). Neurology 1983;33:1444–1452. [DOI] [PubMed] [Google Scholar]
- 12.Roxburgh RH, Seaman SR, Masterman T, et al. Multiple Sclerosis Severity Score: using disability and disease duration to rate disease severity. Neurology 2005;64:1144–1151. [DOI] [PubMed] [Google Scholar]
- 13.Petzold A, Wattjes MP, Costello F, et al. The investigation of acute optic neuritis: a review and proposed protocol. Nat Rev Neurol 2014;10:447–458. [DOI] [PubMed] [Google Scholar]
- 14.Balcer LJ, Baier ML, Cohen JA, et al. Contrast letter acuity as a visual component for the Multiple Sclerosis Functional Composite. Neurology 2003;61:1367–1373. [DOI] [PubMed] [Google Scholar]
- 15.Mangione CM, Lee PP, Gutierrez PR, Spritzer K, Berry S, Hays RD. Development of the 25-item National Eye Institute Visual Function Questionnaire. Arch Ophthalmol 2001;119:1050–1058. [DOI] [PubMed] [Google Scholar]
- 16.Noble J, Forooghian F, Sproule M, Westall C, O'Connor P. Utility of the National Eye Institute VFQ-25 questionnaire in a heterogeneous group of multiple sclerosis patients. Am J Ophthalmol 2006;142:464–468. [DOI] [PubMed] [Google Scholar]
- 17.Nij Bijvank JA, Petzold A, Balk LJ, et al. A standardized protocol for quantification of saccadic eye movements: DEMoNS. PLoS One 2018;13:e0200695. [DOI] [PMC free article] [PubMed] [Google Scholar]
- 18.Nij Bijvank JA, Balk LJ, Tan HS, Uitdehaag BM, van Rijn LJ, Petzold A. A rare cause for visual symptoms in multiple sclerosis: posterior internuclear ophthalmoplegia of Lutz, a historical misnomer. J Neurol 2017;264:600–602. [DOI] [PubMed] [Google Scholar]
- 19.Müri RM, Meienberg O. The clinical spectrum of internuclear ophthalmoplegia in multiple sclerosis. Arch Neurol 1985;42:851–855. [DOI] [PubMed] [Google Scholar]
- 20.Jozefowicz-Korczynska M, Lukomski M, Pajor A. Identification of internuclear ophthalmoplegia signs in multiple sclerosis patients: saccade test analysis. J Neurol 2008;255:1006–1011. [DOI] [PubMed] [Google Scholar]
- 21.Downey DL, Stahl JS, Asiri RB, et al. Saccadic and vestibular abnormalities in multiple sclerosis. Ann NY Acad Sci 2002;956:438–440. [DOI] [PubMed] [Google Scholar]
- 22.Serra A, Derwenskus J, Downey DL, Leigh RJ. Role of eye movement examination and subjective visual vertical in clinical evaluation of multiple sclerosis. J Neurol 2003;250:569–575. [DOI] [PubMed] [Google Scholar]
- 23.Collewijn H, Erkelens J, Steinman RM. Binocular co-ordination of human horizontal saccadic eye movements. J Physiol 1988;440:157–182. [DOI] [PMC free article] [PubMed] [Google Scholar]
- 24.Meienberg O, Müri R, Rabineau PA. Clinical and oculographic examinations of saccadic eye movements in the diagnosis of multiple sclerosis. Arch Neurol 1986;43:438–443. [DOI] [PubMed] [Google Scholar]
- 25.Boghen D, Troost BT, Daroff L, Dell'Osso LF, Birkett JE. Velocity characteristic of normal human saccades. Invest Ophthalmol Vis Sci 1974;13:619–623. [PubMed] [Google Scholar]
- 26.Robinson DA. A method of measuring eye movement using a scleral search coil in a magnetic field. IEEE Trans Biomed Eng 1963;10:137–145. [DOI] [PubMed] [Google Scholar]
- 27.Collewijn H, Van der Steen J, Ferman L, Jansen TC. Human ocular counterroll: assessment of static and dynamic properties from electromagnetic scleral coil recordings. Exp Brain Res 1985;59:185–196. [DOI] [PubMed] [Google Scholar]
- 28.Derwenskus J, Rucker JC, Serra A, et al. Abnormal eye movements predict disability in MS: two-year follow-up. Ann NY Acad Sci 2005;1039:521–523. [DOI] [PubMed] [Google Scholar]
- 29.Kanhai MS, Nij Bijvank JA, Wagenaar YL, Klaassen ES, Lim K, Bergheanu SC, et al. Treatment of internuclear ophthalmoparesis in multiple sclerosis with fampridine: A randomized double-blind, placebo-controlled cross-over trial. CNS Neurosci Ther. February 12, 2019. [Epub ahead of print]. Doi: 10.1111/cns.13096. [DOI] [PMC free article] [PubMed] [Google Scholar]
- 30.Serra A, Skelly MM, Jacobs JB, Walker MF, Cohen JA. Improvement of internuclear ophthalmoparesis in multiple sclerosis with dalfampridine. Neurology 2014;83:192–194. [DOI] [PMC free article] [PubMed] [Google Scholar]
Associated Data
This section collects any data citations, data availability statements, or supplementary materials included in this article.
Data Availability Statement
Anonymized, General Data Protection Regulation–compliant data can be shared by request from qualified investigators. The protocol for measurement and analysis of eye movements is available from Protocols.io.


