Abstract
Objective
To determine whether quantitative EEG (QEEG) features predict neurologic outcomes in children after cardiac arrest.
Methods
We performed a single-center prospective observational study of 87 consecutive children resuscitated and admitted to the pediatric intensive care unit after cardiac arrest. Full-array conventional EEG data were obtained as part of clinical management. We computed 8 QEEG features from 5-minute epochs every hour after return of circulation. We developed predictive models utilizing random forest classifiers trained on patient age and 8 QEEG features to predict outcome. The features included SD of each EEG channel, normalized band power in alpha, beta, theta, delta, and gamma wave frequencies, line length, and regularity function scores. We measured outcomes using Pediatric Cerebral Performance Category (PCPC) scores. We evaluated the models using 5-fold cross-validation and 1,000 bootstrap samples.
Results
The best performing model had a 5-fold cross-validation accuracy of 0.8 (0.88 area under the receiver operating characteristic curve). It had a positive predictive value of 0.79 and a sensitivity of 0.84 in predicting patients with favorable outcomes (PCPC score of 1–3). It had a negative predictive value of 0.8 and a specificity of 0.75 in predicting patients with unfavorable outcomes (PCPC score of 4–6). The model also identified the relative importance of each feature. Analyses using only frontal electrodes did not differ in prediction performance compared to analyses using all electrodes.
Conclusions
QEEG features can standardize EEG interpretation and predict neurologic outcomes in children after cardiac arrest.
More than 10,000 children in the United States experience a cardiac arrest annually.1–3 Following return of circulation, accurate and timely neuroprognostication is critical in making management decisions.4–6 Clinical and resuscitation variables may not optimally predict neurobehavioral outcomes since they do not directly assess brain function.7–10 EEG data can be obtained noninvasively at the bedside and provide a standardized brain activity assessment, which may be useful in delineating the extent of brain injury.11,12 When neurologists and intensivists predicted neurobehavioral outcomes from cardiac arrest cases, the addition of EEG data significantly improved prognostication accuracy.13 Current practice involves EEG review by an electroencephalographer, and several EEG features have been associated with gross neurologic outcome at hospital discharge in children after cardiac arrest.13–26 However, since visual EEG interpretation relies on qualitative interpretations by electroencephalographers, inter-rater agreement limitations12,25–27 may influence EEG-based neuroprognostication.12,25–27
Quantitative EEG (QEEG) analyses use computationally derived features that highlight specific components of EEG with numerical values.28 Thus, QEEG analyses circumvent inter-rater variability limitations and provide a more objective method for stratifying brain injury severity. This may be helpful for clinical trials, acute treatment decisions, and neuroprognostication. In addition, QEEG features can extrapolate long-term trends29 that may not be identified by an electroencephalographer. With further development, QEEG analyses could be used by bedside caregivers, thereby potentially serving as a widely implementable neuromonitoring tool. QEEG features are associated with outcome after cardiac arrest in adults,28–30 but similar studies have not been conducted in children. Since the characteristics of cardiac arrest, EEG, and outcomes are age-dependent, studies of QEEG are necessary in children. In this study, we present a machine learning algorithm that uses QEEG features to predict neurologic outcomes in children resuscitated after cardiac arrest.
Methods
Standard protocol approvals, registrations, and patient consents
This study was approved by the Institutional Review Board at the Children's Hospital of Philadelphia. We obtained written informed consent for each participant.
Cardiac arrest database
This was a prospective study of consecutive infants and children treated in the pediatric intensive care unit of a single tertiary care referral hospital between September 2012 and February 2016. Clinical practice at our institution was to perform continuous EEG monitoring in all encephalopathic patients resuscitated after cardiac arrest to identify electroencephalographic seizures, consistent with recent guidelines and consensus statements.31,32 EEG monitoring was initiated urgently and performed with a portable bedside Grass-Telefactor video-EEG system using 21 gold-over-silver scalp surface electrodes positioned according to the international 10–20 system and affixed with collodion adhesive. EEG data were deidentified and full-length tracings were saved for research purposes.
Study data consisted of prospectively defined demographic, cardiac arrest, resuscitation, postcardiac arrest care, EEG, and neurologic outcome variables. Data were collected prospectively using an electronic case report form in Research Electronic Data Capture (REDCap), a web-based electronic data application.33
We assessed outcomes at discharge from the pediatric intensive care unit by chart review using Pediatric Cerebral Performance Category (PCPC) scores. The PCPC is a validated 6-point scale that categorizes degrees of functional impairment (1 = normal, 2 = mild disability, 3 = moderate disability, 4 = severe disability, 5 = coma and vegetative state, and 6 = death).34 Unfavorable neurologic outcome was defined broadly as PCPC scores of 4–6, and not only death (PCPC score = 6), to reduce the influence of family decisions regarding withdrawal of technological support on outcome categorization. A patient's outcome would be categorized as unfavorable whether a family chose to withdraw or continue technological support of a child with severe neurologic injury.
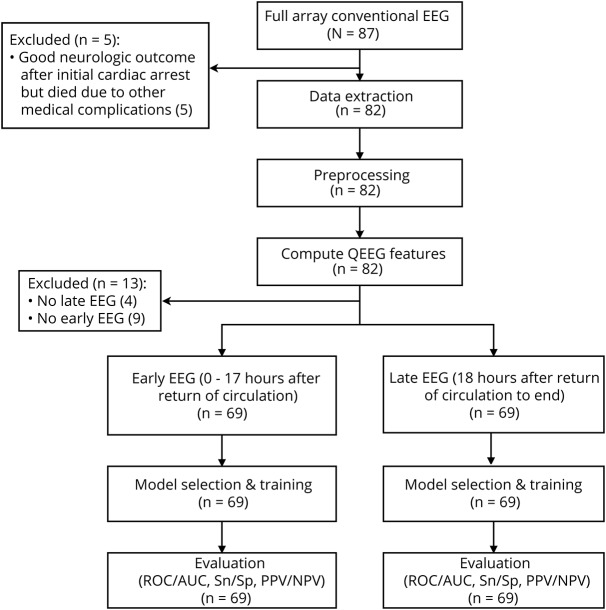
We enrolled 87 consecutive patients. We excluded 5 patients who had good neurologic outcome soon after the cardiac arrest but subsequently died due to medical complications unrelated to their initial cardiac arrest (figure 1). We also excluded 9 patients who did not have early EEG recordings and 4 patients who did not have late EEG recordings. Thus, 69 patients were included for analysis (figure 1).
Figure 1. Workflow of data collection and analysis.
AUC = area under the receiver operating characteristic curve; NPV = negative predictive value; PPV = positive predictive value; QEEG = quantitative EEG; ROC = receiver operating characteristic.
Statistical analyses comparing demographic and clinical data were performed using Stata 15.0 (College Station, TX). We report summary statistics as medians and interquartile ranges for continuous variables and counts and proportions for categorical variables. We examined the association of each variable with neurologic outcome using χ2 or Fisher exact tests for categorical variables and Wilcoxon signed rank test or Kruskal-Wallis tests for continuous variables.
EEG data extraction and preprocessing
Due to the data recording methods, we did not have continuous data for all patients across all time points. Therefore, we selected 5-minute EEG epochs from every hour of EEG available. The selected 5-minute EEG epochs were filtered and tested for artifacts using a MATLAB script. The signal filtering process was done by first using a 6th order Butterworth bandpass filter35,36 between 0.1 and 50 Hz. The signals were then filtered with a 60 Hz notch filter to ensure removal of the 60 Hz power line artifact.37,38 We checked the filtered signals for artifacts using the following steps. We calculated EEG channel SDs for all channels across all 5-minute epochs for all patients. Statistical outliers, defined as values that were more than 3 median absolute deviations away from the median,39 were calculated for the computed SDs through all the 5-minute epochs to identify artifacts. If any of the epochs contained artifacts, then the 5-minute window was shifted until there was a window within the given hour without artifacts. If there were no windows within the hour that were artifact-free, then no epoch was selected from that hour. An electroencephalographer visually inspected and validated all EEG clips to ensure correct preprocessing.
QEEG features
We computed 8 QEEG features: SD of each channel in the 5-minute epochs, normalized band power in alpha, beta, theta, delta, and gamma wave frequencies, line length, and regularity function scores.28 Feature selection was clinically motivated and was intended to capture voltage, spectrographic characteristics, and trace discontinuity. All features were computed per channel from 5-minute epochs from every hour of EEG available.
SD was used as a feature to illustrate the variance of the signal. Spectrographic features of the EEG were captured using the normalized band power values of delta (0.5–3 Hz), theta (4–7 Hz), alpha (8–12 Hz), beta (13–30 Hz), and gamma (25–50 Hz) waves.29,40 The band power in each frequency range was first computed and then normalized with respect to the total power of the 5-minute epoch. The band powers were normalized in this manner because their relative ratios and the variability in ratios to the total EEG power are considered important in clinical practice.41 Line length, which is the sum of all absolute distances between consecutive points,42 was used to depict overall voltage and continuity. Line length is a running window measure of the path-dependent distance traced out by the EEG signal. Regularity function scores capture patterns of discontinuity in an EEG signal. The regularity function28 outputs a value between 0 and 1 where a higher value corresponds to a signal with a more regular amplitude. In addition to the QEEG features, patient age was added as a feature because age plays a critical role in assessing pediatric EEGs.
Early and late EEGs
For all 5-minute epochs, the 8 QEEG features were computed for each channel and then averaged across all channels. All QEEG features were then averaged across early (0–17 hours after return of circulation) and late (18 hours–end after return of circulation) EEG recordings to determine the predictive ability power of early vs late EEG data.
Model selection and training
The feature matrix formed to train the classifiers had 69 samples with 9 features each. The labels were binary outcomes (favorable or unfavorable neurologic outcomes). We trained logistic regression, support vector machine, and random forest classifiers. We used the random forest classifier to classify the EEG features given its robustness and interpretability.43
Model evaluation
We used 5-fold cross-validation to examine the performance of the 3 machine learning classifiers. To evaluate model performance, we computed receiver operating characteristic (ROC) curves, area under the ROC curve (AUROC), accuracy, sensitivity, specificity, positive predictive value (PPV), and negative predictive value (NPV). For all models, we also calculated 95% confidence intervals (CIs) for accuracies and AUROC values based on 1,000 bootstrapped samples.
Data availability statement
Anonymized data not published within this article can be made available to qualified investigators upon request to the corresponding author.
Results
Patient demographics
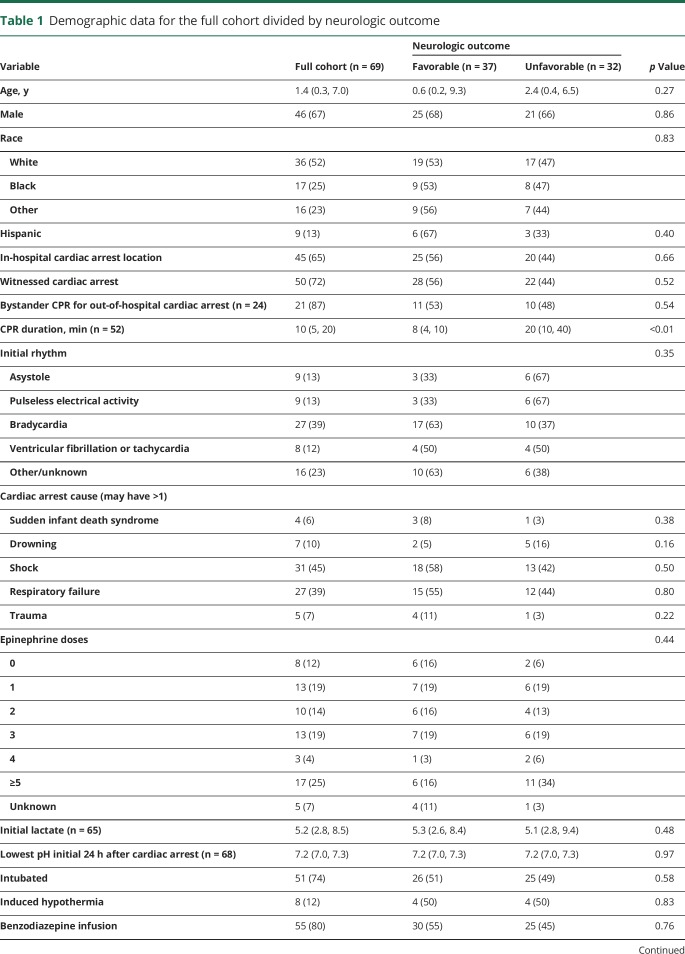
Table 1 provides demographic data. Thirty-seven (54%) patients had favorable outcomes (PCPC 1–3) and 32 (46%) patients had unfavorable outcomes (PCPC 4–6).
Table 1.
Demographic data for the full cohort divided by neurologic outcome
Model performance
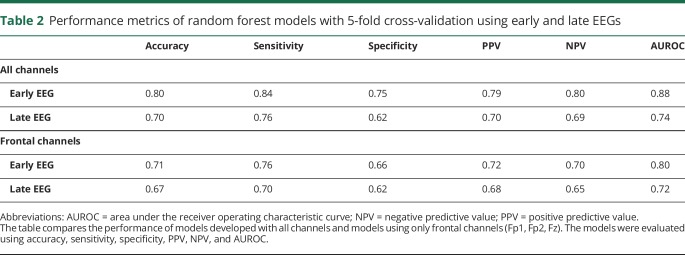
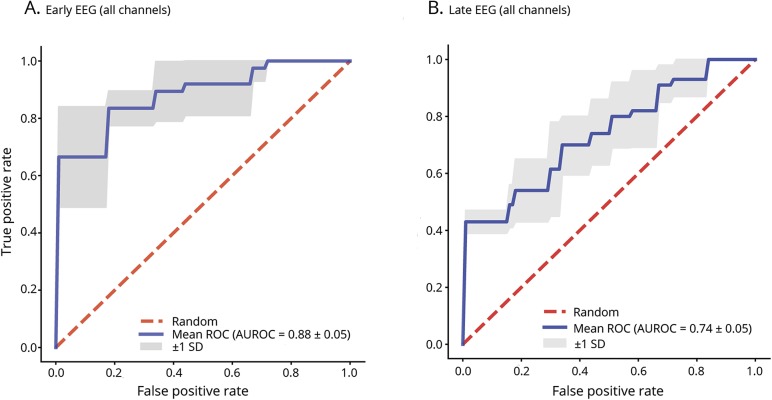
Table 2 provides the test characteristics (accuracy, sensitivity, specificity, PPV, NPV, and AUROC values) for the early and late EEG random forest models with 5-fold cross-validation. Figure 2 provides the ROC curves for the early and late EEG random forest models with 5-fold cross-validation. The ROC curve is a plot of the algorithm's sensitivity vs false-positive rate (1 − specificity) for different cutoff values at which the algorithm assigns outcomes. The AUROC is representative of the algorithm's utility for clinical decision-making. If the area is close to 1.0, then its discrimination is excellent. If the area is near 0.5, then its ability to discriminate between binary outcomes is close to chance. Early EEGs showed better results than late EEGs across all performance metrics, but the differences were not statistically significant. The random forest model could predict clinical outcomes based on early QEEG features with an accuracy of 0.80, sensitivity of 0.84, specificity of 0.75, PPV of 0.79, NPV of 0.80, and AUROC of 0.88. The random forest model could predict clinical outcomes based on late QEEG features with an accuracy of 0.70, sensitivity of 0.76, specificity of 0.62, PPV of 0.70, NPV of 0.69, and AUROC of 0.74.
Table 2.
Performance metrics of random forest models with 5-fold cross-validation using early and late EEGs
Figure 2. Receiver operating characteristic curves (ROC) and area under the receiver operating characteristic curves (AUROC).
Mean ROC and AUROC values for random forest model with 5-fold cross-validation predicting neurologic outcome in (A) early and (B) late EEG using all channels.
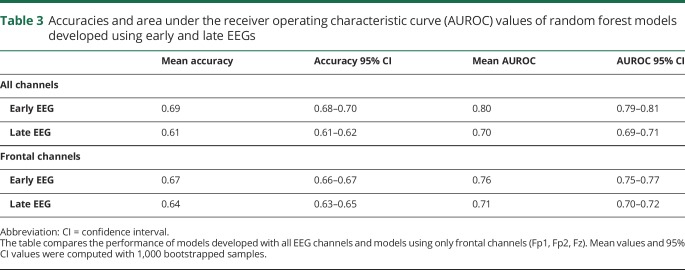
To better understand the generalizability of the models, 1,000 bootstrapped samples were used to compute the 95% CIs for the accuracies and AUROC values (table 3). The random forest model for early EEG had a mean accuracy of 0.69 (95% CI 0.68–0.70), and the mean AUROC was 0.80 (95% CI 0.79–0.81). For late EEG, the mean accuracy was 0.61 (95% CI 0.61–0.62), and the mean AUROC was 0.70 (95% CI 0.69–0.71).
Table 3.
Accuracies and area under the receiver operating characteristic curve (AUROC) values of random forest models developed using early and late EEGs
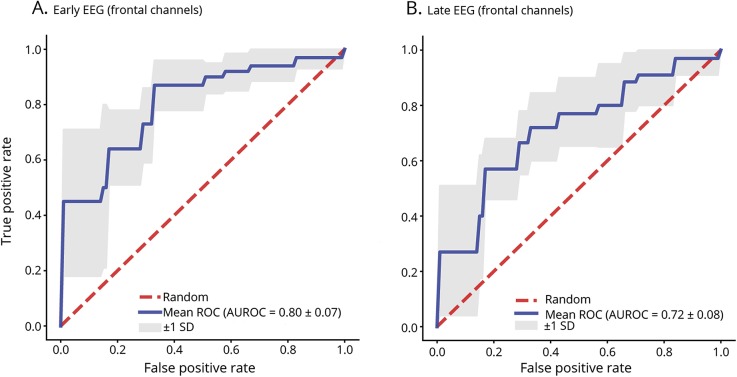
Since limited montage EEG can be obtained more easily than full-array EEG, we evaluated random forest models using only frontal electrodes (Fp1, Fp2, Fz) in the same manner as models built using all EEG channels. The random forest model using early QEEG features performed better than the random forest model using late EEG features across all performance metrics, but the differences were not statically significant. The random forest model with 5-fold cross-validation using early QEEG features from frontal electrodes had an accuracy of 0.71, sensitivity of 0.76, specificity of 0.66, PPV of 0.72, NPV of 0.70, and AUROC of 0.80. The random forest model using late QEEG features from the frontal electrodes had an accuracy of 0.67, sensitivity of 0.70, specificity of 0.62, PPV of 0.68, NPV of 0.65, and AUROC of 0.72. Figure 3 depicts ROC curves for early and late EEG random forest models with 5-fold cross-validation using only frontal electrodes.
Figure 3. Receiver operating characteristic curves (ROC) and area under the receiver operating characteristic curves (AUROC).
Mean ROC and AUROC values for random forest model with 5-fold cross-validation predicting neurologic outcome in (A) early and (B) late EEG using only frontal channels (Fp1, Fp2, Fz).
We computed 95% CIs for the accuracies and the AUROC values of the models using only frontal electrodes using 1,000 bootstrapped samples (table 3). The random forest model for early EEG using frontal electrodes had a mean accuracy of 0.67 (95% CI 0.66–0.67) and a mean AUROC of 0.76 (95% CI 0.75–0.77). The late EEG model using frontal electrodes had a mean accuracy of 0.64 (95% CI 0.63–0.65) and a mean AUROC of 0.71 (95% CI 0.70–0.72).
Feature significance
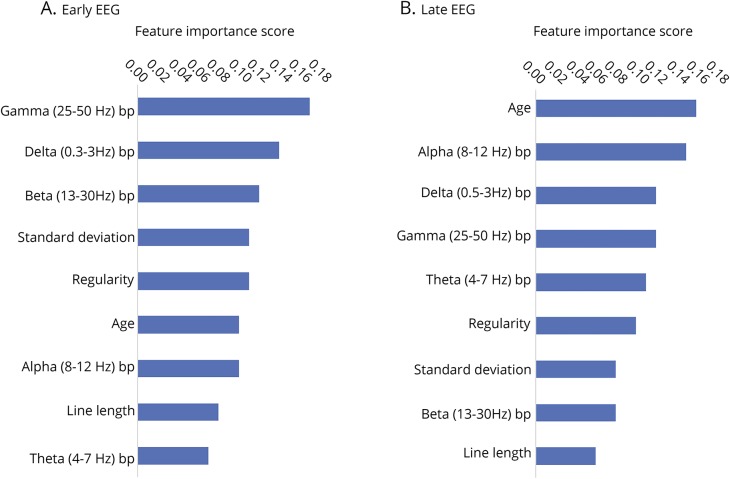
Feature significance was evaluated using Gini importance.44 The reported scores range from 0 to 1, in which higher scores indicate more important features. Figure 4 reports the features importance scores. For the early EEG model, the most important features were gamma band power, delta band power, and beta band power. For the late EEG model, the most important features were age, alpha band power, and delta band power.
Figure 4. Feature importance scores of random forest models.
Feature importance scores of random forest models for (A) early EEG data and (B) late EEG data. Scores were evaluated using Gini importance.44 Features scores range from 0 to 1 and higher scores indicate more important features. Bp = band power.
Discussion
We used random forest models to identify multiple QEEG features that are predictive of neurologic outcome in children after cardiac arrest. When predicting outcomes, the worst mistake would be to incorrectly predict an unfavorable outcome, leading to withdrawal of technological support in a patient who might have had a favorable outcome. Thus, a model predicting unfavorable outcomes aims to minimize false-positives and thereby achieve high specificity. The random forest model that best predicted unfavorable neurologic outcome used all electrodes and early QEEG features, and it had a specificity of 0.75 and PPV of 0.79. Since these are imperfect, the model should not be used in isolation when guiding clinical decision-making. However, these data suggest that multimodal models are likely to benefit from inclusion of QEEG data.
Predictive performance was compared between early and late EEGs. The selected cutoffs for early and late EEGs maximized the number of patients included in the data analysis because patients who did not have both early and late EEG recordings were excluded. Early EEGs showed better results than late EEGs across all performance metrics. However, the difference in model performance between early and late EEGs was not statistically significant. Nevertheless, these results are consistent with a previous QEEG study in adults that indicated that the predictive value of EEG is highest at 12–24 hours after cardiac arrest.28 This is a promising avenue of investigation because early EEG features can be reliably used for neuroprognostication during the acute stages when interventions may be most efficacious. This early ability to predict outcome may also be useful for stratifying patients soon after cardiac arrest for future neuroprotection studies.
Considering the small sample size (69 samples with 9 features each), logistic regression was fitted on the dataset for its simplicity, efficiency, and robustness to noise.45 A support vector machine was then trained on the same data because it is more flexible than logistic regression and allows for kernels that are nonlinear.46 A third classifier, the random forest, was used because ensemble methods perform with the highest accuracy for many datasets, and is commonly used for medical applications.43 Of the 3 machine learning classifiers, the random forest classifier had the best performance based on 5-fold cross-validation, and thus it was used to classify the features.
For our main analyses, QEEG features were averaged across all channels because there were no clinically significant differences in performance between channels. However, since hypoxic–ischemic brain injury is diffuse, we hypothesized that a limited set of frontal channels might yield similar test characteristics. The finding that the performance of the models using only the frontal channels was comparable to the performance of the models using all channels (tables 2 and 3) implies that the model can be implemented using EEG data just from the frontal EEG channels (Fp1, Fp2, Fz), which might be more feasibly obtained soon after cardiac arrest than a full array EEG.47
While this study showed promising results, there are several limitations. First, this study had a relatively small sample size (n = 69). Therefore, we were unable to partition our data to include a holdout validation set for our model. While we used cross-validation and bootstrapping to overcome the limitations of the small sample size, these results should be validated in a larger study. Second, this study used a MATLAB script for artifact removal that is not as accurate as clinically trained neurologists. While manual EEG review is the current gold standard, independent component analysis–based algorithms could obtain EEG of improved signal quality.40 Third, this study was based only on EEG, but multimodal models also incorporating clinical features could provide a more complete understanding of the neurologic state of the patient and yield more accurate neuroprognostication. Fourth, we assessed short-term outcome using a relatively simple outcome measure. Future studies might incorporate longer-term patient-centered neurobehavioral outcomes. Fifth, clinically interpreted EEG data were known to the clinical teams and may have influenced care decisions. To reduce the influence of individual decisions regarding withdrawal of technological support on outcome categorization, we used an outcome measure that grouped death and unfavorable neurologic outcome. Thus, outcome would be categorized as unfavorable whether a family chose to withdraw or continue technological support of a child with severe neurologic injury.
There are 2 additional technical considerations. First, based on feature importance scores evaluated using Gini importance,44 line length had lower importance scores for both early and late EEG models. The line length feature was computed from 5-minute windows, which may have been too wide to capture the important details of the EEG that would have been predictive of outcome. Especially for capturing transient events such as bursts, it may be necessary to use smaller windows. One study that developed an automated burst detection method with 84% accuracy recommended using 1-second windows.42 Using a smaller moving window within the 5-minute epoch could be explored in future analyses. We did not implement a shorter time window because some EEG recordings extended up to 10 days and doing computations on 1-second windows would have made the model computationally intensive. Second, it is surprising that the normalized gamma (25–50 Hz) band power had the highest feature importance score for the early EEG model since frequencies above 25 Hz are not commonly encountered in scalp EEG.48 Frequencies in the gamma band range may be attributed to muscle and movement artifacts.40,48 The artifacts in each patient's recording should be similar since they were acquired under similar recording conditions. The frequency band powers were normalized with respect to the total power in each window so the gamma band comprising a higher proportion of the total EEG power indicates that there is relatively lower power in frequencies below 25 Hz, where most brain activity is detected. Decreased brain activity is predictive of an unfavorable outcome. Our results showed that patients who had favorable outcomes generally had higher power in the delta (0.5–3 Hz) band.
In future studies, we are interested in exploring several avenues. First, in this study the models classify patients into 2 classes (favorable or unfavorable outcomes) based on the probabilities of a patient belonging to either class. In binary classification, the class with greater than 0.5 probability is the predicted class. However, there are some patients whose probability of belonging to either class can be close to 0.5, such that predictions are made with considerably less certainty. These patients are more often misclassified, thereby reducing the predictive power of the models for such patients. Instead of binary classification, it might be beneficial to include a third class when the probabilities of a patient belonging to either class are less certain. An initial model could focus on multinomial logistic regression with 3 classes of outcomes. Second, we intend to combine clinical variables with QEEG features to build more comprehensive multimodal models. Specific clinical variables are commonly used by intensive care unit clinicians to predict outcomes in children with cardiac arrest.6 Third, employing deep learning models can also improve predictive performance. Recently, there have been studies that use deep learning with convolutional neural networks to extract information from raw EEG recordings.49,50 Deep convolutional neural networks have shown promise in decoding information from EEGs and revealing novel features that could be used in EEG analysis.50
Overall, these data provide initial evidence that QEEG features, which are standardized and may make EEG interpretation more objective for clinical decision-making, can contribute to outcome prediction in children after cardiac arrest. Further study is needed to assess the benefit of using QEEG features in the context of multimodal models for clinical trials or neuroprognostication.
Glossary
- AUROC
area under the receiver operating characteristic curve
- CI
confidence interval
- NPV
negative predictive value
- PCPC
Pediatric Cerebral Performance Category
- PPV
positive predictive value
- QEEG
quantitative EEG
- ROC
receiver operating characteristic
Appendix. Authors

Study funding
No targeted funding reported.
Disclosure
S. Lee and X. Zhao report no disclosures relevant to the manuscript. K.A. Davis is funded by NINDS K23-NS073801 (to K.A. Davis) and the Thornton Foundation. A. Topjian reports no disclosures relevant to the manuscript. B. Litt is funded by NINDS R01NS099348-01, Mirowski Family Foundation, and Neil and Barbara Smit Fund. N. Abend is funded by NINDS K02NS096058, PCORI, and EFA. Go to Neurology.org/N for full disclosures.
References
- 1.van Zellem L, Buysse C, Madderom M, et al. Long-term neuropsychological outcomes in children and adolescents after cardiac arrest. Intens Care Med 2015;41:1057–1066. [DOI] [PMC free article] [PubMed] [Google Scholar]
- 2.Abend NS, Xiao R, Kessler SK, Topjian AA. Stability of early EEG background patterns after pediatric cardiac arrest. J Clin Neurophysiol 2018;35:246–250. [DOI] [PMC free article] [PubMed] [Google Scholar]
- 3.Tress EE, Kochanek PM, Saladino RA, Manole MD. Cardiac arrest in children. J Emerg Trauma Shock 2010;3:267–272. [DOI] [PMC free article] [PubMed] [Google Scholar]
- 4.Abend NS, Licht DJ. Predicting outcome in children with hypoxic ischemic encephalopathy. Pediatr Crit Care Med 2007;8:1–8. [DOI] [PubMed] [Google Scholar]
- 5.Temple A, Porter R. Predicting neurological outcome and survival after cardiac arrest. Contin Educ Anaesth Crit Care Pain 2012;12:283–287. [Google Scholar]
- 6.Topjian AA, Sánchez SM, Shults J, Berg RA, Dlugos DJ, Abend NS. Early electroencephalographic background features predict outcomes in children resuscitated from cardiac arrest. Pediatr Crit Care Med 2016;17:547–557. [DOI] [PMC free article] [PubMed] [Google Scholar]
- 7.Abend N, Topjian A. Outcome prediction by motor and pupillary responses in children treated with therapeutic hypothermia after cardiac arrest. Pediatr Crit Care 2012;13:32–38. [DOI] [PMC free article] [PubMed] [Google Scholar]
- 8.Topjian AA, Clark AE, Casper TC, et al. Early lactate elevations following resuscitation from pediatric cardiac arrest are associated with increased mortality. Pediatr Crit Care Med 2013;14:1–15. [DOI] [PMC free article] [PubMed] [Google Scholar]
- 9.Topjian AA, French B, Sutton RM, et al. Early post-resuscitation hypotension is associated with increased mortality following pediatric cardiac arrest. Crit Care Med 2014;42:1518–1523. [DOI] [PMC free article] [PubMed] [Google Scholar]
- 10.Starling RM, Shekdar K, Licht D, Nadkarni VM, Berg RA, Topjian AA. Early head CT findings are associated with outcomes after pediatric out-of-hospital cardiac arrest. Pediatr Crit Care Med 2015;16:542–548. [DOI] [PMC free article] [PubMed] [Google Scholar]
- 11.Abend NS, Topjian A, Ichord R, et al. Electroencephalographic monitoring during hypothermia after pediatric cardiac arrest. Neurology 2009;72:1931–1940. [DOI] [PMC free article] [PubMed] [Google Scholar]
- 12.Abend NS, Massey SL, Fitzgerald M, et al. Interrater agreement of EEG interpretation after pediatric cardiac arrest using standardized critical care EEG terminology. J Clin Neurophysiol 2017;34:534–541. [DOI] [PMC free article] [PubMed] [Google Scholar]
- 13.Kirschen MP, Topjian AA, Hammond R, Illes J, Abend NS. Neuroprognostication after pediatric cardiac arrest. Pediatr Neurol 2014;51:663–668. [DOI] [PMC free article] [PubMed] [Google Scholar]
- 14.Kessler SK, Topjian AA, Gutierrez-Colina AM, et al. Short-term outcome prediction by electroencephalographic features in children treated with therapeutic hypothermia after cardiac arrest. Neurocrit Care 2011;14:37–43. [DOI] [PMC free article] [PubMed] [Google Scholar]
- 15.Ducharme-Crevier L, Press CA, Kurz JE, Mills MG, Goldstein JL, Wainwright MS. Early presence of sleep spindles on electroencephalography is associated with good outcome after pediatric cardiac arrest. Pediatr Crit Care Med 2017;18:452–460. [DOI] [PubMed] [Google Scholar]
- 16.Brooks GA, Park JT. Clinical and electroencephalographic correlates in pediatric cardiac arrest: experience at a tertiary care center. Neuropediatrics 2018;49:324–329. [DOI] [PubMed] [Google Scholar]
- 17.Pampiglione G, Harden A. Resuscitation after cardiocirculatory arrest: prognostic evaluation of early electroencephalographic findings. Lancet 1968;291:1261–1265. [DOI] [PubMed] [Google Scholar]
- 18.Pampiglione G, Chaloner J, Harden A, O'Brien J. Transitory ischemia/anoxia in young children and the prediction of quality of survival. Ann NY Acad Sci 1978;315:281–292. [DOI] [PubMed] [Google Scholar]
- 19.Tasker RC, Boyd S, Harden A, Matthew DJ. Monitoring in non-traumatic electroencephalography. Arch Dis Child 1988;63:895–899. [DOI] [PMC free article] [PubMed] [Google Scholar]
- 20.Cheliout-Heraut F, Sale-Franque F, Hubert P, Bataille J. Cerebral anoxia by near-drowning in children: relevance of electroencephalographic findings for prognosis. Neurophysiol Clin Neurophysiol 1991;21:121–132. [DOI] [PubMed] [Google Scholar]
- 21.Evans BM, Bartlett JR. Prediction of outcome in severe head injury based on recognition of sleep related activity in the polygraphic electroencephalogram. J Neurol Neurosurg Psychiatry 1995;59:17–25. [DOI] [PMC free article] [PubMed] [Google Scholar]
- 22.Mandel R, Martinot A, Delepoulle F, et al. Prediction of outcome after hypoxic-ischemic encephalopathy: a prospective clinical and electrophysiologic study. J Pediatr 2002;141:45–50. [DOI] [PubMed] [Google Scholar]
- 23.Ramachandrannair R, Sharma R, Weiss SK, Cortez MA. Reactive EEG patterns in pediatric coma. Pediatr Neurol 2005;33:345–349. [DOI] [PubMed] [Google Scholar]
- 24.Nishisaki A, Sullivan J, Steger B, et al. Retrospective analysis of the prognostic value of electroencephalography patterns obtained in pediatric in-hospital cardiac arrest survivors during three years. Pediatr Crit Care Med 2007;8:10–17. [DOI] [PubMed] [Google Scholar]
- 25.Grant AC, Abdel-Baki SG, Weedon J, et al. EEG interpretation reliability and interpreter confidence: a large single-center study. Epilepsy Behav 2014;32:102–107. [DOI] [PMC free article] [PubMed] [Google Scholar]
- 26.Abend NS, Gutierrez-Colina A, Zhao H, et al. Interobserver reproducibility of electroencephalogram interpretation in critically ill children. J Clin Neurophysiol 2011;28:15–19. [DOI] [PMC free article] [PubMed] [Google Scholar]
- 27.Mani R, Arif H, Hirsch LJ, Gerard EE, LaRoche SM. Interrater reliability of ICU EEG research terminology. J Clin Neurophysiol 2012;29:203–212. [DOI] [PubMed] [Google Scholar]
- 28.Tjepkema-Cloostermans MC, van Meulen FB, Meinsma G, van Putten MJ. A Cerebral Recovery Index (CRI) for early prognosis in patients after cardiac arrest. Crit Care 2013;17:R252. [DOI] [PMC free article] [PubMed] [Google Scholar]
- 29.Wiley SL, Razavi B, Krishnamohan P, et al. Quantitative EEG metrics differ between outcome groups and change over the first 72 h in comatose cardiac arrest patients. Neurocrit Care 2017;28:1–9. [DOI] [PubMed] [Google Scholar]
- 30.Ghassemi MM, Amorim E, Pati SB, et al. An enhanced cerebral recovery index for coma prognostication following cardiac arrest. Conf Proc IEEE Eng Med Biol Soc 2015;2015:534–537. [DOI] [PMC free article] [PubMed] [Google Scholar]
- 31.Brophy GM, Bell R, Claassen J, et al. Guidelines for the evaluation and management of status epilepticus. Neurocrit Care 2012;17:3–23. [DOI] [PubMed] [Google Scholar]
- 32.Herman ST, Abend NS, Bleck TP, et al. Consensus statement on continuous EEG in critically ill adults and children, part I: indications. J Clin Neurophysiol 2015;32:87–95. [DOI] [PMC free article] [PubMed] [Google Scholar]
- 33.Harris PA, Taylor R, Thielke R, Payne J, Gonzalez N, Conde JG. Research electronic data capture (REDCap): a metadata-driven methodology and workflow process for providing translational research informatics support. J Biomed Inform 2009;42:377–381. [DOI] [PMC free article] [PubMed] [Google Scholar]
- 34.Fiser DH, Long N, Roberson PK, Hefley G, Zolten K, Brodie-Fowler M. Relationship of Pediatric Overall Performance Category and Pediatric Cerebral Performance Category scores at pediatric intensive care unit discharge with outcome measures collected at hospital discharge and 1- and 6-month follow-up assessments. Crit Care Med 2000;28:2616–2620. [DOI] [PubMed] [Google Scholar]
- 35.Butterworth S. On the theory of filter amplifiers. Exp Wirel Wirel Eng 1930;7:536–541. [Google Scholar]
- 36.Alarcon G, Guy CN, Binnie CD. A simple algorithm for a digital three-pole Butterworth filter of arbitrary cut-off frequency: application to digital electroencephalography. J Neurosci Methods 2000;104:35–44. [DOI] [PubMed] [Google Scholar]
- 37.Teplan M. Fundamentals of EEG measurement. Meas Sci Rev 2002;2:1–11. [Google Scholar]
- 38.Sullivan TJ, Deiss SR, Cauwenberghs G. A brain–machine interface using dry-contact, low-noise EEG sensors. IEEE International Symposium on Circuits and Systems: ISCAS 2008;1986–1989. [Google Scholar]
- 39.Howell DC. Median absolute deviation. In: Encyclopedia of Statistics in Behavioral Science. Chichester: John Wiley & Sons; 2005. [Google Scholar]
- 40.Urigüen JA, Garcia-Zapirain B. EEG artifact removal-state-of-the-art and guidelines. J Neural Eng 2015;12:031001. [DOI] [PubMed] [Google Scholar]
- 41.Herman ST, Abend NS, Bleck TP, et al. Consensus statement on continuous EEG in critically ill adults and children, part II: personnel, technical specifications, and clinical practice. J Clin Neurophysiol 2015;32:96–108. [DOI] [PMC free article] [PubMed] [Google Scholar]
- 42.Koolen N, Jansen K, Vervisch J, et al. Line length as a robust method to detect high-activity events: automated burst detection in premature EEG recordings. Clin Neurophysiol 2014;125:1985–1994. [DOI] [PubMed] [Google Scholar]
- 43.Touw WG, Bayjanov JR, Overmars L, et al. Data mining in the life sciences with random forest: a walk in the park or lost in the jungle? Brief Bioinform 2013;14:315–326. [DOI] [PMC free article] [PubMed] [Google Scholar]
- 44.Breiman L, Friedman JH, Olshen RA, Stone CJ. Classification and Regression Trees. Boca Raton: Chapman and Hall/CRC; 1984. [Google Scholar]
- 45.Tu JV. Advantages and disadvantages of using artificial neural networks versus logistic regression for predicting medical outcomes. J Clin Epidemiol 1996;49:1225–1231. [DOI] [PubMed] [Google Scholar]
- 46.Cortes C, Vapnik V. Support vector networks. Mach Learn 1995;20:273–297. [Google Scholar]
- 47.Min You K, Joon Suh G, Kwon W, et al. Epileptiform discharge detection with the 4-channel frontal electroencephalography during post-resuscitation care. Resuscitation 2017;117:8–13. [DOI] [PubMed] [Google Scholar]
- 48.St Louis EK, Frey LC. Electroencephalography (EEG): an introductory. In: Text and Atlas of Normal and Abnormal Findings in Adults, Children, and Infants. Chicago: American Epilepsy Society; 2016. [PubMed] [Google Scholar]
- 49.van Putten MJAM, Hofmeijer J, Ruijter BJ, Tjepkema-Cloostermans MC. Deep learning for outcome prediction of postanoxic coma. In: Eskola H, Väisänen O, Viik J, Hyttinen J, eds. EMBEC & NBC 2017. Singapore: Springer Singapore; 2018:506–509. [Google Scholar]
- 50.Schirrmeister RT, Springenberg JT, Fiederer LDJ, et al. Deep learning with convolutional neural networks for EEG decoding and visualization. Hum Brain Mapp 2017;38:5391–5420. [DOI] [PMC free article] [PubMed] [Google Scholar]
Associated Data
This section collects any data citations, data availability statements, or supplementary materials included in this article.
Data Availability Statement
Anonymized data not published within this article can be made available to qualified investigators upon request to the corresponding author.


