

Abstract
Glaucoma is the second leading cause of blindness worldwide, often associated with elevated intraocular pressure. Connective tissue growth factor (CTGF) is a mediator of pathological effects in the trabecular meshwork (TM) and Schlemm’s canal (SC). A novel, causative therapeutic concept which involves the intracameral delivery of small interfering RNA against CTGF is proposed. Layer-by-layer coated nanoparticles of 200–260 nm with a final layer of hyaluronan (HA) are developed. The HA-coating should provide the nanoparticles sufficient mobility in the extracellular matrix and allow for binding to TM and SC cells via CD44. By screening primary TM and SC cells in vitro, in vivo, and ex vivo, the validity of the concept is confirmed. CD44 expression is elevated in glaucomatous versus healthy cells by about two-to sixfold. CD44 is significantly involved in the cellular uptake of HA-coated nanoparticles. Ex vivo organ culture of porcine, murine, and human eyes demonstrates up to threefold higher accumulation of HA compared to control nanoparticles and much better penetration into the target tissue. Gene silencing in primary human TM cells results in a significant reduction of CTGF expression. Thus, HA-coated nanoparticles combined with RNA interference may provide a potential strategy for glaucoma therapy.
Keywords: glaucoma, hyaluronan, layer-by-layer, nanoparticle, siRNA
1. Introduction
Glaucoma, a neurodegenerative disease of the optic nerve, is one of the leading causes of blindness.[1] It is estimated that about 111.8 million people will be affected worldwide by 2040. Among various subtypes, primary open angle glaucoma (POAG) is the most common form.[2] Intraocular pressure (IOP) was identified as a critical risk factor for the pathogenesis of POAG.[3] Current medications are topical, decreasing the IOP by having patients self-administer eye drops which have a long list of drawbacks such as poor compliance and inadequate application by patients, poor bioavailability, and systemic side effects.[4,5] In addition, currently available eye drops do not tackle the origins of disease and thereby fail to prevent the initial cause of pathologic changes. Consequently, new causative therapeutic concepts are of utmost importance. Causative treatment of ocular disorders may be realized by viral and nonviral gene therapy approaches,[6,7] which have demonstrated to specifically deliver functional or reporter genes, for example, to the retina[8,9] and even allow for a prolonged effect as demonstrated for gene delivery to the corneal epithelium.[10]
The IOP is generated in the anterior chamber of the eye by the resistance to drainage of the aqueous humor through the trabecular meshwork (TM) and inner wall of Schlemm’s canal (SC) (Scheme 1A).[11] A significant change in the quality and amount of extracellular matrix (ECM) together with enhanced contractility of TM and SC cells contribute to an increase of the IOP beyond the physiological level.[12,13] We recently identified connective tissue growth factor (CTGF) as a vital mediator of the pathological effects responsible for increased resistance to outflow in POAG.[14,15] Hence, we speculate that a reduction of CTGF would achieve a more permanent and causative effect in regulating the IOP compared to available standard treatment regimes.
Scheme 1.

Strategy for delivering nanoparticles to cells of the trabecular meshwork (TM) and Schlemm’s canal (SC). A) Aqueous humor (dashed red line) is secreted by the ciliary epithelium and flows from the posterior chamber to the anterior chamber and is finally drained via the TM and SC into the episcleral veins. Nanoparticles will be injected into the anterior chamber of the eye and are predicted to follow the natural trabecular outflow pathway. B) Magnified schematic drawing of the trabecular outflow pathway illustrating corneoscleral, juxtacanalicular (JCT) TM and inner endothelial wall of SC. Nanoparticles are envisioned to target TM cells of the JCT and endothelial cells of SC via the CD44 receptor. C) Schematic drawing of LBL-assembled nanoparticles applied in this study: poly(D,L-lactide-co-glycolide) (PLGA) nanoparticles are stabilized by PEI (25 kDa) (red core, orange shell), followed by a layer of siRNA (green) and again PEI (orange). Finally, the particles are coated with HA (blue) with a molecular weight (MW) of 13 kDa.
A favorable tool to reduce the production of specific proteins is small interfering RNA (siRNA).[16,17] In a recent study, naked siRNA was applied to the anterior chamber of the eye.[18] The intention was to reduce the expression of tight junction proteins of endothelial cells lining the SC thereby improving outflow. Unfortunately, the IOP reduction was only of short duration. More importantly, the distribution of siRNA within the anterior chamber was not specifically addressed which could bear the risk of severe side effects like disrupting the integrity of the corneal endothelium or blood-aqueous-barrier of the ciliary epithelium. In addition, naked siRNA is subjected to degradation and not able to cross cellular membranes efficiently.[19] Thus, an enormous amount of siRNA is required to elicit a therapeutic effect.
Consequently, our approach will focus on the development of nanoparticles for targeted ophthalmic siRNA delivery. The nanoparticles will have to be injected into the anterior chamber of the eye (Scheme 1A). From there, we envision the nanoparticles following the natural flow of aqueous humor through the trabecular outflow pathway, which consists of various morphologically and functionally different parts (Scheme 1B)[11]: a) the corneoscleral TM that is highly porous, b) the juxtacanalicular TM (JCT) that is characterized by smaller pore sizes and a much denser ECM, and finally c) the endothelial lining of SC that completes the outflow pathway before aqueous humor is drained into the episcleral veins. The transport of particles through the interstitial space of the TM is poorly understood and scarcely investigated. An early study in the 1990s revealed that up to 45% of polystyrene particles (0.176 and 0.46 μm) were captured in the TM of perfused enucleated human eyes, even though the particles were smaller than the morphologically determined pore dimensions.[20] In another study, a portion of intracamerally injected cationic gold nanoparticles of 5 or 10 nm seemed to penetrate the JCT, but particles were then captured beneath the inner wall of the endothelium of SC.[21] These examples illustrate that the ECM of the trabecular outflow pathway poses a huge barrier to nanoparticles due to adhesive interactions.
Another challenge is the delivery of therapeutic siRNA molecules into TM and SC cells. Both cell types express the CD44 cell-surface receptor under normal, healthy conditions, and CD44 seems also to be elevated in TM cells of glaucomatous patients.[22,23] This difference between CD44 expression in healthy and glaucomatous cells may be exploited for a therapeutic approach because patients with glaucoma would respond to treatment in a different way compared to healthy individuals. A well-known approach to achieve CD44 targeting is the surface coating of nanoparticles with the naturally occurring polysaccharide hyaluronan (HA).[24] Although this principle has been successfully demonstrated for CD44-overexpressing cancer cells, it has yet to be demonstrated for other diseases such as glaucoma.
In this study, we will address the key question: How do nano-particles have to be designed to prevent adhesive retention in the trabecular outflow pathway and deliver therapeutic siRNA into TM and SC cells of glaucoma patients at the same time? In pursuit of our goal, we will focus on nanoparticles that are assembled with a layer-by-layer (LBL) approach (Scheme 1C).[25] The siRNA will be sandwiched between two polycationic poly(ethylene imine) (PEI) layers and most importantly, nano-particles will be coated with a final HA layer. We ascribe a dual, beneficial function to this natural polymer. First, we speculate that HA-decorated nanoparticles will not be retained in the ECM of the outflow pathway due to adhesive forces because HA is a highly abundant molecule in the ECM.[26] Second, we expect HA-decorated nanoparticles to bind to the CD44 receptor of TM and SC cells of glaucomatous patients which would allow for precise delivery of therapeutic molecules.
2. Results
To demonstrate the feasibility of our approach, we investigated the CD44 prevalence in glaucomatous versus healthy cells of the outflow pathway. First, the expression level of CD44 was evaluated in cultures of primary human TM (hTM) cells treated with TGF-β2 (1 ng mL–1) or its down-stream mediator CTGF (50 ng mL–1).[14,15] TGF-β2 is causatively involved in the pathogenesis of POAG and well known as a growth factor involved in the pathogenesis of glaucoma.[27] Both TGF-β2 and CTGF treatment led to significant increases of the CD44 protein level compared to untreated control cells (Figure 1A). Immunocytochemical staining of CD44 in confluent hTM monolayers confirmed these results (Figure 1B), showing a characteristic, fiber-like pattern of CD44 on the surface of hTM cells that was more pronounced after treatment with TGF-β2 or CTGF. CD44 levels were also studied in cultures of SC cells that were isolated from healthy and glaucomatous human donors (Figure 1C). Consistently, real-time (RT)-PCR analysis showed higher CD44 mRNA levels in glaucomatous SC cells compared to healthy control cells.
Figure 1.
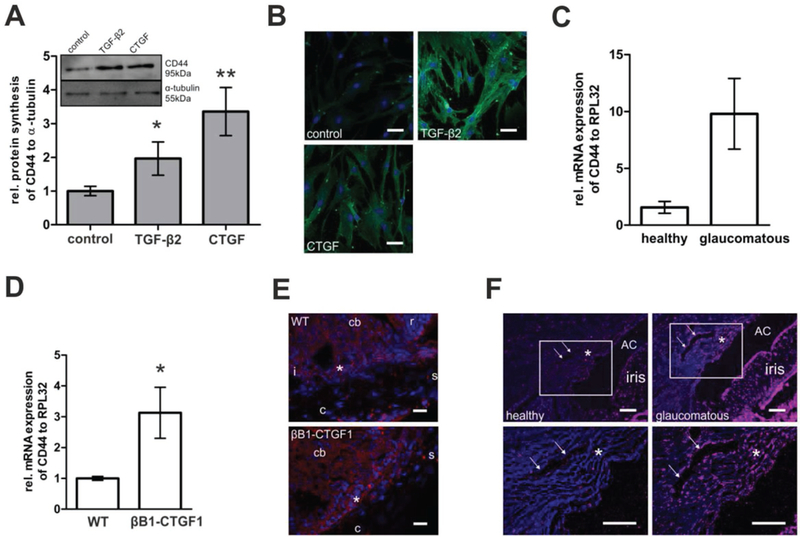
The CD44 prevalence was analyzed A–C) in healthy and glaucomatous cells in vitro, D,E) in transgenic mice, and F) in eyes of human donors. A) Cultures of human TM (hTM) cells were treated with TGF-β2 (1 ng mL–1) or its downstream mediator CTGF (50 ng mL–1). Western blot analysis (inlet panel A) with anti-CD44 antibody revealed significantly enhanced CD44 synthesis in hTM cells treated with TGF-β2 or CTGF compared to untreated control cells (*p = 0.045 and **p = 0.003). CD44 signal was related to the α-tubulin signal as a reference. Histograms represent densitometry-based average values (mean ± SD) of five independent experiments. B) Likewise, immunocytochemical staining of confluent hTM cells with anti-CD44 antibody revealed a marked increase of CD44 immunoreactivity of TGF-β2 and CTGF treated versus untreated cells. Blue: DAPI staining of cell nuclei; green: anti-CD44. Scale bar represents 50 μm. C) Primary SC cells of human glaucomatous versus healthy donor eyes were analyzed regarding their CD44 mRNA expression. Relative amount of CD44 mRNA of glaucomatous SC cells was enhanced compared to healthy SC cells (*p = 0.0534; healthy n = 4; glaucomatous n = 5). Values were normalized to the housekeeping gene RPL32 and represent mean ± SEM. D) CD44 prevalence in anterior eye segments of transgenic animals with lens-specific CTGF overexpression (βB1-CTGF1) was compared to that of their WT littermates. Relative mRNA expression was significantly enhanced in corneoscleral rims of βB1-CTGF1 compared to WT animals (*p = 0.04). Values represent mean ± SEM of four independent experiments. E) Immunohistochemical staining showed that the CD44 signal was primarily enhanced in TM and SC, but not in the sclera. Blue: DAPI staining of cell nuclei; red: anti-CD44. Scale bar represents 50 μm; cb: ciliary body; s: sclera; c: cornea; r: retina; i: iris; *:TM. F) Analysis of the chamber angle of human donor eyes also revealed remarkably brighter CD44 signal in the TM, SC, and iris of glaucomatous versus healthy donors. Lower panel of images is a magnification of white rectangles in images of upper panel. Blue: DAPI staining of cell nuclei; red: anti-CD44. Scale bar represents 100 μm. The area of the TM is depicted by an asterisk, the SC is depicted by arrows, AC is the anterior chamber. One representative of three independent experiments is shown.
Next, CD44 levels of transgenic mice with lens-specific CTGF overexpression (βB1-CTGF1) were compared to those of healthy, wild-type (WT) littermates. The transgenic animals develop an increased IOP, show significant pathological changes within the aqueous humor outflow pathway and progressive loss of axons in the optic nerve.[14] Anterior eye segments of 2-month old βB1-CTGF1 and WT mice were analyzed to evaluate whether morphological changes are connected to alterations of the expression and distribution of CD44. The relative mRNA level of CD44 was significantly increased in corneoscleral rims of βB1-CTGF1 animals compared to their WT littermates (Figure 1D). Because the corneoscleral rim contains not only the TM and SC, but also parts of the sclera, immunohistochemical staining was performed to precisely locate CD44 in the anterior eye segment. CD44 signal was detected in the iris, ciliary body, TM, and SC of 2-month old WT mice, and no signal was observed in the sclera (Figure 1E). In βB1-CTGF1 mice, a similar distribution of CD44 in the anterior chamber angle was observed; however, the signal was markedly increased in the tissues of the aqueous humor outflow pathway, while no changes were observed in the sclera (Figure 1E).
Finally and most importantly, CD44 expression was investigated in the iridocorneal angle of glaucomatous and healthy human donor eyes. Immunohistochemical staining of sections showed remarkably enhanced CD44 signal in the TM, SC, and the iris of glaucomatous eyes compared to healthy donor eyes (Figure 1F). Counterstaining with CD31 antibody was used as control and revealed no differences in signal intensity between healthy and glaucomatous tissue (Supporting Information Figure S1).
To address the question of how nanoparticles have to be designed to prevent nonspecific adhesion to tissue and cells in the outflow pathway and target TM and SC cells of glaucoma patients at the same time, nanocarriers were fabricated without therapeutic siRNA and had either a final layer of PEI (PEI-NPs) or HA (HA-NPs) on the surface (Figure 2). PEI-NPs served as a control because they are known to interact nonspecifically with cells and tissue,[28] and HA-NPs are hypothesized—as already outlined—to bind to CD44 and prevent nonspecific, adhesive interactions. As shown in Figure 2A, the core of the nanoparticles consisted of biodegradable, FDA-approved poly(D,L-lactide-co-glycolide) (PLGA) with an MW of 38–54 kDa. PLGA nanoparticles were prepared by nanoprecipitation and stabilized by polycationic polymer PEI with an MW of 25 kDa. PEI-NPs were then coated with negatively charged HA resulting in HA-NPs (Figure 2A,B). The MW of HA has a huge impact on the physicochemical properties of the nanoparticles and their functionality in the biological environment.[24,29] Hence, we investigated HA of 7.5, 13, 289, and 752 kDa for the coating process. Only HA of 13 kDa provided nanoparticles of excellent quality, other MWs resulted in agglomeration during the coating or purification process (data not shown). Hence, we continued experiments with HA of 13 kDa. To remove free, unbound polyelectrolyte, PEI- and HA-NPs were purified by stepwise centrifugation. Otherwise, ill-defined inter-polyelectrolyte complexes would have formed which are hard to separate from coated nanoparticles. The hydrodynamic diameter of both nanoparticle species was in a similar range, the z-average value was about 255 and 240 nm for PEI- and HA-NPs, respectively, as determined by dynamic light scattering. The absence of additional peaks in the intensity distribution and a polydispersity index (PDI) lower than 0.05 confirmed a narrow size distribution and the absence of agglomerates (Figure 2C,D, respectively). As expected, PEI-NPs had a positive zeta potential of about 48 mV, HA-NPs were negatively charged with a zeta potential of about – 18 mV. Scanning electron microscopy of dried nanoparticles confirmed their spherical shape (Figure 2C,D, respectively).
Figure 2.

Fabrication and characterization of nanoparticles without siRNA loading. A) PLGA (MW 38–54 kDa) nanoparticles were prepared by nano-precipitation and stabilized by PEI (25 kDa). Resulting PEI-NPs (red core with an orange shell) were then coated with HA (blue) with a MW of 13 kDa (HA-NPs). The nanoparticles were purified by centrifugation after each coating step. B) Cross-section through a schematic nanoparticle illustrating the charge of each layer. C,D) Physicochemical characterization of PEI- and HA-NPs, respectively: intensity distribution of hydrodynamic diameter (averaged over three measurements) as determined by dynamic light scattering. Particle size distribution was narrow, and no aggregates were present in dispersion (PDI: PEI-NPs 0.05, HA-NPs 0.04). PEI-NPs had a zeta potential of +48 mV, while HA-NPs were negatively charged with a zeta potential of about –18 mV. Scanning electron microscopy images display homogenous, spherical particles. The scale bar equals 500 nm. One representative of several independent experiments is shown. E) Rhod-labeled PEI- and HA-NPs (40 μg mL–1) were incubated in cell culture medium with different serum concentrations ranging from 0 to 1%. After 1 h, nanoparticles were added to primary hTM cells, incubated for 4 h, and imaged by CLSM. A low serum concentration was sufficient to stabilize a colloidal suspension of HA-NPs. In contrast, PEI-NPs formed large aggregates. White: Rhod-labeled nanoparticles. Transmitted light image is not shown to better focus on the large agglomerates versus colloidally stable nanoparticles. The scale bar represents 50 μm
To evaluate the colloidal stability of the nanoparticles, they were incubated in cell culture medium supplemented with concentrations of serum ranging from 0 to 1% for 1 h. Then, rhodamine B (Rhod)-labeled particles were added to primary hTM cells and observed by confocal laser scanning microscopy (CLSM) after an additional 4 h of incubation (Figure 2E). Without serum, both types of nanoparticles formed large aggregates on the surface of hTM cells. As little as 0.35% serum favorably enhanced the colloidal stability of HA-NPs, some of which were nicely distributed on the surfaces of hTM cells, while some were likely taken up by the cells. In contrast, nanoparticles decorated with PEI needed significantly higher serum concentrations of about 1% for sufficient colloidal stability. For further experiments we chose a serum concentration of 0.35% because it equals the protein content in the aqueous humor[30] and allows for the investigation of nanoparticles under physiologically relevant conditions.
The uptake of nanoparticles was assessed by CLSM. To reliably discriminate between extra-versus intracellular localization of nanoparticles, caveolin-1 (Cav1)—a structural protein involved in caveolin-dependent endocytosis—of immortalized human TM (HTM-N) cells was fluorescently labeled before incubation with nanoparticles. To this end, HTM-N cells were transfected with plasmid DNA encoding a fusion protein of Cav1 and green fluorescent protein (Cav1-GFP) using the commercially available transfection reagent Lipofectamine 2000. After 24 h, HTM-N cells were incubated with Rhod-labeled PEI- and HA-NPs at a serum concentration of 0.35%. Z-sections of HTM-N cells were imaged after 4 h using CLSM. Optical image sections were illustrated as 3D rendering (which gives the XY, XZ, and YZ images on a certain spot) or as a composite image of the z-sections (Figure 3A). As expected, PEI-terminated nanoparticles formed large aggregates at a serum concentration of 0.35% and were not taken up by HTM-N cells, but rather stuck to the outer membrane or attached on the bottom of the culture ware. In contrast, HA-NPs were detected inside HTM-N cells. They were evenly distributed between Cav1 vesicles and located throughout all planes of the cell.
Figure 3.

Cellular uptake and interaction of nanoparticles with CD44. A) Extra-versus intracellular distribution of PEI- and HA-NPs. Immortalized human TM (HTM-N) cells were transiently transfected with Caveolin-1 (Cav1) -GFP fusion protein and incubated with 40 μg mL–1 Rhod-labeled HA- or PEI-NPs for 4 h in culture medium containing 0.35% serum. Cells were observed by CLSM in the multitracking mode. Red: Rhod-labeled nanoparticles; green: Cav1-GFP fusion protein. Left panel: 3D rendering of 8 z sections through an HTM-N cell with top (XY) and lateral (XZ and YZ) view. Right panel: composite image of the same 8 z-sections from bottom to top view. PEI-NPs formed large aggregates that stuck to the cell surface and were not detected inside cells. HA-NPs homogeneously spread between green stained intracellular vesicles and were evenly distributed through all image planes. The scale bar represents 20 μm. To evaluate CD44-mediated binding of nanoparticles, B) HTM-N or C) hTM cells were pre-incubated with free HA with an MW of 289 kDa. After 1 h, nanoparticles were added at a concentration of 40 μg mL–1 and cells analyzed by B) CLSM or C) flow cytometry. The cell-associated fluorescence was reduced further after incubation with HA-NPs compared to PEI-NPs. White: Rhod-labeled nanoparticles. The scale bar represents 20 μm.
In the next step, the participation of CD44 receptor in the uptake of HA-NPs was evaluated. To this end, HTM-N cells were pre-incubated with HA of 289 kDa to saturate the receptor and prevent ligand-receptor interaction. Confocal images in Figure 3B nicely illustrate that free HA drastically inhibited the interaction of HA-NPs with HTM-N cells. In contrast, the effect was less distinct for PEI-NPs. Quantitative analysis by flow cytometry showed a similar trend (Figure 3C). The fluorescence intensity of cells that were treated with nanoparticles was significantly reduced in the presence of free HA, but the effect was more pronounced for HA-NPs.
To test the hypothesis that HA-coated nanoparticles will follow the natural outflow pathway and reach deep into the TM and SC, Rhod-labeled PEI- and HA-NPs were perfused into the anterior chamber of porcine eyes. After perfusion, the anterior chamber was dissected, and fluorescent imaging of the whole outflow ring was performed as illustrated in Figure 4A. PEI-NPs were detected only in few areas of the outflow ring and fluorescence from the nanoparticles was irregularly distributed (Figure 4B). In contrast, HA-NPs were homogeneously located throughout the whole outflow ring of perfused porcine eyes (Figure 4B). Quantitative measurement of integrated fluorescence density corroborated the significantly higher amount of HA-NPs (about 3-fold) compared to PEI-NPs in the outflow system after perfusion (Figure 4C).
Figure 4.
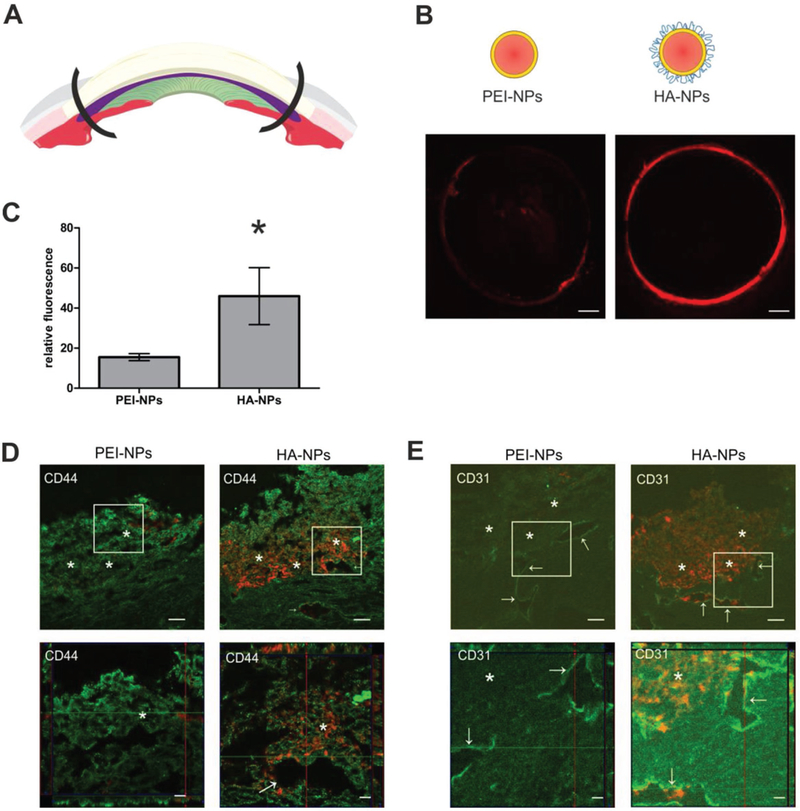
Porcine eyes were perfused ex vivo with Rhod-labeled PEI- and HA-NPs. A) After perfusion, the anterior eye segment was dissected and most of the sclera and cornea were removed. Remaining porcine outflow rings were placed onto microscopic slides. B) Fluorescence imaging of the whole outflow ring was performed using an Observer Z1 microscope. PEI-NPs were sparse and detected in limited areas of the outflow ring. In contrast, red fluorescence intensity of Rhod-labeled HA-NPs was much higher and was detected over the whole outflow ring. Representative images of eight (PEI-NPs) or nine (HA-NPs) independent porcine eyes are shown. C) Fluorescence was quantified using ImageJ. Values represent mean ± SEM and were statistically significantly different (*p = 0.0493). D,E) To precisely visualize nanoparticles in the outflow tissue, sagittal sections were prepared and stained with anti-CD44 or anti-CD31 antibody, respectively. Lower panel is a magnification of the white rectangle in the upper panel. HA-NPs were distributed in the whole outflow pathway and lumen of the AP, but PEI-NPs were only detected in the entrance region of the TM. Sections were analyzed by CLSM in the multitracking mode. Green: anti-CD44 antibody in D and anti-CD31 antibody in (E), red: Rhod-labeled PEI- and HA-NPs. Scale bar represents 50 μm (upper) and 20 μm (lower panel). The area of the TM is depicted by asterisks and the AP by arrows.
To determine the exact localization of the nanoparticles in the outflow system, sagittal tissue sections were stained with specific antibodies against CD44 after the perfusion procedure (Figure 4D). As expected given results shown in Figure 1, CD44 was homogeneously distributed through all parts of the TM and the aqueous plexus (AP) which is the anatomical correlate of pigs to the human or murine SC. At a higher magnification, cells of the corneoscleral TM and of the JCT showed a bright fluorescent signal for CD44. In addition, endothelial cells of the AP showed a pronounced signal. The CD44 counterstaining confirmed that PEI-NPs only accumulated at the corneoscleral TM and did not reach the JCT or the AP (Figure 4D, upper left panel). In contrast, HA-NPs were distributed throughout the entire TM and also reached the endothelial cells of the AP (Figure 4D, upper right panel). Optical z-sections that were reconstructed to a 3D image with top and lateral view of the section also illustrated the homogeneous distribution and deeper penetration of HA-compared to PEI-NPs (Figure 4D, lower panel). The perfusion with nanoparticles did not show a toxic effect during the perfusion time as no pronounced loss of cellularity was detectable in the outflow tissues (Figure 4D).
The porcine AP and other drainage vessels were located using an antibody against CD31 (Figure 4E). The images again revealed that HA-NPs were distributed throughout the outflow pathway and even entered AP endothelial cells and its lumen, which is underlined by z-stacks of optical sections of higher magnification (Figure 4E, lower panel). In contrast, in none of the examined sections, PEI-NPs were detected in the endothelial cells nor in the lumen of the AP.
In parallel to experiments with porcine eyes, murine and human donor eyes were perfused with nanoparticles ex vivo by cannulation of the anterior chamber. Cryo-sections of the human outflow pathway were counterstained with an antibody against CD44 to determine the exact location of nanoparticles. Figure 5A convincingly illustrates that only a very limited amount of PEI-NPs was detected in the outflow region. Moreover, PEI-NPs were detected only in the corneoscleral TM and not in deeper regions. In contrast, a much higher amount of Rhod-labeled HA-NPs was detected in the outflow tract. HA-coated nanoparticles spread over the whole outflow region, penetrated through the entire TM, including the JCT and the endothelial cells of SC.
Figure 5.

A) Human and B) murine eyes were perfused ex vivo with Rhod-labeled PEI- and HA-NPs. To precisely locate nanoparticles in the human outflow pathway tissue, sagittal sections were prepared and stained with an anti-CD44 antibody while specimens of the murine outflow were stained with an antibody against CD31. Lower panel of images are 3D reconstructions of SC region in a higher magnification. A) Only a small amount of nanoparticles was detected in the entrance region of the outflow pathway, while HA-NPs spread throughout the whole out-flow region and even entered the SC lumen. B) HA-NPs were localized along the outflow pathway, while PEI-NPs were irregularly distributed and nonspecifically bound to the iris. For a better overview of the outflow pathway, the transmitted light image is also shown. Sections were analyzed by confocal microscopy in the multitracking mode. Green: anti-CD44 in A and anti-CD31 in B, red: Rhod-labeled PEI- and HA-NPs. Scale bar represents 50 μm (upper panel) and 20 μm (lower panel). The area of the TM is depicted by asterisks, the SC is depicted by arrows; cb: ciliary body; arrowhead: iris.
Because murine eyes are much smaller than human eyes, it was possible to present a much larger section of the murine anterior chamber within one image (Figure 5B). Counterstaining of murine endothelial cells with CD31 corroborated the distribution of the nanoparticles. PEI-NPs stuck to the anterior surface of the iris and few particles ultimately reached the TM. In other samples (data not shown), a similar tendency was observed. PEI-NPs were localized in the anterior chamber and showed a tendency toward aggregation and nonspecific adhesion. In contrast, HA-NPs were predominantly detected within the aqueous humor outflow region and more specifically in the corneoscleral TM as well as in the deeper regions of the JCT. The perfusion with nanoparticles did not show a toxic effect in the human or murine perfused eyes as no pronounced loss of cellularity was detectable in the outflow tissues (Figure 5A,B).
After demonstrating that nanoparticles can be drained to the TM and SC after injection into the anterior chamber of the eye in three different species, the gene silencing capability of siRNA-loaded nanoparticles was tested in hTM cells in vitro. To this end, nanoparticles were assembled in an LBL process according to Figure 6A. Nanoparticles were fabricated either with functionally verified siRNA against human CTGF or non-targeted control siRNA. To protect the fragile siRNA from degradation by nucleases, an additional layer of PEI was applied (PEI(siRNA)-NPs). Finally, the particles were coated with the negatively charged polysaccharide HA (HA(siRNA)-NPs). With this coating procedure, it was again possible to compare nanoparticles with outer PEI or HA layers. The size of PEI(siRNA)-NPs was about 260 nm. HA(siRNA)-NPs were slightly smaller with a hydrodynamic diameter of about 214 nm as determined by dynamic laser light scattering (Figure 6B). Interestingly, the hydrodynamic diameter of the nanoparticles only increased if PEI was adsorbed to the nanoparticle surface but decreased with negatively charged siRNA or HA. The formation of a thicker hydration shell around PEI-terminated nanoparticles of high charge density[31] or a nonregular film growth as already observed on planar surfaces[32] could be possible reasons. Both particle species had narrow size distributions reflected by PDI’s below 0.1; the PDI of HA(siRNA)-NPs was even as small as 0.03 (Figure 6B). A reversal of the zeta potential after addition of each polycation layer indicated successful coating (Figure 6C). PEI(siRNA)-NPs had a strong positive surface charge of about 56 mV, while HA(siRNA)-NPs had a negative zeta potential of about –14 mV. Altogether, the physicochemical characteristics of siRNA-loaded nanoparticles were comparable to those applied for the perfusion studies without siRNA.
Figure 6.
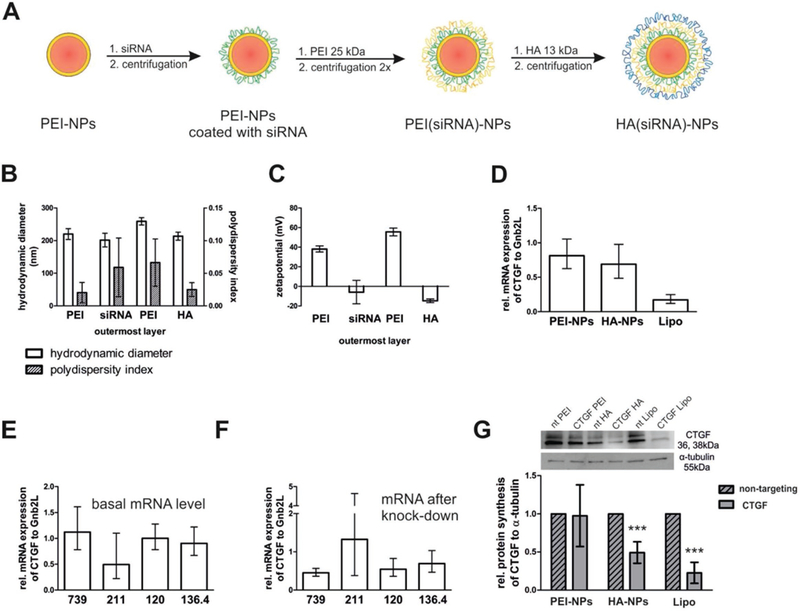
Fabrication, characterization, and CTGF gene silencing of siRNA-loaded nanoparticles in hTM cells. A) LBL assembly of nanoparticles for gene silencing studies in hTM cells. PLGA nanoparticles were stabilized with PEI (25 kDa) (red core, orange shell) and then coated with siRNA (green). The next PEI layer (orange) protected siRNA from degradation. Finally, the particles were coated with HA (blue) with an MW of 13 kDa. The nanoparticles were purified by stepwise centrifugation between the individual coating steps. B) Hydrodynamic diameter and PDI of nanoparticles during the coating process. The x-axis indicates the outermost layer of the NPs. A PDI lower than 0.1 confirmed the absence of aggregates. The values represent the mean ± SD of three independent measurements. C) Surface charge reversal after each step demonstrated successful adsorption of the respective polyelectrolyte. The values represent the mean ± SD of three independent measurements. D-G) In vitro CTGF-silencing efficacy of PEI- and HA(siRNA)-NPs in hTM cells on the mRNA and protein level. hTM cells were treated with 1 ng mL–1 TGF-β2 and incubated with PEI- or HA(siRNA)-NPs. Lipoplexes built with Lipofectamine RNAiMAX (Lipo) served as control. For lipoplexes, the siRNA concentration was 100 × 10–9 M, for nanoparticles, the siRNA concentration was 600 × 10–9 M. D) Both treatment with PEI- and HA(siRNA)NPs slightly reduced the CTGF mRNA level of hTM cells, but the difference between the groups was not statistically significant. In contrast, dramatic differences existed between cells from different donors. E) hTM cells from donor nos. 739, 120, and 136.4 had much higher basal CTGF mRNA levels compared to those from donor no. 211. F) At the same time, relative CTGF mRNA reduction in cells from donors with higher basal levels was more pronounced. CTGF mRNA level was analyzed by RT-PCR. Values were expressed as relative mRNA CTGF/Gnb2L and related to values of particles that were fabricated with nontargeting control siRNA. G) CTGF protein expression was detected by Western Blot analysis. Values are average of donor nos. 739, 120, and 136.4. HA(siRNA)NPs reduced the CTGF protein expression of hTM cells to about 50%, while PEI(siRNA)NPs did not elicit any effect. Values were expressed as relative CTGF/α-tubulin. Values of particles that were fabricated with siRNA against CTGF were statistically significantly different from particles fabricated with nontargeting control siRNA if indicated by *** (Lipo: p = 0.004, HA(siRNA)NPs: p = 0.003). Shown is the mean ± SD of four individual experiments each performed in triplicate.
CTGF gene silencing studies were performed in primary hTM cells isolated from different donors eyes. After stimulation with TGF-β2, hTM cells were incubated with PEI- or HA(siRNA)-NPs. The CTGF mRNA levels were analyzed by RT-PCR and related to Gnb2L as a housekeeping gene (Figure 6D). Gene silencing with the commercially available Lipofectamine RNAiMAX at an siRNA concentration of 100 × 10–9 M led to a reduction of relative CTGF mRNA to about 17% of the initial value and served as positive control. Both HA- and PEI-terminated nanoparticles reduced the cellular CTGF mRNA levels. The siRNA concentration was 600 × 10–9 M. Control nanoparticles with nontargeted siRNA demonstrated that the silencing was specific. In addition, the polyelectrolyte layers may strongly stick together, and hence, not the total amount of siRNA may be available for the gene silencing process (data not shown). HA(siRNA)-NPs were slightly more efficacious than PEI(siRNA)-NPs (silencing by ≈30% and 20%, respectively), but not statistically different. Each relative CTGF mRNA value shown in Figure 6D was averaged over four different donors’ cells. After a closer look at the results of single donor’s cells, pronounced differences became evident. First, cells of donor nos. 739, 120, and 136.4 had much higher basal CTGF levels than cells from donor no. 211 (Figure 6E). Interestingly, glaucomatous cells also express higher CTGF levels. At the same time, gene silencing was more pronounced and efficient in donor cells with higher basal CTGF expression than in donor cells with lower basal CTGF levels (Figure 6F). Finally, we performed Western Blot analysis of donor cells with high basal CTGF expression (Figure 6G). Here, differences between PEI- and HA-coated nanoparticles were also quite impressive. HA(siRNA)-NPs led to a reduction of CTGF of about 50%; in contrast, PEI-NPs showed no effect. As expected, the positive control with Lipofectamine RNAiMAX reduced CTGF levels to about 20%.
3. Discussion
Our study presents a novel therapeutic concept for the treatment of glaucoma and involves the intracameral, targeted delivery of siRNA. First, we identified CD44 as a valid target for nano-particle delivery to TM and SC cells in the anterior chamber of the eye. Second, we developed HA-coated nanoparticles that deeply penetrated into the outflow region of porcine, murine, and human eyes ex vivo and had the capability of silencing CTGF—a major mediator of pathological effects associated with glaucoma—in cultures of human TM cells.
Delivery systems such as nanoparticles are of utmost importance to enhance the stability and intracellular availability of siRNA.[33] Our strategy was to utilize LBL-assembled nanoparticles.[25] To this end, PLGA nanoparticles were coated with PEI, siRNA, and HA via electrostatic interaction. A reversal of the zeta potential indicated a complete surface decoration of the nanoparticles after addition of each polyelectrolyte layer (Figures 2 and 6). Regardless of their composition, all nano-particles were in a similar size range and had a maximum hydrodynamic diameter of about 260 nm (Figure 2). In addition, exceptionally low PDI values confirmed monodisperse size distributions and the absence of agglomerates (Figure 2). Thus, it was possible to make comparisons between nanoparticles of similar size but different surface charge: negatively charged HA-NPs and positively charged PEI-NPs. PEI-NPs served as a control due to their well-known nonspecific interactions with cells and tissues.[28] In cell culture medium of physiological ionic strength, both particle types showed strong tendencies toward agglomeration which was most likely provoked by screening electrostatic interactions. The addition of serum significantly reduced the agglomeration with HA-NPs being stabilized at a serum concentration of 0.35% (Figure 2). Interestingly, 0.35% serum concentration is equal to the total protein content of the aqueous humor of 12.4 mg/100 mL.[30] Hence, the functionalization of nanoparticles with HA will guarantee their colloidal stability in the therapeutic milieu of the anterior chamber of the eye. In the presence of serum, nanoparticles associate with a range of proteins thereby forming a corona which stabilizes the colloidal nanoparticle dispersion.[34] Physicochemical properties of the nanoparticles play an important role for the amount and type of proteins adsorbed.[35] It was described that positively charged chitosan-nanoparticles adsorbed more proteins on their surface than the same particles that were additionally coated with HA and were thus negatively charged.[36] The higher protein adsorption to positively charged chitosan-nanoparticles was accompanied by particle aggregation, while HA-coated nanoparticles were colloidally much more stable. Similar to this study, HA-NPs were colloidally more stable compared to positively charged PEI-NPs.
Various types of nanoparticles have been topically applied for drug delivery to the anterior chamber of the eye.[37] Topically applied drugs or nanoparticles are usually formulated as eye drops, are self-administrable and most convenient for patients, but they are severely limited by a low bioavailability of only 1–7% in the aqueous humor. Intracameral injection of nanoparticles—as envisioned in this study—bypasses the cornea, conjunctiva, and blood-aqueous barrier, and is therefore expected to make drugs available in the aqueous humor at levels about 300 to 600 times higher.[37] Intracameral injection of antibiotics has demonstrated a very strong safety profile,[37] but a standard procedure for intracameral injection of nanoparticles has not evolved so far. The goal of this study was to inject nanoparticles into the anterior chamber of eyes ex vivo. Together with the bulk flow of the aqueous humor which is drained at a velocity of about 2.5 μL min–1,[38] the nanoparticles are expected to reach the TM. Earlier investigations illustrated that the TM poses a severe barrier to nanoparticles.[20,21] In the mentioned studies, injected particles were not exploited as drug delivery systems but rather with the intention to clog the pores of the TM to generate an experimental glaucoma. Hence, it was a delicate balance to fabricate nanoparticles that are on one hand sufficiently large to transport siRNA as therapeutic freight but on the other hand small enough to prevent an obstruction of the outflow pathway. At first glance, nanoparticles with a diameter of about 260 nm seem to be sufficiently small to pass the TM and enter the SC because pore sizes of the corneoscleral TM are reported to have diameters up to 6 μm[20] and intracellular pores of cells lining the SC are reported to have an average diameter of 1 μm and a density of about 1000 pores mm–2,[11] respectively. However, adhesive interaction of particles with ECM components seems to be a much larger hurdle than size retention.[39] The JCT is a loose connective tissue consisting of collagen as its main structural component together with various proteoglycans and glycosaminoglycans such as HA.[11] The overall net negative charge of ECM components is expected to immobilize nanoparticles with cationic surface charge by nonspecific electrostatic interactions.[39,40] This is supported by our findings in ex vivo culture in three different species: pig, mouse and human. Positively charged PEI-NPs were hampered in their mobility, stuck at the entrance region of the TM, and were not able to reach deeper regions of the TM and the SC independent of the species. Hence, PEI-NPs were not capable of reaching close proximity to their target cells which is detrimental to therapeutic success. Another limiting factor of PEI-NPs was their tendency to form agglomerates which most likely further limited their mobility in the tissue.
Coating with HA awards nanoparticles antifouling properties and is a promising strategy to reduce nonspecific interaction with ECM components.[24] Interestingly, HA has also been recognized as a valuable excipient for various ocular applications.[29] For example, coating of polymeric nanocarriers and lipoplexes with HA significantly enhanced their intravitreal mobility compared to uncoated species.[41,42] We speculated that nanoparticles for intracameral injection may also benefit from an HA-coating because negatively charged, HA-coated nanoparticles may not be attracted to ECM components which have an overall net negative charge, thereby allowing them to diffuse through the TM more effectively. Indeed, significantly fewer negatively charged HA-NPs were intercepted in the inner TM compared to positively charged PEI-NPs of similar size (Figures 4 and 5). We provided evidence to support our hypothesis in three different species: in porcine eyes, HA-NPs were detected in the aqueous plexus which correlates to SC in humans; in murine eyes, HA-NPs were detected in deep regions of the TM and in close proximity to SC; and in human eyes, a portion of HA-NPs even reached the lumen of SC. On the way to reach the SC in human eyes ex vivo, HA-NPs covered an overall distance of around 100 μm through the entire TM including 13 μm of the JCT. Consequently, colloidally stable negatively charged nanoparticles followed the natural aqueous humor outflow, while positively charged nanoparticles stuck to inner parts of the sieve-like TM or may have clogged the outflow pathway.
Besides its function as a stealth molecule, HA also acts as an endogenous ligand for the CD44 cell-surface receptor which is overexpressed in tumor cells and prevalent in various other cell types within the body.[24,29] The current study focused on identifying and validating CD44 as a possible target for drug delivery to the TM. It was reported that TM and SC cells carry the CD44 receptor.[22,23] However, it has not been investigated whether the expression level is sufficient for nanoparticle binding and uptake. To examine nanoparticle-receptor interaction, a competitive binding assay with free HA with a MW of 289 kDa was performed. Results confirmed that a fractional but significant contribution to nanoparticle binding arises from interaction with CD44 (Figure 3). It was not possible to completely inhibit nanoparticle binding and uptake by the addition of free HA, but this is in line with other studies where interaction of CD44 with HA-coated nanoparticles was investigated.[41–43] It is of interest that the cell-associated fluorescence after incubation with PEI-NPs was also slightly reduced in the presence of free HA. We assume that positively charged particles may have interacted with free negatively charged HA and thus been retracted from the cell surface. For gene silencing studies, an intracellular localization of nanoparticles is of utmost importance. However, because PEI-NPs tended to build agglomerates, it was hard to discriminate between extra- and intracellular location of particles in confocal images. Hence, we labeled intracellular caveolin-derived vesicles by heterologous expression of a fluorescent fusion protein. By scanning cells in the z-direction, it was possible to detect a large number of HA-NPs inside TM cells which emphasizes the strong potential of HA-coated nanoparticles as a vector for intracellular delivery of siRNA (Figure 3).
Regarding the interaction of nanoparticles with CD44, it was of great interest if a difference in CD44 expression between healthy and glaucomatous cells existed since this could be exploited for a potential therapy. To this end, we examined the CD44 expression in vitro in primary TM and SC cells, in vivo in transgenic mice and ex vivo in human eyes. In addition, we applied cells of healthy and glaucomatous patients, or, if glaucomatous cell lines were not available, we stimulated TM cells of healthy donors with CTGF or TGF-β2. We found that both growth factors significantly stimulated CD44 mRNA and protein expression in TM cells (Figure 1). Moreover, we observed that CD44 was significantly increased in the outflow tissues of the transgenic βB1-CTGF1 mice compared to the wild-type littermates. The observation was in line with enhanced CD44 signaling in the TM and the SC of glaucomatous donors in comparison to healthy eyes. These observations were especially important for the goal of the study as CD44 expression was exactly enhanced in the target regions and further corroborated our novel therapeutic concept. Consequently, coating nanoparticles with HA has a dual function. First, it enhances the mobility of nanoparticles in the ECM of the TM in a similar way as for nanocarriers in the vitreous.[29] Second, HA-coated nanoparticles can be directed to TM and SC cells with relatively high specificity. In addition, the significant difference in CD44 expression could be exploited in future research such that glaucomatous cells would respond differently to a therapy with HA-NPs compared to healthy cells.
A recent study reported on the reduction of IOP by the knockdown of tight junction proteins in endothelial cells of SC with naked siRNA.[18] Major shortcomings of naked siRNA are the lack of specificity, short half-life, the need for extremely high doses and that naked siRNA does not freely cross the cell membrane. Thus, two big advantages of nanoparticles as suggested in our approach are allowing much lower siRNA doses and enabling specific target uptake of the nanoparticles. An important result of the study was that HA-terminated nanoparticles loaded with siRNA against CTGF elicited stronger effects than PEI-particles. A beneficial effect of a HA-coating has also been demonstrated for other gene delivery systems: a covalent coupling of HA to lipoplexes reached an 8-fold increase of transgene expression compared to uncoated lipoplexes.[41] Moreover, a very interesting result of gene silencing studies was that CTGF silencing seemed to depend on the basal cellular CTGF level (Figure 6E,F). This relationship might be a great therapeutic opportunity: if silencing with HA-functionalized nanoparticles is more effective in cells with high CTGF levels, healthy cells would remain unaffected by a potential therapy and undesired side-effects caused by “over-silencing” would be avoided. The glaucoma mouse model that was applied in this study is based on an overexpression of CTGF in the lens and not in the outflow tissues.1141 Since HA-coated nanoparticles accumulate in the outflow tissue and did not bind to epithelial cells of the lens, they would not cause an efficient CTGF silencing and reduction of the IOP. Therefore, after having established a glaucoma mouse model with increased expression of CTGF in the outflow tissues, the nanoparticles will be tested in vivo.
4. Conclusion
We propose a novel therapeutic concept to causally treat the progression of glaucoma. To establish this novel concept, we 1) identified CD44 as a promising target for the delivery of nanoparticles to cells of the aqueous humor outflow pathway tissue in the anterior chamber of the eye. The finding is corroborated by the induction of CD44 by CTGF and TFG-β2 in vitro, the increased presence of CD44 in the anterior chamber angle in a glaucoma mouse model and the marked increase of CD44 in TM and SC cells of glaucomatous patients. Moreover, we 2) developed a delivery system for siRNA against CTGF which is linked to the pathologically altered IOP of glaucoma patients. The HA-coated nanoparticles directly targeted the CD44 cell-surface receptor, and their delivery to cells of the outflow pathway was more efficient compared to positively charged PEI-coated nanoparticles as shown by cell culture studies and perfusion studies in porcine, murine, and human organ culture. This characteristic can be attributed to the HA-coating which makes nanoparticles highly suitable for intra-cameral drug delivery due to enhanced mobility in the ECM. In vitro experiments revealed efficient knockdown of CTGF by the delivery of a specific siRNA. Interestingly, the gene silencing may depend on the expression profile of CTGF in TM cells which in turn could offer the HA-decorated nanoparticles high specificity toward pathologic expression changes in the tissues of the aqueous humor outflow pathway. Together, the results demonstrate for the first time that HA-decorated nanoparticles are an excellent therapeutic approach to deliver specific agents like CTGF siRNA to the tissues of the aqueous humor outflow pathway with high efficacy and specificity thereby preventing the progression of glaucoma.
5. Experimental Section
Cell Culture:
Primary cultures of TM (hTM) cells and primary SC cells were isolated from human donors eyes and used until passage number 8. Methods for securing human tissue were humane, included proper consent and approval, and complied with the Declaration of Helsinki, using established methods (PMIDs: 29526795, 7587308, and 9727403). HTM-N cells were provided by Iok-Hou Pang and Louis DeSantis (Alcon Research Laboratories, Fort Worth, TX), and were cultured according to published protocols.[44] Cells were cultivated in Leibovitz medium containing 10% serum. If indicated, cells were stimulated for 24 h in serum-free medium, followed by another 24 h in serum-free medium supplemented with 1 ng mL–1 human TGF-β2 (R&D systems, Wiesbaden, Germany) or CTGF (50 ng mL–1) (EMP Genetech, Ingolstadt, Germany), respectively. All cell culture reagents were obtained from Gibco (ThermoFisher Scientific, Waltham, Massachusetts, United States).
mRNA Isolation and RT-PCR Analysis:
mRNA was isolated from hTM cells, anterior eye segments of transgenic βB1-CTGF1 and wild type (WT) mice, and primary SC cells as follows: Total RNA was extracted using TriFast (Peqlab, Erlangen, Germany) reagent according to the manufacturer’s recommendations. cDNA was prepared by using the qScriptcDNA Synthesis Kit (Quanta Biosciences, Gaithersburg, USA) according to the manufacturer’s instructions. All primers were from Invitrogen and extended over exon–intron boundaries. The sequences of the primers were as follows: 5’-gacacattccaccccagtg-3’ (huCD44 forward), 5’-tggaatttggggtgtcctta-3’ (huCD44 reverse), 5’-gaagttcctggtccacaacg-3’ (huRPL32 forward), 5’-gcgatctcggcacagtaag-3’ (huRPL32 reverse), 5’-actcaagtgcgaaccaggac-3’ (msCD44 forward), 5’-gccaagatgatgagccattc-3’ (msCD44 reverse), 5’-gctgccatctgttttacgg −3’ (msRPL32 forward), 5’-tgactggtgcctgatgaact-3’ (msRPL32 reverse), 5’-ctcctgcaggctagagaag-3’ (CTGF forward), 5’-gatgcactttttgcccttctt-3’ (CTGF reverse), 5’-cctaaccgctactggctgtg-3’ (Gnb2L forward), and 5-ctacaatgatctttccctctaaatcc-3’ (Gnb2L reverse). RT-PCR was performed on a BioRad iCycler (BioRad, München, Germany) in 50 cycles with the temperature profile of 20 s melting at 94 °C, 10 s annealing at 60 °C, and 20 s extension at 60 °C. RNA that was not reversely transcribed served as negative control. For relative quantification of the experiments, Gnb2L or RPL32 were used as housekeeping genes. Bio-Rad iQ5 Optical System Software (version 2.0) was used for analysis and ΔΔct-method was applied for normalization.
Western Blot Analysis:
To examine CD44 and CTGF expression, proteins of primary hTM cells were isolated after RNA separation according to the manufacturer’s instructions (TriFast, Peqlab, Erlangen, Germany). Proteins were dissolved in 1% SDS containing protease and phosphatase inhibitors. Protein concentration was determined by the bicinchoninic acid assay (Interchim, Montlugon Cedex, France). Thereafter, proteins were separated by SDS-PAGE and transferred to polyvinylidene difluoride membranes (Roche, Mannheim, Germany). Western blot analysis was performed with specific antibodies as described previously.[45] Antibodies were used as follows: mouse anti-CD44 (1:1000, R&D systems, Minneapolis, USA), goat anti-rabbit (1:5000, Cell Signaling Technology, Danvers, USA), goat anti-CTGF (1:500; Santa Cruz, Dallas, USA), horse anti-mouse (1:2000, Cell Signaling Technology, Danvers, USA). α-tubulin (rabbit anti-α-tubulin, 1:2500, Rockland Immunochemicals Inc., Gilbertsville, USA) was used as loading control. Chemiluminescence was detected on a LAS 3000 imaging workstation (Fujifilm, Düsseldorf, Germany), and signal intensity was estimated by the AIDA Image analyzer software (Raytest, Straubenhardt, Germany).
Immunocytochemistry:
hTM cells were seeded on coverslips. After reaching confluency, cells were stimulated with TGF-β2 or CTGF as described above or left untreated as control. Cells were washed twice with PBS, fixed with 4% (w/v) paraformaldehyde (PFA) for 5 min and washed again three times with 0.1 M phosphate buffer. Specific antibodies were used as follows: mouse anti-CD44 (1:100, R&D systems, Minneapolis, Germany) and Alexa Fluor 488-conjugated anti-mouse IgG (1:1000, Invitrogen, Darmstadt, Germany). As a control for nonspecific binding of the secondary antibody, negative controls were performed. Finally 4,6-diamidino-2-phenylindole (DAPI) (Vector Laboratories, Burlingame, USA) was added to counterstain nuclear DNA and the immunofluorescence was visualized using a Zeiss Axio Imager fluorescence microscope (Carl Zeiss AG, Gottingen, Germany).
Immunohistochemistry:
Sections of the anterior chamber of human donor eyes were deparaffinized and rehydrated. Sections were pretreated by boiling in 0.2 M citric acid/0.2 M sodium citrate for 30 min, followed by blocking with 2% bovine serum albumin (BSA), 0.2% cold water fish skin gelatin (Sigma-Aldrich), 0.1% Triton X-100 in 0.1 M phosphate buffer. Sections were incubated with mouse anti-CD44 (1:100; R&D systems, Minneapolis, Germany) at 4 °C overnight. Afterward, tissue sections were washed three times with 0.1 M phosphate buffer, followed by an incubation with the secondary antibody Alexa Flour 647 donkey anti-mouse IgG (H+L) (1:200, Invitrogen, Carlsbad, USA) for 1 h at room temperature. As a control for nonspecific binding of secondary antibodies, negative controls were performed. After washing three times with 0.1 m phosphate buffer, the slides were mounted using the DakoCytomation fluorescent mounting medium with DAPI 1:10 (DakoCytomation, Hamburg, Germany). Slides were dried overnight at 4 °C before fluorescence microscopy as described above.
Nanoparticle Preparation and Characterization: Materials:
Acid terminated PLGA (lactide/glycolide 50/50) with an average molecular weight of 38–54 kDa and branched PEI 25 kDa were purchased from Sigma-Aldrich Chemical Company (Taufkirchen, Germany). Rhodamine B endcapped PLGA (lactide/glycolide 50/50, 30 kDa) (RhodPLGA) was obtained from Polyscitech (West Lafayette, Indiana, United States). Sodium hyaluronate (HA) (13 kDa) was bought from Lifecore Biomedicals (Chaska, Minnesota, United States). Nontargeting siRNA (5′-UUC UCC GAA CGU GUC ACG UdTdT-3′) and siRNA directed against CTGF (5′-AGA UUC CCA CCC AAU UCA ATT dTdT-3′) were purchased from Qiagen (Hilden, Germany) and Eurofins (Ebersberg, Germany). Sucrose, microbiological grade, was from Merck (Darmstadt, Germany). Particle Preparation: Rhod-labeled PLGA nanoparticles were prepared by nanoprecipitation. In brief, 2 mL of a 10 mg mL–1 solution of PLGA (PLGA/RhodPLGA = 50/50) in acetonitrile was slowly injected into 8 mL of a solution of 0.5% PEI in ultrapure water and stirred for 4 h until the organic solvent totally evaporated. For flow cytometry, nanoparticles were prepared with FITC-labeled PEI instead of Rhod-labeled PLGA. In this case, PEI was labeled according to a described procedure.[46] Excess PEI was removed by stepwise centrifugation at a speed of 5000, 7000, and 9000 g for 7 min each; the complete centrifugation cycle was repeated once. Resulting PEI-coated nanoparticles were subsequently re-suspended in ultrapure water, then lyophilized with the addition of 2% sucrose as a protective agent. Nanoparticle yield was gravimetrically determined, and particles were stored at –20 °C until further use. For subsequent coating steps, lyophilized nanoparticles were re-suspended in ultrapure water at a concentration of 1 mg mL–1 and purified from sucrose according to the procedure described above. Then, nanoparticles were added dropwise to a stirred solution of the respective polyelectrolyte (final concentration: HA 1 mg mL–1 in water, siRNA 4 × 10⁻⁶ M in 10 × 10–3 M NaCl, PEI 1 mg mL–1 in water), according to the process described by Elbakry et al.[25] Dispersions were kept on a stirring plate for 30–60 min. Unbound polyelectrolyte was removed by stepwise centrifugation, followed by re-suspension in ultrapure water. If siRNA or HA was the outermost layer, centrifugation speed was reduced to 1000, 2000, and 3000 g for 7 min each, with no repetition of the complete centrifugation cycle. Concentration of assembled nanoparticles was determined in relation to the florescence of re-suspended, but unpurified nanoparticles of known concentration on a microplate reader (FLUOStar Omega, BMG Labtech, Ortenberg, Germany) equipped with a 544 nm excitation and a 590 nm emission filter set. The number of siRNA molecules per nanoparticle was determined by the amount of siRNA adsorbed on the nanoparticles’ surface (amount of siRNA added – amount siRNA removed during purification) and the molar nanoparticle concentration. To this end, the absorbance of the supernatant and the siRNA coating solution was read at 260 nm with a Nanodrop 2000c (Peqlab, Erlangen, Germany). The molar nanoparticle concentration was determined from the mass concentration and from the volume and the density of a nanoparticle.[47] According to[48] a density of 1.3 g cm–3 was assumed. The calculated siRNA concentration in the culture medium was an average of six different nanoparticle batches. Physicochemical Characterization: Hydrodynamic diameter and zeta potential of diluted (in water) samples were determined by dynamic and electrophoretic light scattering, respectively, using a Zetasizer Nano ZS (Malvern Instruments, UK). For all size measurements, 173° backward scatter in the general-purpose mode with automatic measurement position and attenuator selection at 25 °C was applied. Z-Average values were determined from three independent samples, each measured three times with 11 runs per measurement. Zetapotential was determined in the monomodal mode using the Smoluchowski approximation, measuring three independent samples three times each. For scanning electron microscopy, purified nanoparticles were added dropwise to conductive pads (Plano GmbH, Wetzlar, Germany) attached to aluminum specimen stubs (Agar Scientific, Stansted, Essex, UK) and air dried. The samples were sputtered with Au/Pd using a Polaron SC 515 SEM Sputter Coating System. Images were taken on a Zeiss DSM 950 scanning electron microscope (Jena, Germany). An acceleration voltage of 10 kV was used. The working distance was set to 15 mm and a magnification of 30 000 × was chosen.Colloidal Stability:Nanoparticles were incubated at a concentration of 40 μg mL–1 in Leibovitz medium supplemented with 0 to 1% serum for 1 h at room temperature to allow for the formation of a protein corona. hTM cells were seeded into μ-Slide 8 Well ibidi slides (ibidi, Planegg, Germany) at a density of 20 000 cells per well 24 h before use. Cells were rinsed with phosphate buffered saline (PBS) and incubated with nanoparticles for 4 h. Thereafter, cells were washed two times with PBS, supplied with fresh Leibovitz medium containing 10% serum and analyzed by CLSM (LSM 510 META, Carl Zeiss, Jena, Germany). Rhod-labeled nanoparticles were excited at 543 nm and fluorescence emission was detected from 560 to 615 nm.
Cellular Uptake of Nanoparticles:
HTM-N cells were seeded at a density of 40 000 cells per well into μ-Slide 8 Well ibidi slides. After 24 h, cells were transfected with a cav1-GFP plasmid (plasmid #14433 from Addgen, Cambridge, Massachusetts, United States). Lipoplexes were prepared according to manufacturer’s instructions by using 0.3 μg DNA and 1 μL Lipofectamine 2000 (ThermoFisher Scientific, Darmstadt, Germany) per well and added to the cells for 4 h. The next day, cells were treated with 40 μg mL–1 nanoparticles in Leibovitz medium supplemented with 0.35% serum as described above. Cells were observed by CLSM in the multitracking mode using 488 and 543 nm lasers for excitation, and a 505–530 nm bandpass or a 560 nm longpass filter, respectively, for fluorescence emission detection. Z-sections were taken with an optical slice thickness of 0.7 μm.
Interaction of Nanoparticles with CD44 Receptor:
For microscopic evaluation, hTM cells were seeded into μ-Slide 8 well ibidi slides at a density of 20 000 cells per well and grown overnight. Cells were rinsed with PBS and incubated with 5 mg mL–1 HA of 289 kDa in Leibovitz supplemented with 0.35% serum for 1 h. Rhod-labeled nanoparticles were incubated at a concentration of 80 μg mL–1 in Leibovitz medium supplemented with 0.35% serum for 1 h at room temperature. Then, the nanoparticles were added to the cells for 4 h. Afterward, cells were washed with PBS twice and supplied with fresh Leibovitz medium containing 10% serum. Images were taken on a CLSM as described above. For flow cytometry analysis, hTM cells were grown in 24-well plates. Once they reached about 70% confluence, they were treated as described above. After the incubation period, cells were washed with PBS, harvested by trypsinization, washed again and re-suspended in PBS. Cells were kept on ice until measurement on a FACS Calibur (BD GmbH, Heidelberg, Germany) with excitation at 488 nm and fluorescence emission detection with a 530/30 nm bandpass filter. Flowing software was used for the analysis.
CTGF Gene Silencing In Vitro:
hTM cells (passage 5 to 7) were grown in 6-well cell culture dishes. After reaching 80% confluency, cells were cultivated for 24 h without serum and another 24 h with the addition of 1 ng mL–1 TGF-β2 or left as untreated control. Nanoparticles were prepared at a concentration of 80 μg mL–1 in Leibovitz medium containing 0.35% serum and 1 ng mL–1 TGF-β2 and left for 1 h at room temperature for the formation of a protein corona. Cells were incubated for an additional 4 h with nanoparticles, washed with PBS once and left for 24 h in serum-supplemented medium. Thereafter, cells were cultured for an additional 24 h without serum before RNA and protein extraction followed by mRNA/RT-PCR analysis and Western Blotting as described above. Lipoplexes fabricated with RNAiMAX (ThermoFisher Scientific, Darmstadt, Germany) served as positive control.
In Vivo Experiments with Transgenic Animals:
All procedures conformed to the tenets of the National Institutes of Health Guidelines on the Care and Use of Animals in Research, the EU Directive 2010/63/E and the ARVO Statement for the Use of Animals in Ophthalmic and Vision Research, and were approved by the local authorities (54–2532.1–44/12; Regierung der Oberpfalz, Bavaria, Germany). Transgenic βB1-CTGF1 mice were generated as described previously[14] and compared to WT mice. Transgenic Tie2-GFP mice that express GFP under a Tie2-promoter[49] were housed under standardized conditions of 62% air humidity and 21 °C room temperature. Feeding was ad libitum and animals were kept at a 12 h light/dark cycle (6 am to 6 pm). To evaluate differences in CD44 expression on the mRNA level, six 2-month-old βB1-CTGF1 and WT mice were euthanized by exarticulation of the atlanto-occipital joint. Corneal-scleral rings were dissected, the anterior eye segment was separated from the posterior part of the eye along the ora serata and the lens was taken out. The anterior eye segment was cut in half and most of the cornea was removed. Total RNA was extracted, analyzed by RT-PCR and quantified as described above. For immunohistochemistry, eyes of βB1-CTGF1 or WT mice were enucleated and fixed in 4% (w/v) PFA for 4 h. The eyes were equilibrated in 10%, 20% and 30% sucrose, embedded in Tissue-Tek optimal cooling temperature compound (Sakura Finetek Europe B.V., Zoeterwounde, Netherlands) and stored at –20 °C. Frozen sections with thicknesses of about 12 μm were cut on a cryostat (Microm International, Walldorf, Germany). After blocking with 2% BSA, 0.2% cold water fish skin gelatin, and 0.1% Triton X-100 in 0.1 M phosphate buffer, frozen sections were incubated with rabbit anti-CD44 (1:100; antibodies-online GmbH, Aachen, Germany) at 4 °C overnight. Afterwards, tissue sections were washed three times with 0.1 M phosphate buffer, followed by an incubation with the secondary antibody Cy3 goat anti-rabbit (1:2000, Jackson Immuno Research Europe Ltd., Suffolk, UK) for 1 h at room temperature. As a control for nonspecific binding of secondary antibodies, negative controls were performed. After washing three times with PBS, the slides were mounted using DakoCytomation fluorescent mounting medium with DAPI 1:10 (DakoCytomation, Hamburg, Germany). Slides were dried overnight at 4°C before performing fluorescence microscopy as described above.
Ex Vivo Perfusion Porcine and Human Eyes:
Fresh enucleated porcine eyes were obtained from a local abattoir. Eyes with visible damage were excluded. Two eyes from one human donor were used for the perfusion experiments. The tissue samples were obtained from cadavers donated to the Institute of Human Anatomy, University Regensburg, Germany. Experiments on human tissue were done in accordance with the provisions of the Helsinki Declaration for research involving human tissue. Prior to death, every donor bequeathed his/her body to the Institute of Human Anatomy (University Regensburg, Germany) for scientific and academic purposes by stating this in his/her last will. After the extraocular tissue was removed, the porcine and human eyes were submerged to the limbus in 0.89% NaCl at 35 °C. The perfusion system contained a perfusion chamber and a collection chamber. The infusion needle was intracamerally inserted through the transparent cornea into each eye and connected to the perfusion chamber. The needle was then carefully pushed through the pupil and the tip of the needle was placed in the posterior chamber. Then, a second needle was placed into the anterior chamber and connected to the collection reservoir. The second needle was closed during the perfusion except during the exchanging periods. First, a volume of 3 mL nanoparticles (0.25 mg mL–1) was exchanged over a time period of about 10–15 min. In the next step, the collection chamber was closed, and the eyes were perfused with nanoparticles at a constant pressure of 10 mmHg for 3 h. Then, a second exchange with 3 mL of a glucose solution (5 × 10⁻³ M) was performed to remove the remaining nanoparticles which took 10–15 min, followed by a second perfusion for 2 h with glucose (5 × 10⁻³ M) to wash out unbound nanoparticles. The anterior chamber of the porcine and human eyes was dissected and most of the sclera and the cornea were removed. For visualization of nanoparticle distribution, the whole outflow ring was analyzed using the Observer Z1 microscope (Zeiss GmbH, Oberkochen, Germany). Afterward, the tissue was separated into small pieces and fixed with 4% (w/v) PFA for 4 h and washed three times with 0.1 M phosphate buffer. Tissue pieces were equilibrated in 10%, 20% and 30% sucrose, embedded in Tissue-Tek optimal cooling temperature compound and stored at –20 °C. Frozen sections with a thickness of about 12 μm were performed on a cryostat. Immunohistochemistry was performed as described above. Antibodies were used as follows: mouse anti-CD44 (1:100; R&D systems, Minneapolis, Germany), goat anti-CD31 (1:100, R&D systems, Minneapolis, Germany) secondary antibody Alexa Fluor 488-conjugated anti-mouse IgG (1:1000, Invitrogen, Darmstadt, Germany), biotinylated anti-goat IgG (H+L) (1:500, Vector Laboratories, Burlingame, CA, USA), and Streptavidin Alexa Fluor 488 (Invitrogen, Carlsbad, USA). Images were taken by confocal microscopy in the multitracking mode as described above.
Ex Vivo Perfusion of Murine Eyes:
Two-month-old mice were euthanized by exarticulation of the atlanto-occipital joint and eyes were enucleated with forceps. A 34G beveled needle connected to a syringe was then introduced through the center of the cornea, with the tip of the needle being carefully positioned within the anterior chamber. After ensuring correct cannulation of the anterior chamber, a small volume of 5 × 10⁻³ M glucose solution containing nanoparticles (0.25 mg mL–1) was injected through the needle into the anterior chamber just until the globe started to pressurize. The needle was then connected to a perfusion reservoir which was used to set and maintain a constant pressure of 10 mmHg. This pressure was kept up for 1 h, while the globe was submersed in a 35 °C water bath. After 1 h of perfusion, the needle was removed and the eye was fixated by immersion in 4% (w/v) PFA for 4 h. Eyes were then equilibrated in 10%, 20%, and 30% sucrose solution. Then, the eyes were embedded in Tissue-Tek optimal cooling temperature compound and frozen. Cryosectioning was performed at a thickness of 12 μm and sagittal sections of the globe were obtained for immunohistochemistry. Immunohistochemistry was performed as described above. Antibodies were used as follows: goat anti-CD31 (1:200, R&D systems, Minneapolis, Germany), biotinylated anti-goat IgG (H+L) and Streptavidin Alexa Fluor 488 (Invitrogen, Carlsbad, USA). Images were acquired by confocal microscopy in the multitracking mode as described above.
Statistical Analysis:
Sigma Plot 12.0 software was used for statistical analysis. For the evaluation of the gene silencing results, a one-way ANOVA of the ΔΔct-values was conducted followed by a Holm-Sidak-test. Student’s t-test was used for statistical analysis of RNA and protein data and the analysis of perfusion experiments.
Supplementary Material
Acknowledgements
A.E.D. and M.G. contributed equally to this work. This work was supported by Grant Deutsche Forschungsgemeinschaft (DFG, Grant numbers BR 3566/3–1 and FU734/4–1). The authors thank Renate Liebl and Silvia Babl for excellent technical assistance. The authors thank Katherine Fein for careful revision of the manuscript.
Footnotes
Conflict of Interest
The authors declare no conflict of interest.
Supporting Information
Supporting Information is available from the Wiley Online Library or from the author.
Contributor Information
Andrea E. Dillinger, Department of Human Anatomy and Embryology University Regensburg Universitaetsstrasse 31, 93040 Regensburg, Germany
Michaela Guter, Department of Pharmaceutical Technology University Regensburg Universitaetsstrasse 31, 93040 Regensburg, Germany.
Franziska Froemel, Department of Human Anatomy and Embryology University Regensburg Universitaetsstrasse 31, 93040 Regensburg, Germany.
Gregor R. Weber, Department of Human Anatomy and Embryology University Regensburg Universitaetsstrasse 31, 93040 Regensburg, Germany
Kristin Perkumas, Department of Ophthalmology Duke University 2351 Erwin Road, Durham, NC 27710, USA.
W. Daniel Stamer, Department of Ophthalmology Duke University 2351 Erwin Road, Durham, NC 27710, USA.
Andreas Ohlmann, Department of Ophthalmology Ludwig-Maximilians-University Munich 80336 Munich, Germany.
Rudolf Fuchshofer, Department of Human Anatomy and Embryology University Regensburg Universitaetsstrasse 31, 93040 Regensburg, Germany.
Miriam Breunig, Department of Pharmaceutical Technology University Regensburg Universitaetsstrasse 31, 93040 Regensburg, Germany.
References
- [1].Hons Y-CT, Li X, Wong TY, Quigley HA, Aung T, Cheng C-Y, Ophthalmology 2014, 121, 2081. [DOI] [PubMed] [Google Scholar]
- [2].Braunger BM, Fuchshofer R, Tamm ER, Eur.J. Pharm. Biopharm. 2015, 95, 173. [DOI] [PubMed] [Google Scholar]
- [3].Overby DR, Stamer WD, Johnson M, Exp. Eye Res. 2009, 88, 656. [DOI] [PMC free article] [PubMed] [Google Scholar]
- [4].Turner SA, McNaught AI, Expert Rev. Ophthalmol. 2013, 8, 587. [Google Scholar]
- [5].Pita-Thomas DW, Goldberg JL, Curr. Opin. Ophthalmol. 2013, 24, 130. [DOI] [PubMed] [Google Scholar]
- [6].Angeles Solinis SM, del Pozo-Rodríguez A, Apaolaza PS, Rodríguez-Gascón A, Eur. J. Pharm. Biopharm. 2015, 95, 331. [DOI] [PubMed] [Google Scholar]
- [7].Oliveira AV, da Costa AMR, Silva GA, Mater. Sci. Eng., C 2017, 77, 1275. [DOI] [PubMed] [Google Scholar]
- [8].Mashal M, Attia N, Puras G, Martínez-Navarrete G, Fernández E, Pedraz JL, J. Controlled Release 2017, 254, 55. [DOI] [PubMed] [Google Scholar]
- [9].Rajala A, Wang Y, Zhu Y, Ranjo-Bishop M, Ma J-X, Mao C, Rajala RVS, Nano Lett. 2014, 14, 5257. [DOI] [PMC free article] [PubMed] [Google Scholar]
- [10].Blasche M, Kawasaki S, Kampik D, Branch MJ, Robinson M, Larkin DF, Smith AJ, Ali RR, Hum. Gene Ther. 2018, 29, 10.1089/hum.2018.115. [DOI] [PubMed] [Google Scholar]
- [11].Tamm ER, Exp. Eye Res. 2009, 88, 648. [DOI] [PubMed] [Google Scholar]
- [12].Overby DR, Zhou EH, Vargas-Pinto R, Pedrigi RM, Fuchshofer R, Braakman ST, Gupta R, Perkumas KM, Sherwood JM, Vahabikashi A, Dang Q, Kim JH, Ethier CR, Stamer WD, Fredberg JJ, Johnson M, Proc. Natl. Acad. Sci. USA 2014, 111, 13876. [DOI] [PMC free article] [PubMed] [Google Scholar]
- [13].Vranka JA, Kelley MJ, Acott TS, Keller KE, Exp. Eye Res. 2015, 133, 112. [DOI] [PMC free article] [PubMed] [Google Scholar]
- [14].Junglas B, Kuespert S, Seleem AA, Struller T, Ullmann S, Boesl M, Bosserhoff A, Köstler J, Wagner R, Tamm ER, Fuchshofer R, Am. J. Pathol. 2012, 180, 2386. [DOI] [PubMed] [Google Scholar]
- [15].Junglas B, Yu AHL, Welge-Luessen U, Tamm ER, Fuchshofer R, Exp. Eye Res. 2009, 88, 1065. [DOI] [PubMed] [Google Scholar]
- [16].Guzman-Aranguez A, Loma P, Pintor J, Br. J. Pharmacol. 2013, 170, 730. [DOI] [PMC free article] [PubMed] [Google Scholar]
- [17].Thakur A, Fitzpatrick S, Zaman A, Kugathasan K, Muirhead B, Hortelano G, Sheardown H, J. Biol. Eng. 2012, 6, 7. [DOI] [PMC free article] [PubMed] [Google Scholar]
- [18].Tam LCS, Reina-Torres E, Sherwood JM, Cassidy PS, Crosbie DE, Luetjen-Drecoll E, Flügel-Koch C, Perkumas K, Humphries MM, Kiang A-S, O’Callaghan J, Callanan JJ, Read AT, Ethier CR, O’Brien C, Lawrence M, Campbell M, Stamer WD, Overby DR, Humphries P, Sci. Rep. 2017, 7, 40717. [DOI] [PMC free article] [PubMed] [Google Scholar]
- [19].Kanasty R, Dorkin JR, Vegas A, Anderson D, Nat. Mater. 2013, 12, 967. [DOI] [PubMed] [Google Scholar]
- [20].Johnson M, Johnson DH, Kamm RD, DeKater AW, Epstein DL, Exp. Eye Res. 1990, 50, 407. [DOI] [PubMed] [Google Scholar]
- [21].Overby DR, Gong H, Qiu G, Freddo TF, Johnson M, Invest. Ophthalmol. Visual Sci. 2002, 43, 3455. [PubMed] [Google Scholar]
- [22].Acott TS, Kelley MJ, Exp. Eye Res. 2008, 86, 543. [DOI] [PMC free article] [PubMed] [Google Scholar]
- [23].Stamer WD, Roberts BC, Howell DN, Epstein DL, Invest. Ophthalmol. Visual Sci. 1998, 39, 1804. [PubMed] [Google Scholar]
- [24].Dosio F, Arpicco S, Stella B, Fattal E, Adv. Drug Delivery Rev. 2016, 97, 204. [DOI] [PubMed] [Google Scholar]
- [25].Elbakry A, Zaky A, Liebl R, Rachel R, Goepferich A, Breunig M, Nano Lett. 2009, 9, 2059. [DOI] [PubMed] [Google Scholar]
- [26].Tamm ER, Braunger BM, Fuchshofer R, in Progress in Molecular Biology and Translational Science, Vol. 134 (Eds: Hejtmancik JF, Nickerson JM), Elsevier Inc., Amsterland, The Netherlands: 2015, Ch. 18. [Google Scholar]
- [27].Tamm ER, Fuchshofer R, Surv. Ophthalmol. 2007, 52, S101. [DOI] [PubMed] [Google Scholar]
- [28].Lungwitz U, Breunig M, Blunk T, Goepferich A, Eur. J. Pharm. Biopharm. 2005, 60, 247. [DOI] [PubMed] [Google Scholar]
- [29].Guter M, Breunig M, Eur.J. Pharm. Biopharm 2017, 113, 34. [DOI] [PubMed] [Google Scholar]
- [30].Tripathi RC, Millard CB, Tripathi BJ, Exp. Eye Res. 1989, 48, 117. [DOI] [PubMed] [Google Scholar]
- [31].Bhattacharjee S,Controlled Release J 2016, 235, 337. [DOI] [PubMed] [Google Scholar]
- [32].Wurster E-C, Liebl R, Michaelis S, Robelek R, Wastl DS, Giessibl FJ, Goepferich A, Breunig M, ACS Appl. Mater. Interfaces 2015, 7, 7891. [DOI] [PubMed] [Google Scholar]
- [33].Li J, Xue S, Mao Z-W, J. Mater. Chem. B 2016, 4, 6620. [DOI] [PubMed] [Google Scholar]
- [34].Tenzer S, Docter D, Kuharev J, Musyanovych A, Fetz V, Hecht R, Schlenk F, Fischer D, Kiouptsi K, Reinhardt C, Landfester K, Schild H, Maskos M, Knauer SK, Stauber RH, Nat. Nano-technol. 2013, 8, 772. [DOI] [PubMed] [Google Scholar]
- [35].Walkey CD, Chan WCW, Chem. Soc. Rev. 2012, 41, 2780. [DOI] [PubMed] [Google Scholar]
- [36].Almalik A, Benabdelkamel H, Masood A, Alanazi IO, Alradwan I, Majrashi MA, Alfadda AA, Alghamdi WM, Alrabiah H, Tirelli N, Alhasan AH, Sci. Rep. 2017, 7, 10542. [DOI] [PMC free article] [PubMed] [Google Scholar]
- [37].Janagam DR, Wu L, Lowe TL, Adv. Drug Delivery Rev 2017, 122, 31. [DOI] [PMC free article] [PubMed] [Google Scholar]
- [38].Siggers JH, Ethier CR, Annu. Rev. Fluid Mech. 2012, 44, 347. [Google Scholar]
- [39].Tomasetti L, Breunig M, Adv. Healthcare Mater. 2017, 16, 1700739. [DOI] [PubMed] [Google Scholar]
- [40].Tomasetti L, Liebl R, Wastl DS, Breunig M, Eur. J. Pharm. Biopharm. 2016, 108, 145. [DOI] [PubMed] [Google Scholar]
- [41].Martens TF, Peynshaert K, Nascimento TSL, Fattal E, Karlstetter M, Langmann T, Picaud S, Demeester J, De Smedt SC, Remaut K, Braeckmans K, Eur. J. Pharm. Sci. 2017, 103, 27. [DOI] [PubMed] [Google Scholar]
- [42].Martens TF, Remaut K, Deschout H, Engbersen JFJ, Hennink WE, van Steenbergen MJ, Demeester J, De Smedt SC, Braeckmans K, J. Controlled Release 2015, 202, 83. [DOI] [PubMed] [Google Scholar]
- [43].Dreaden EC, Morton SW, Shopsowitz KE, Choi J-H, Deng ZJ, Cho N-J, Hammond PT, ACS Nano 2014, 8, 8374. [DOI] [PMC free article] [PubMed] [Google Scholar]
- [44].Pang I-H, Shade DL, Clark AF, Steely HT, DeSantis L, Curr. Eye Res. 1994, 13, 51. [DOI] [PubMed] [Google Scholar]
- [45].Fuchshofer R, Yu AHL, Welge-LUssen U, Tamm ER, Invest. Opthalmol. Visual Sci. 2007, 48, 715. [DOI] [PubMed] [Google Scholar]
- [46].Klitzing RV, Moehwald H, Macromolecules 1996, 29, 6901. [Google Scholar]
- [47].Wen C-Y, Tang M, Hu J, Wu L-L, Pang D-W, Zeng J-B, Li X-Y, Anal. Chem. 2016, 88, 10134. [DOI] [PubMed] [Google Scholar]
- [48].Arnold MM, Gorman EM, Schieber LJ, Munson EJ, Berkland C, J. Controlled Release 2007, 121, 100. [DOI] [PMC free article] [PubMed] [Google Scholar]
- [49].Motoike T, Loughna S, Perens E, Roman BL, Liao W, Chau TC, Richardson CD, Kaware T, Kuno J, Weinstein BM, Stainier DYR, Sato TN, genesis 2000, 28, 75. [DOI] [PubMed] [Google Scholar]
Associated Data
This section collects any data citations, data availability statements, or supplementary materials included in this article.