Abstract
The Transmission Disequilibrium Test (TDT) is the gold standard for testing the association between a genetic variant and disease in samples consisting of affected individuals and their parents. In practice, more complex pedigree structures, i.e., siblings with no parents, or three-generational pedigrees with possibly missing genotypes, are common. There are several generalizations of the TDT that are suitable for use with arbitrary pedigree structures. We consider three such frequently used generalizations, FBAT, PDT, and GDT, that have accompanying software and compare them regarding validity and power in the single variant setting. We use simulations to study the effects of population admixture, populations whose genotypes are not in Hardy-Weinberg Equilibrium (HWE), different pedigree structures, and the presence of linkage. Whereas our results show that some TDT generalizations can have a substantially increased type 1 error, these tests are often used in substantive research without caveats about the validity of their type 1 error. For the association analysis of rare variants in sequencing studies, region-based extensions of the TDT generalizations, that rely on the postulated robustness of the single variant tests, have been proposed. We discuss the implications of our results for these region-based extensions.
Keywords: family-based association test, TDT, population admixture, Hardy-Weinberg equilibrium, type 1 error
Introduction
The original TDT (Spielman, McGinnis, & Ewens, 1993) assesses the allelic transmission rates from heterozygous parents to their affected offspring in trios. A deviation from Mendel’s law implies association of the allele and the phenotype. The TDT was proposed as a joint test of linkage and association, as a test for linkage in the presence of association, and as a test for association in the presence of linkage. These days, however, the TDT is almost used exclusively as association test (N. M. Laird & Lange, 2006). The transmission-based approach has the fundamental advantage that the family information is utilized so that the statistic does not require assumptions about the founder genotype distribution and is robust against population admixture or population substructure.
To address scenarios with missing parental information, with additional siblings and with unaffected offspring, the 1-TDT, S-TDT and RC-TDT extensions of the TDT were proposed (Knapp, 1999; Spielman & Ewens, 1998; Sun, Flanders, Yang, & Khoury, 1999).
To include more general family structures, several TDT generalizations, including the PDT (Martin, Monks, Warren, & Kaplan, 2000), FBAT (Lake, Blacker, & Laird, 2000) and the GDT (W.-M. Chen, Manichaikul, & Rich, 2009), were developed.
Martin et al. derived the Pedigree Disequilibrium Test (PDT) (Martin et al., 2000) so that it includes informative nuclear triads and informative discordant sibships from extended pedigrees without treating them as independent. Later, Martin et al. proposed test statistics PDT-AVE and PDT-SUM with weights that can correct for potential biases that occur in the presence of linkage (Martin, Bass, & Kaplan, 2001).
The Family-Based Association Test (FBAT) is a generalization of the TDT which is based on a score-based test statistic (Lake et al., 2000; Rabinowitz & Laird, 2000). The FBAT approach breaks extended pedigrees into nuclear families and can deal with missing parental genotypes and arbitrary phenotypes. In the scenario of missing parental genotype information, the test statistic is computed by conditioning on the sufficient statistic, as described in the paper by Rabinowitz and Laird (Rabinowitz & Laird, 2000). The FBAT test statistic uses analytical expressions for the variance of the test statistic assuming no linkage. The empirical FBAT-ev was introduced to deal with the correlation between multiple siblings and nuclear families in the presence of linkage (Lake et al., 2000).
In 2009, Chen et al. developed the Generalized Disequilibrium Test (GDT) (W.-M. Chen et al., 2009). The GDT can utilize the full information of extended pedigrees without breaking them into multiple nuclear families and does not require that all genotypes are available. Similar to association tests that have been developed for unrelated individuals, the method computes genotype differences between discordant pedigree members and accounts for the family structure through the incorporation of kinship coefficients or IBD estimates. The GDT-PO is a special case of the GDT that considers only parent-offspring pairs.
All these single variant association tests are implemented in user-friendly software packages to analyze family-based studies and provide asymptotic association p-values based on the assumption that the sample size is large enough such that asymptotic theory applies.
In this communication, we compare the type 1 error rates and power of FBAT (analytical FBAT and empirical version FBAT-ev), GDT, GDT-PO, and PDT-AVE in comprehensive simulation studies. We will refer to PDT-AVE as PDT in the following. We consider different pedigree structures, different null hypotheses and investigate the corresponding robustness of the type 1 error against population admixture, deviations from Hardy-Weinberg equilibrium (HWE) and strong linkage. Here, we refer to population admixture as the scenario of within-family genetic background differences in founders.
Since the single variant TDT generalizations are the basis of region-based extensions for rare variant association tests, we discuss how our findings and results transfer to this scenario. Furthermore, we include a comparison with popular and flexible mixed model approaches that were published recently.
Methods
Here, we describe the framework of the simulation studies and the different scenarios that we examine.
Design of the Simulation Studies
We simulate genotype distribution along both SNPs in founders, and the disease susceptibility locus (DSL) , that are linked and/or in linkage disequilibrium (LD), depending on the scenario under consideration (type 1 error/power).
Let be the number of members in a pedigree under consideration, where is the number of founders and the number of offspring. The distribution of family member genotypes for both SNPs is determined by the genotype distribution along both SNPs in founders, the affection status of the members in combination with the disease model, and the recombination fraction between the SNPs.
In more detail, the founder genotype distributions for the disease susceptibility locus are specified by Here, describes the probability/frequency of a homozygous minor allele genotype, the probability of a heterozygous genotype and the probability of a homozygous major allele genotype. In addition, the founder genotype distributions for marker locus given the disease locus are specified by This explicitly defines the LD between both SNPs in founders. The connection between affection status and the genotype at SNP is described by a multiplicative relative risk model with relative risk and prevalence . The marker is assumed to have no direct effect on the affection status. The transmission pattern between both SNPs depends on the recombination fraction between and
Given specific values for these parameters, we can compute the conditional probabilities for all member genotype configurations at both SNPs, similar as described in Appendix C of Chen et al. (W.-M. Chen et al., 2009). Based on these conditional probabilities, it is straightforward to simulate independent replicates for every fixed setting.
To investigate and compare the type 1 error rates and power between the five association test statistics, we analyze different pedigrees and different founder genotype distribution schemes. Below, we describe the general structure of the scenarios and parameter combinations. The specific values for all parameters in each scenario are described in the Supplementary Tables 1 and 2 (Section A).
We consider sample sizes of and , where denotes the number of independent families, describing a fixed pedigree scenario. For FBAT, we include an offset of which corresponds to the population prevalence of the disease in the simulated data and is included in the statistic to incorporate both affected and unaffected offspring (Lake et al., 2000). Although a suitable offset can increase the statistical power of the test, it does not affect its type 1 error.
Pedigrees
We consider six different pedigrees. The different pedigree types are shown in Figure 1. The first pedigree P1 is the classical affected offspring trio with unaffected parents. For this pedigree, FBAT and TDT are equivalent. In addition, we consider two three-generation-pedigrees, P2 and P3, and a nuclear family P4 with four affected offspring. The pedigrees P2 and P4 are adopted from the simulation study in Chen et al. (W.-M. Chen et al., 2009) (pedigrees C2 and N4). Pedigree P5 is adopted from a recent publication where three families with multiple ADHD-affected members were analyzed (Supplementary Figure 1 in (Corominas et al., 2018)). Pedigree P6 has the same pedigree structure, but founders and one offspring are set to missing. The affection status of two offspring in the third generation is changed to unaffected (Figure 1).
Figure 1:
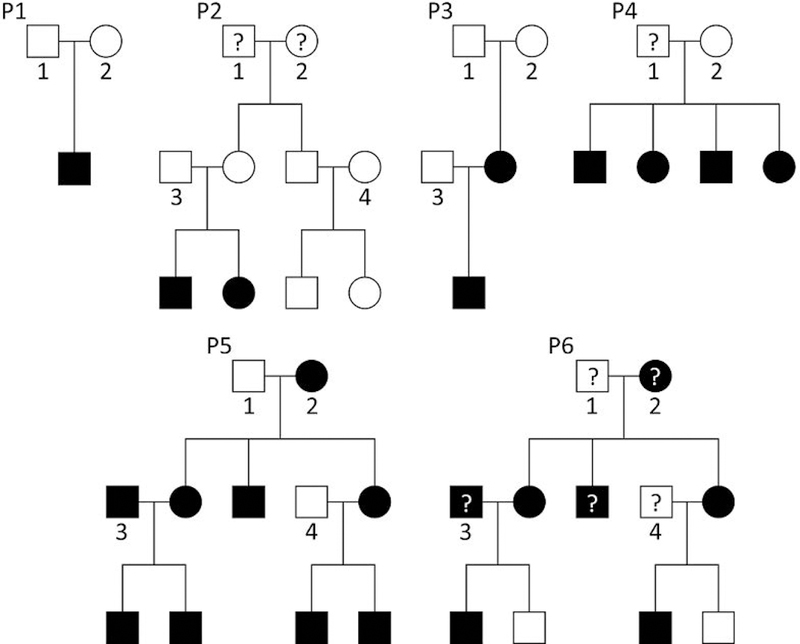
Pedigree structure for the six different pedigree types P1, P2, P3, P4, P5, and P6. A question mark indicates that the individual was excluded from the association test and has missing genotypes. Shaded individuals are considered affected. The founders in each pedigree are enumerated to describe the founder genotype distributions.
Type 1 error
We consider three different null hypotheses: no association in the absence of linkage (nAnL), no association in the presence of linkage (nAL), and association in the absence of linkage (AnL). However, we will mainly focus on the null hypothesis of no association in the absence of linkage. For the type 1 error rate analysis, the association tests are applied to the genotype data for marker . Here, we select describing the genotype distribution for the DSL in Hardy-Weinberg equilibrium (HWE) with a MAF of 30%.
No association in the absence of linkage
No association means that we impose no LD between the marker locus and the disease locus in the founders, by setting To enforce the null hypothesis of no association in absence of linkage, we choose a recombination faction of . We select a relative risk of and an arbitrary prevalence for the simulations, e.g. no genetic effect of the locus D on affection status. As there is no association and no linkage between both SNPs, the choice of the disease parameters for the DSL does not influence the results.
For all pedigrees P1-P6, we simulate three different founder genotype distributions. In the first scenario (U), all founders are simulated independently from a genotype distribution with the same minor allele frequency (MAF) that satisfies the assumption of HWE. In the second scenario (HWE-D), all founder genotype distributions have the same MAF, but the founder genotype distributions deviate from the expected HWE proportions with an inbreeding coefficient of . In the last scenario, we simulate the effect of admixture (ADM). For this scenario, we use the Balding-Nichols model (Balding & Nichols, 1995) with to draw subpopulation-specific allele frequencies that deviate from the ancestral frequency. Given the fixed subpopulation-specific allele frequency, the genotype distribution is assumed to satisfy HWE proportions.
No association in the presence of linkage
We also consider pedigrees P2, P3, P4, P5, and P6 under the null hypothesis of no association in the presence of linkage, assuming no LD as described above. We exclude pedigree P1 since the presence of linkage only has an impact if multiple offspring are included. The recombination fraction is in this set of simulations. We select a prevalence of and a relative risk of , describing a large effect size in combination with strong linkage. To analyze the impact of linkage only, we restrict the scenarios to founder genotype distributions with a common marker MAF of 30%, HWE proportions and a sample size of .
Association in the absence of linkage
We consider the pedigrees P1 to analyze the type 1 error under the null hypothesis of association in the absence of linkage. For this analysis, we assign one parent as affected, instead of two unaffected parents. The founder genotype distribution is and we impose a relative risk of and a prevalence of The recombination fraction is set to forcing the SNPs to be unlinked. The founder genotype distribution for marker is specified by a genotype copy of the corresponding genotype for the DSL , introducing LD (association) between both SNPs. This null hypothesis is of interest, Ewens and Spielman demonstrated that population substructure and admixture in combination with migration can introduce association in absence of linkage (Ewens & Spielman, 1995). It is important to recall that the TDT remains a valid test for association or linkage in this scenario, as both, linkage and association, are required to reject the null hypothesis.
Power
For the power analysis, we specify founder genotype distributions for the DSL according to the U scenario (equal MAF and HWE proportions), but in combination with a relative risk of and a disease prevalence of We apply the association tests directly to the genotype data for the DSL to circumvent the impact of different choices of LD and linkage in the power analysis, describing a scenario with perfect LD and perfect linkage between and .
Results
All empirical results are based on 100,000 independent replicates for each specific combination of pedigree, scenario, MAF and sample size. For FBAT and FBAT-ev, we choose . In the Supplementary Material, we provide the quantile-quantile-plots (qq-plots) for all simulations (Supplementary Figures (Section D)). Here, we describe the results and pick important scenarios that characterize our findings.
No association, no linkage
First, we consider the type 1 error under the null hypothesis of no association and no linkage between the marker and the DSL . Note that for pedigrees P1 and P4, the GDT test statistic equals the GDT-PO test statistic. Furthermore, the PDT implementation cannot be applied to pedigree P4.
The results for this analysis are visualized and reported in Figures 2–9, Tables 1–6 and the Supplementary Figures in Section D of the Supplementary Material.
Figure 2:
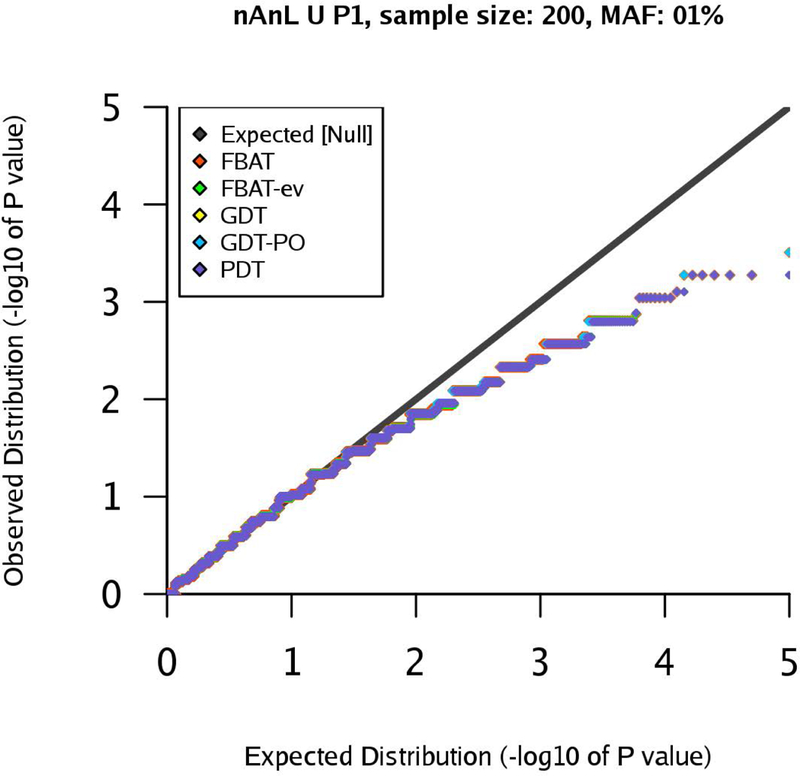
qq-plots for pedigree P1 in the nAnL U scenario, marker MAF 1%, sample size .
Figure 9:
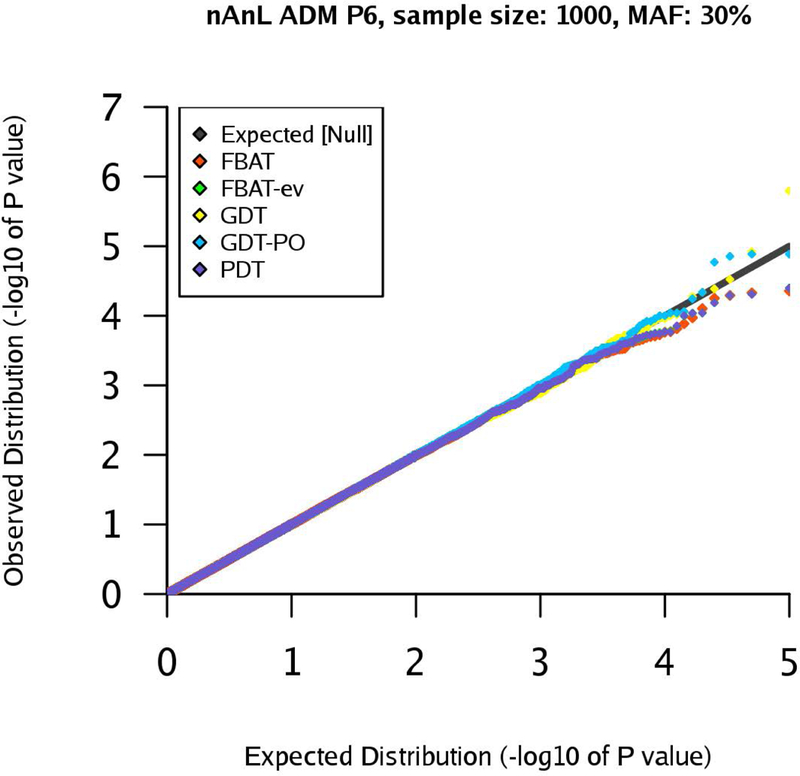
qq-plots for pedigree P6 in the nAnL ADM scenario, marker MAF 30%, sample size .
Table 1.
Empirical analysis for the nAnL null hypothesis for pedigree P3, sample size and MAF of 30% in the ADM scenario. The first two columns report the empirical mean and empirical variance of the z-scores for the five association tests. The last three columns report the proportion of association p-values below a specific significance level. All results based on 100,000 replicates.
| emp. mean z | emp. variance z | α = 0.05 | α = 0.01 | α = 0.001 | |
|---|---|---|---|---|---|
| FBAT | −0.0021 | 1.0036 | 0.0499 | 0.0096 | 0.001 |
| FBAT-ev | 0.0035 | 1.0033 | 0.0504 | 0.0094 | 0.0009 |
| GDT | 0.0498 | 1.0096 | 0.0519 | 0.0104 | 0.0009 |
| GDT-PO | 0.0947 | 1.0121 | 0.0523 | 0.0109 | 0.0011 |
| PDT | −0.0026 | 1.0033 | 0.0511 | 0.01 | 0.0009 |
Table 6.
Empirical analysis for the nAnL null hypothesis for pedigree P4, sample size and marker MAF of 30% in the HWE-D scenario. The first two columns report the empirical mean and empirical variance of the z-scores for the five association tests. The last three columns report the proportion of association p-values below a specific significance level. All results based on 100,000 replicates.
| emp. mean z | emp. variance z | α = 0.05 | α = 0.01 | α = 0.001 | |
|---|---|---|---|---|---|
| FBAT | −0.0014 | 0.997 | 0.0487 | 0.0096 | 0.0008 |
| FBAT-ev | −0.0014 | 0.997 | 0.048 | 0.0094 | 0.0008 |
| GDT | 0.0048 | 1.0219 | 0.053 | 0.0114 | 0.0012 |
| GDT-PO | 0.0048 | 1.0219 | 0.053 | 0.0114 | 0.0012 |
| PDT | - | - | - | - | - |
We start with the uniform scenario U. If the sample size is large, the results show that all tests control the type 1 error rates appropriately (Supplementary Figures). If the sample size is small, , we observe deviations from the nominal level, especially for a MAF of 1% and 5%. This is expected due to the discreteness of the underlying distribution when sample size and MAF decrease, leading to a deviation from the asymptotic setting. This can be observed in Figures 2 and 3 for a MAF of 1%.
Figure 3:
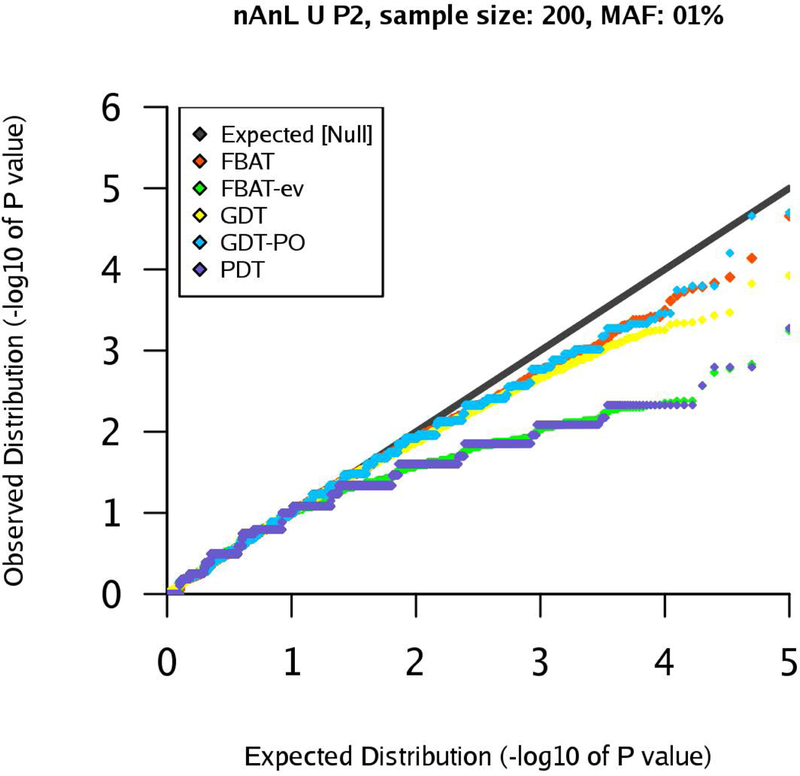
qq-plots for pedigree P2 in the nAnL U scenario, marker MAF 1%, sample size .
Next, we consider the scenario ADM that mimics the presence of population stratification within the pedigree. For pedigree P1, the results are similar to the corresponding results for the scenario U (see Supplementary Figures (Section D)). However, the results for pedigrees P2 and P4 show that the type 1 errors of the GDT are substantially inflated in the ADM scenario (GDT and GDT-PO are equivalent for P4). The inflation grows with increasing sample size and the observed type 1 error rates are clearly above the expected type 1 error rates (Figures 4–7). The GDT is based on the assumption that, under the null hypothesis, all genotypic means are equal. However, in our ADM scenario, this assumption is not satisfied since the founder genotype distributions have slightly different MAFs. This explains the substantial inflation of the type 1 error. The GDT-PO maintains the type 1 error rate in the ADM scenario for pedigree P2, as the GDT-PO only incorporates information from the single nuclear family with affected offspring in the second generation (Figures 4 and 5). This weakens the impact of population admixture compared to the GDT. For the small sample size , GDT and GDT-PO control the type 1 error in the ADM scenario for pedigree P3 (Table 1). For and pedigree P3, the inflation of the GDT-PO is increased (Table 2). We observe that the mean of the z-scores for the GDT and GDT-PO is not zero and the mean grows with the sample size (Table 1 and 2). For pedigree P5, GDT-PO provided inflated type 1 error rates (Figure 8). For pedigree P6, all five association tests provide controlled type 1 error rates (Figure 9). If the sample is large, FBAT, FBAT-ev and PDT have well-controlled type 1 error rates in the ADM scenario along all pedigrees (except P4 for PDT), comparable with the U scenario (Supplementary Figures (Section D)).
Figure 4:
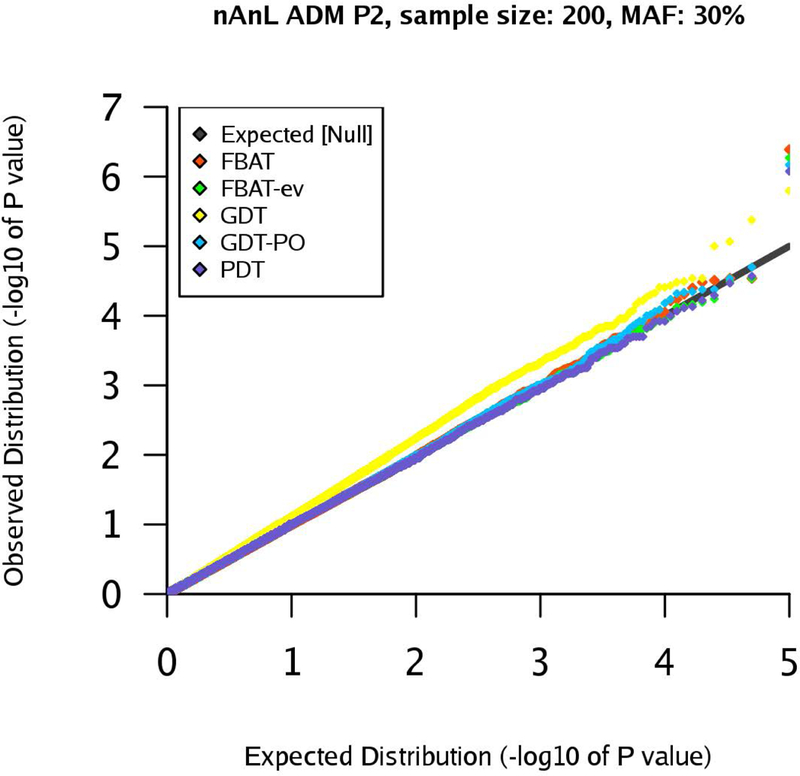
qq-plots for pedigree P2 in the nAnL ADM scenario, marker MAF 30%, sample size .
Figure 7:
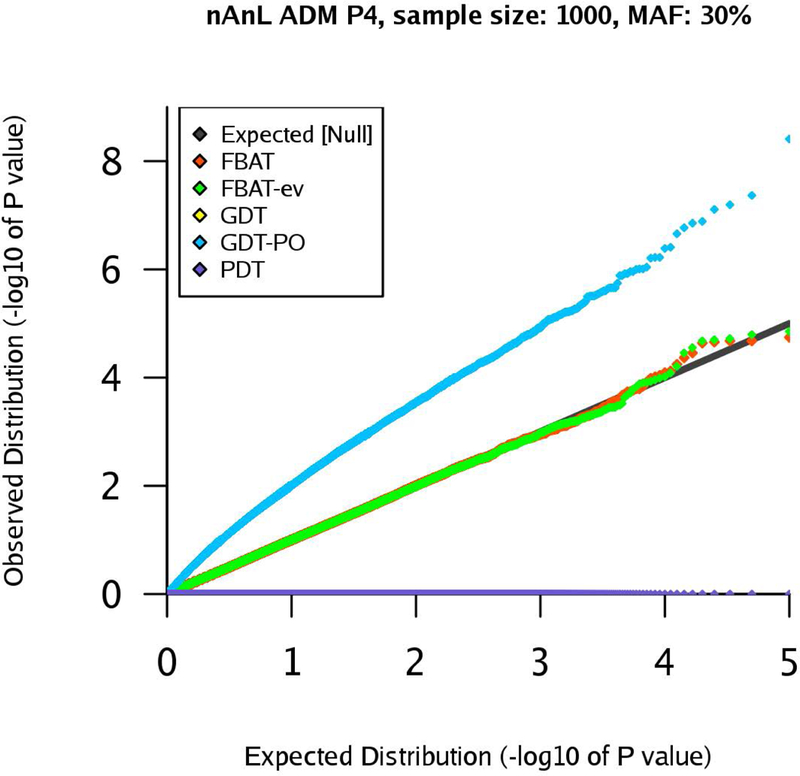
qq-plots for pedigree P4 in the nAnL ADM scenario, marker MAF 30%, sample size .
Figure 5:
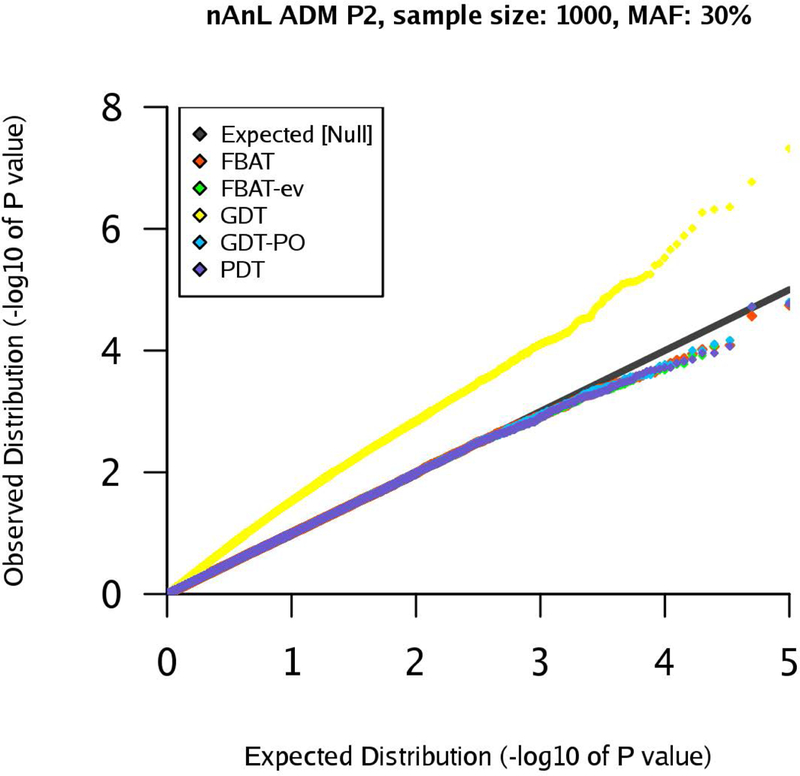
qq-plots for pedigree P2 in the nAnL ADM scenario, marker MAF 30%, sample size .
Table 2.
Empirical analysis for the nAnL null hypothesis for pedigree P3, sample size and marker MAF of 30% in the ADM scenario. The first two columns report the empirical mean and empirical variance of the z-scores for the five association tests. The last three columns report the proportion of association p-values below a specific significance level. All results based on 100,000 replicates.
| emp. mean z | emp. variance z | α = 0.05 | α = 0.01 | α = 0.001 | |
|---|---|---|---|---|---|
| FBAT | −0.0009 | 0.9977 | 0.0497 | 0.0102 | 0.0011 |
| FBAT-ev | 0.0017 | 0.998 | 0.0496 | 0.0102 | 0.001 |
| GDT | 0.1123 | 1.0055 | 0.0518 | 0.0115 | 0.0012 |
| GDT-PO | 0.2161 | 1.0186 | 0.0576 | 0.0132 | 0.0016 |
| PDT | −0.0009 | 0.998 | 0.0503 | 0.0107 | 0.0011 |
Figure 8:
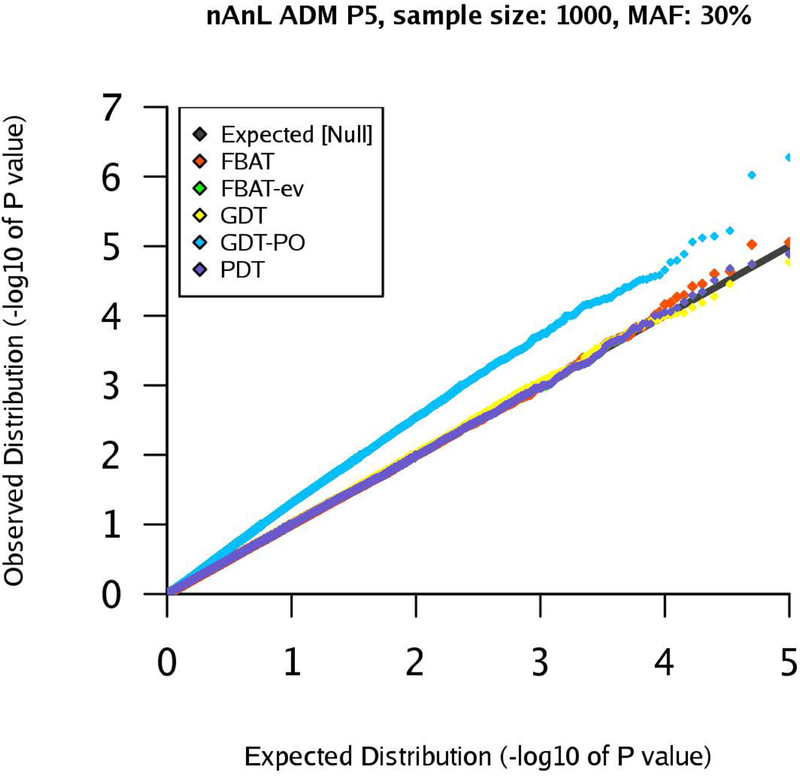
qq-plots for pedigree P5 in the nAnL ADM scenario, marker MAF 30%, sample size .
In the HWE-D scenario, we observe slightly deflated results for the GDT and GDT-PO for pedigree P1 and the deviation is constant along both sample sizes (Tables 3 and 4). This can be explained by the following derivations. For pedigree P1, the z-score of the GDT (and GDT-PO) can be computed as (W.-M. Chen et al., 2009)
where
and
Table 3.
Empirical analysis for the nAnL null hypothesis for pedigree P1, sample size and marker MAF of 20% in the HWE-D scenario. The first two columns report the empirical mean and empirical variance of the z-scores for the five association tests. The last three columns report the proportion of association p-values below a specific significance level. All results based on 100,000 replicates.
| emp. mean z | emp. variance z | α = 0.05 | α = 0.01 | α = 0.001 | |
|---|---|---|---|---|---|
| FBAT | −0.0028 | 0.9919 | 0.0491 | 0.009 | 0.0007 |
| FBAT-ev | −0.0027 | 0.9919 | 0.0492 | 0.0089 | 0.0007 |
| GDT | 0.0004 | 0.9627 | 0.0468 | 0.0086 | 0.0007 |
| GDT-PO | 0.0004 | 0.9627 | 0.0468 | 0.0086 | 0.0007 |
| PDT | 0.0003 | 0.9919 | 0.0506 | 0.0093 | 0.0007 |
Table 4.
Empirical analysis for the nAnL null hypothesis for pedigree P1, sample size and marker MAF of 20% in the HWE-D scenario. The first two columns report the empirical mean and empirical variance of the z-scores for the five association tests. The last three columns report the proportion of association p-values below a specific significance level. All results based on 100,000 replicates.
| emp. mean z | emp. variance z | α = 0.05 | α = 0.01 | α = 0.001 | |
|---|---|---|---|---|---|
| FBAT | −0.0017 | 0.9987 | 0.05 | 0.0097 | 0.0009 |
| FBAT-ev | −0.0017 | 0.9987 | 0.0501 | 0.0096 | 0.0008 |
| GDT | 0.0009 | 0.9689 | 0.0472 | 0.0091 | 0.0008 |
| GDT-PO | 0.0009 | 0.9689 | 0.0472 | 0.0091 | 0.0008 |
| PDT | 0.0009 | 0.9987 | 0.0506 | 0.0101 | 0.0009 |
Here, and denote the genotype of the mother and father in family . This implies . Since FBAT-ev controls the type 1 error rate for pedigree P1, we compare with . This gives
Given the specified founder genotype distribution, we compute
and Therefore, the z-score has variance This is in general not equal to 1 if we deviate from HWE proportions but equals 1 if HWE proportions hold. In our HWE-D setting, this gives a variance of 0.97 which is in line with the observed value in our results. It explains the deflated results of the GDT and GDT-PO, and why they are constant along different sample sizes. This is summarized by the empirical variances reported in Tables 3 and 4.
The GDT and GDT-PO also give slightly deflated results for pedigree P3 (Table 5). For pedigree P4, we observe slightly inflated results for GDT and GDT-PO for a MAF of 30% (Table 6). The GDT/GDT-PO assumes that all genetic variances are equal under the null hypothesis. Even though we consider the null hypothesis of no association and no linkage, this assumption is not satisfied within the family due to non-HWE proportions in the founder genotype distributions, resulting in an incorrectly specified variance. It is the reason for the observed deflated/inflated results of the GDT and GDT-PO in our HWE-D scenario and the miss specified variances of the z-scores in Tables 3–6. FBAT, FBAT-ev and PDT provide appropriate type 1 error rates in the HWE-D scenario for large sample sizes.
Table 5.
Empirical analysis for the nAnL null hypothesis for pedigree P3, sample size and marker MAF of 30% in the HWE-D scenario. The first two columns report the empirical mean and empirical variance of the z-scores for the five association tests. The last three columns report the proportion of association p-values below a specific significance level. All results based on 100,000 replicates.
| emp. mean z | emp. variance z | α = 0.05 | α = 0.01 | α = 0.001 | |
|---|---|---|---|---|---|
| FBAT | −0.0039 | 1.0053 | 0.0502 | 0.01 | 0.0011 |
| FBAT-ev | −0.0014 | 1.0057 | 0.0497 | 0.0101 | 0.0011 |
| GDT | 0.001 | 0.9761 | 0.0468 | 0.0094 | 0.001 |
| GDT-PO | −0.001 | 0.9856 | 0.0486 | 0.01 | 0.001 |
| PDT | 0.001 | 1.0057 | 0.0503 | 0.0105 | 0.0012 |
No association in the presence of linkage
The results are visualized/reported in Tables 7, 9, and 11 and Supplementary Figures (Section D). The GDT and GDT-PO analyses are based on the kinship coefficients. In general, it is expected that the strong linkage leads to incorrectly specified variances for FBAT, GDT, and GDT-PO, because the presence of linkage causes correlated transmissions from parents to offspring (FBAT) and it creates deviations of the IBD coefficients from the kinship coefficients (GDT and GDT-PO) (W.-M. Chen et al., 2009). The results of our simulations are in line with this expectation.
Table 7.
Empirical analysis for the nAL null hypothesis for pedigree P2, sample size nfamilies=1,000 and marker minor allele frequency of 30%. The first two columns report the empirical mean and empirical variance of the z-scores for the five association tests. The last three columns report the proportion of association p-values below a specific significance level. All results based on 100,000 replicates.
| P2l | emp. mean z | emp. variance z | α = 0.05 | α = 0.01 | α = 0.001 |
|---|---|---|---|---|---|
| FBAT | −0.0018 | 1.011 | 0.0515 | 0.0101 | 0.0011 |
| FBAT-ev | −0.0018 | 0.9922 | 0.0494 | 0.0094 | 0.001 |
| GDT | −0.0058 | 1.0103 | 0.0516 | 0.0104 | 0.0012 |
| GDT-PO | −0.002 | 1.0108 | 0.0517 | 0.0107 | 0.0012 |
| PDT | −0.002 | 0.992 | 0.0498 | 0.01 | 0.001 |
Table 9.
Empirical analysis for the nAL null hypothesis for pedigree P4, sample size nfamilies=1,000 and marker minor allele frequency of 30%. The first two columns report the empirical mean and empirical variance of the z-scores for the five association tests. The last three columns report the proportion of association p-values below a specific significance level. All results based on 100,000 replicates.
| emp. mean z | emp. variance z | α = 0.05 | α = 0.01 | α = 0.001 | |
|---|---|---|---|---|---|
| FBAT | −0.0033 | 1.0186 | 0.0529 | 0.011 | 0.0011 |
| FBAT-ev | −0.0031 | 1.0018 | 0.0506 | 0.0103 | 0.0009 |
| GDT | 0.0057 | 1.0111 | 0.0517 | 0.011 | 0.001 |
| GDT-PO | 0.0057 | 1.0111 | 0.0517 | 0.011 | 0.001 |
| PDT | - | - | - | - | - |
Table 11.
Empirical analysis for the nAL null hypothesis for pedigree P5, sample size nfamilies=1,000 and marker minor allele frequency of 30%. The first two columns report the empirical mean and empirical variance of the z-scores for the five association tests. The last three columns report the proportion of association p-values below a specific significance level. All results based on 100,000 replicates.
| emp. mean z | emp. variance z | α = 0.05 | α = 0.01 | α = 0.001 | |
|---|---|---|---|---|---|
| FBAT | −0.0034 | 1.0844 | 0.0602 | 0.0131 | 0.0016 |
| FBAT-ev | −0.0016 | 1.0095 | 0.0512 | 0.01 | 0.001 |
| GDT | 0.0039 | 1.0129 | 0.0522 | 0.0111 | 0.001 |
| GDT-PO | 0.001 | 1.0295 | 0.0541 | 0.0113 | 0.001 |
| PDT | 0.0003 | 1.0095 | 0.0517 | 0.014 | 0.0011 |
The analytical FBAT version shows slightly inflated results for the pedigrees P2, P4, and P5 (Tables 7, 9, and 11). The empirical version of FBAT-ev was designed to capture the potential correlation of transmissions and provides controlled type 1 error rates in the presence of linkage. GDT and GDT-PO are also slightly inflated for pedigrees P2, P4, and P5 (Tables 7, 9, and 11). The PDT controls the type 1 error rates for the pedigrees P2, P3, P5, and P6, it cannot be applied to pedigree P4.
Association in the absence of linkage
The corresponding results are visualized in Figure 10. We observe that GDT and GDT-PO are clearly inflated, whereas the p-values of FBAT, FBAT-ev, and PDT match the expected quantiles. The inflation of GDT and GDT-PO is caused by the LD between the DSL and the marker that leads to a frequency difference among founders (affected/unaffected). To recall, in this scenario FBAT and TDT are equivalent.
Figure 10:
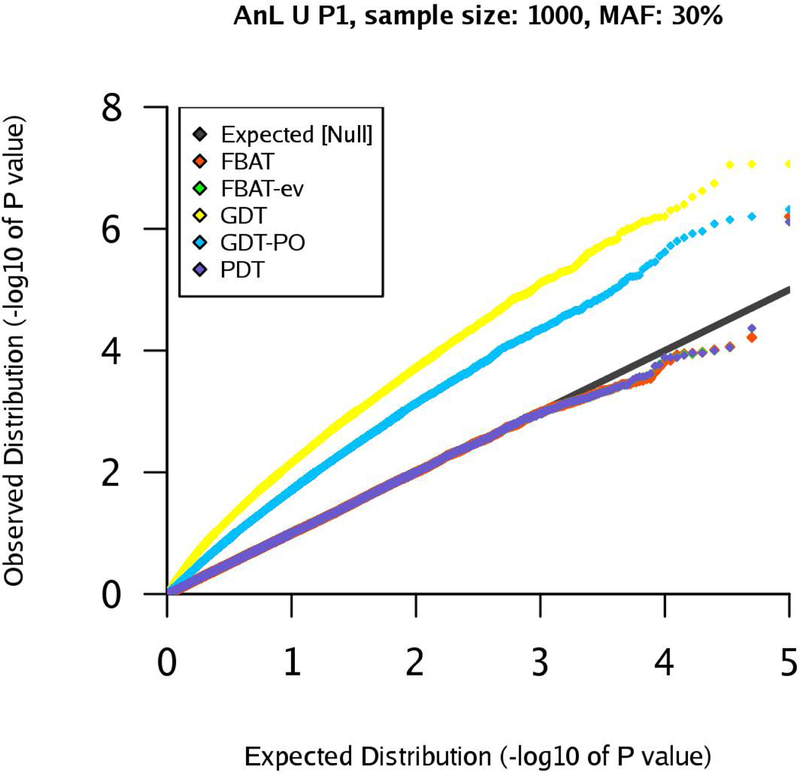
qq-plots for pedigree P1 in the AnL U scenario, marker MAF 30%, sample size .
Additional scenarios
To analyze the impact of two more extreme deviations, we consider scenarios where the marker is in tight linkage with a DSL of a large effect size (nAL-2 scenario) and the scenario where the founder genotype distributions deviate from HWE proportions based on an F-statistic of 10% (HWE-D2 scenario). For the nAL-2 scenarios, we restrict the simulations to pedigrees P2, P4, and P5 in combination with a marker MAF of 30%. The results are reported in Tables 8, 10, and 12. For these pedigrees P2, P4, and P5, we observe that the deviations from the expected quantiles are larger and the direction consistent when compared to the corresponding results for the nAL scenario. This is summarized by the increased empirical variance of the z-scores, demonstrating that the corresponding variance estimator does not capture the variance.
Table 8.
Empirical analysis for the nAL-2 null hypothesis for pedigree P2, sample size nfamilies=1,000 and marker minor allele frequency of 30%. The first two columns report the empirical mean and empirical variance of the z-scores for the five association tests. The last three columns report the proportion of association p-values below a specific significance level. All results based on 100,000 replicates.
| emp. mean z | emp. variance z | α = 0.05 | α = 0.01 | α = 0.001 | |
|---|---|---|---|---|---|
| FBAT | 0.0005 | 1.0597 | 0.0574 | 0.0122 | 0.0015 |
| FBAT-ev | 0.0005 | 1.001 | 0.0502 | 0.01 | 0.0011 |
| GDT | −0.0052 | 1.0273 | 0.0539 | 0.0124 | 0.0013 |
| GDT-PO | −0.0021 | 1.0595 | 0.0578 | 0.0129 | 0.0017 |
| PDT | −0.0021 | 1.0011 | 0.0508 | 0.0104 | 0.0011 |
Table 10.
Empirical analysis for the nAL-2 null hypothesis for pedigree P4, sample size nfamilies=1,000 and marker minor allele frequency of 30%. The first two columns report the empirical mean and empirical variance of the z-scores for the five association tests. The last three columns report the proportion of association p-values below a specific significance level. All results based on 100,000 replicates.
| emp. mean z | emp. variance z | α = 0.05 | α = 0.01 | α = 0.001 | |
|---|---|---|---|---|---|
| FBAT | 0.0005 | 1.0469 | 0.0555 | 0.0115 | 0.0012 |
| FBAT-ev | 0.0007 | 1.0003 | 0.497 | 0.0098 | 0.0008 |
| GDT | 0.0016 | 1.0399 | 0.0549 | 0.0122 | 0.0012 |
| GDT-PO | 0.0016 | 1.0399 | 0.0549 | 0.0122 | 0.0012 |
| PDT | - | - | - | - | - |
Table 12.
Empirical analysis for the nAL-2 null hypothesis for pedigree P5, sample size nfamilies=1,000 and marker minor allele frequency of 30%. The first two columns report the empirical mean and empirical variance of the z-scores for the five association tests. The last three columns report the proportion of association p-values below a specific significance level. All results based on 100,000 replicates.
| emp. mean z | emp. variance z | α = 0.05 | α = 0.01 | α = 0.001 | |
|---|---|---|---|---|---|
| FBAT | 0.0 | 1.1439 | 0.0665 | 0.0156 | 0.002 |
| FBAT-ev | 0.0018 | 0.9926 | 0.0487 | 0.0095 | 0.0009 |
| GDT | 0.0042 | 1.0347 | 0.0554 | 0.0119 | 0.0014 |
| GDT-PO | 0.0031 | 1.0705 | 0.0586 | 0.0131 | 0.0015 |
| PDT | 0.0009 | 0.9926 | 0.0492 | 0.01 | 0.0009 |
The results for the HWE-D2 scenario are reported in Supplementary Tables 3–8 (Section B) and the Supplementary Figures (Section D). Again, we observe increased deviations from the expected quantiles, consistent with the results for the HWE-D scenario. As for the nAL-2 scenario, the empirical variance demonstrates the misspecification of the variance.
Power
The results of the power comparison are provided in Tables 13–18, Figure 11 and the Supplementary Figures (Section D). In the Tables 13–18, we report the proportion of association p-values below different significance levels. Of course, the power depends on the phenotypes of the family members. For GDT and GDT-PO the phenotypes of founders are important as well. To recall, we simulate conditioned on a fixed phenotype setting and these settings are described in Figure 1.
Table 13.
Power analysis for pedigree P1. The last five columns contain the proportion of association p-values below a specific significance level for the five association tests and two different MAFs. All results based on 100,000 replicates.
| Sample size | MAF | Significance level |
FBAT | FBAT-ev | GDT | GDT-PO | PDT |
|---|---|---|---|---|---|---|---|
| 200 | 0.05 | 0.05 | 0.0579 | 0.058 | 0.0578 | 0.0578 | 0.058 |
| 0.01 | 0.0123 | 0.0121 | 0.0125 | 0.0125 | 0.0122 | ||
| 0.001 | 0.0013 | 0.0012 | 0.0014 | 0.0014 | 0.0013 | ||
| 0.30 | 0.05 | 0.0956 | 0.0957 | 0.097 | 0.097 | 0.0972 | |
| 0.01 | 0.0258 | 0.0251 | 0.027 | 0.027 | 0.0263 | ||
| 0.001 | 0.0032 | 0.0032 | 0.0036 | 0.0036 | 0.0033 | ||
| 1000 | 0.05 | 0.05 | 0.1004 | 0.0999 | 0.1009 | 0.1009 | 0.1004 |
| 0.01 | 0.027 | 0.027 | 0.0286 | 0.0286 | 0.0285 | ||
| 0.001 | 0.004 | 0.004 | 0.0041 | 0.0041 | 0.0042 | ||
| 0.30 | 0.05 | 0.2876 | 0.2873 | 0.2895 | 0.2895 | 0.2887 | |
| 0.01 | 0.12 | 0.1194 | 0.124 | 0.124 | 0.1231 | ||
| 0.001 | 0.0291 | 0.0286 | 0.0298 | 0.0298 | 0.0294 | ||
Table 18.
Power analysis for pedigree P6. The last five columns contain the proportion of association p-values below a specific significance level for the five association tests and two different MAFs. All results based on 100,000 replicates.
| Sample size | MAF | Significance level |
FBAT | FBAT-ev | GDT | GDT-PO | PDT |
|---|---|---|---|---|---|---|---|
| 200 | 0.05 | 0.05 | 0.0624 | 0.0618 | 0.097 | 0.1062 | 0.0618 |
| 0.01 | 0.0141 | 0.0136 | 0.0277 | 0.0302 | 0.0139 | ||
| 0.001 | 0.0014 | 0.0012 | 0.004 | 0.004 | 0.0014 | ||
| 0.30 | 0.05 | 0.1022 | 0.1016 | 0.2312 | 0.2871 | 0.1028 | |
| 0.01 | 0.0282 | 0.0271 | 0.0888 | 0.1189 | 0.0283 | ||
| 0.001 | 0.004 | 0.0036 | 0.0184 | 0.027 | 0.0037 | ||
| 1000 | 0.05 | 0.05 | 0.118 | 0.1177 | 0.2832 | 0.3533 | 0.1185 |
| 0.01 | 0.0351 | 0.0346 | 0.1212 | 0.1631 | 0.036 | ||
| 0.001 | 0.0055 | 0.0053 | 0.0296 | 0.0436 | 0.0055 | ||
| 0.30 | 0.05 | 0.3222 | 0.322 | 0.7747 | 0.874 | 0.3234 | |
| 0.01 | 0.1405 | 0.1397 | 0.557 | 0.7051 | 0.1436 | ||
| 0.001 | 0.0361 | 0.0357 | 0.284 | 0.4261 | 0.0367 | ||
Figure 11:
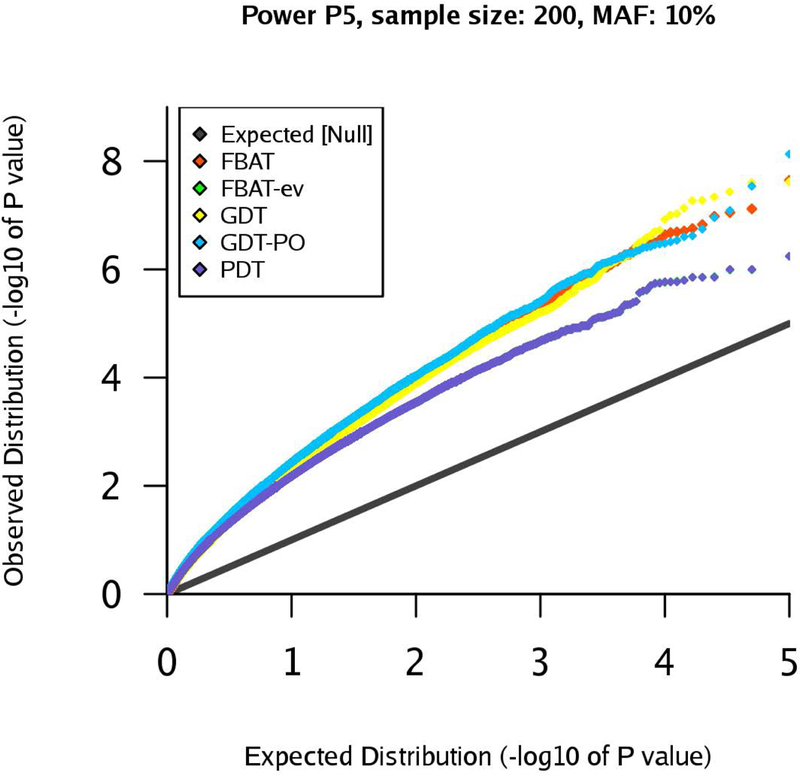
qq-plots for pedigree P5 in the power scenario, marker MAF 10%, sample size .
First, we observe that the power estimates for pedigrees P1 are very similar across the different tests (Table 13). This is reasonable, given the phenotypes and the rather simple pedigree structure. For pedigree P2, we observe that the GDT is clearly the most powerful test in our simulation study, whereas GDT-PO, FBAT, FBAT-ev, and PDT have similar, but smaller, power (Table 14). The results for pedigree P3 show that all association tests have comparable power, even though the GDT is slightly more powerful than the others (Table 15). Based on the results for pedigree P4, we note that FBAT and FBAT-ev have slightly more power than GDT/GDT-PO, but all tests are approximately on the same level (Table 16). The qq-plot for pedigree P5 is visualized in Figure 11. In this scenario, the GDT-PO is most powerful. For moderate significance levels, FBAT, FBAT-ev, and PDT have less power than GDT-PO, and the GDT has slightly less power than these three tests (Table 17). If we consider smaller significance levels, FBAT-ev and PDT lose power when compared to FBAT, GDT, and GDT-PO. The results for pedigree P6 demonstrate clearly that GDT and GDT-PO have much more power in this scenario than FBAT, FBAT-ev, and PDT. The GDT-PO is the most powerful test in this scenario (Table 18).
Table 14.
Power analysis for pedigree P2. The last five columns contain the proportion of association p-values below a specific significance level for the five association tests and two different MAFs. All results based on 100,000 replicates.
| Sample size | MAF | Significance level |
FBAT | FBAT-ev | GDT | GDT-PO | PDT |
|---|---|---|---|---|---|---|---|
| 200 | 0.05 | 0.05 | 0.0708 | 0.0686 | 0.0862 | 0.0713 | 0.0726 |
| 0.01 | 0.017 | 0.0146 | 0.0228 | 0.0175 | 0.0139 | ||
| 0.001 | 0.0019 | 0.0012 | 0.0027 | 0.0021 | 0.0012 | ||
| 0.30 | 0.05 | 0.1442 | 0.1424 | 0.2161 | 0.145 | 0.143 | |
| 0.01 | 0.0456 | 0.0438 | 0.0817 | 0.0476 | 0.0441 | ||
| 0.001 | 0.0079 | 0.0065 | 0.0163 | 0.0084 | 0.0068 | ||
| 1000 | 0.05 | 0.05 | 0.1596 | 0.1586 | 0.2454 | 0.1606 | 0.1598 |
| 0.01 | 0.0537 | 0.053 | 0.0964 | 0.0554 | 0.0543 | ||
| 0.001 | 0.0102 | 0.0095 | 0.0208 | 0.0106 | 0.01 | ||
| 0.30 | 0.05 | 0.5132 | 0.5119 | 0.7471 | 0.5139 | 0.513 | |
| 0.01 | 0.279 | 0.2768 | 0.5287 | 0.2839 | 0.2809 | ||
| 0.001 | 0.0961 | 0.0945 | 0.2581 | 0.0986 | 0.0968 | ||
Table 15.
Power analysis for pedigree P3. The last five columns contain the proportion of association p-values below a specific significance level for the five association tests and two different MAFs. All results based on 100,000 replicates.
| Sample size | MAF | Significance level |
FBAT | FBAT-ev | GDT | GDT-PO | PDT |
|---|---|---|---|---|---|---|---|
| 200 | 0.05 | 0.05 | 0.0829 | 0.071 | 0.0831 | 0.0806 | 0.0713 |
| 0.01 | 0.0203 | 0.0136 | 0.0206 | 0.0188 | 0.0142 | ||
| 0.001 | 0.0027 | 0.0012 | 0.0027 | 0.0025 | 0.0013 | ||
| 0.30 | 0.05 | 0.1972 | 0.1908 | 0.2074 | 0.1969 | 0.1921 | |
| 0.01 | 0.0704 | 0.0646 | 0.0765 | 0.0723 | 0.0669 | ||
| 0.001 | 0.0141 | 0.0114 | 0.0157 | 0.0145 | 0.0118 | ||
| 1000 | 0.05 | 0.05 | 0.224 | 0.2122 | 0.2367 | 0.2264 | 0.2138 |
| 0.01 | 0.0853 | 0.0744 | 0.0936 | 0.0863 | 0.0766 | ||
| 0.001 | 0.019 | 0.014 | 0.0208 | 0.0185 | 0.0145 | ||
| 0.30 | 0.05 | 0.6967 | 0.6941 | 0.7261 | 0.6988 | 0.6957 | |
| 0.01 | 0.4596 | 0.4532 | 0.4977 | 0.4664 | 0.4597 | ||
| 0.001 | 0.2073 | 0.1988 | 0.2349 | 0.2106 | 0.2028 | ||
Table 16.
Power analysis for pedigree P4. The last five columns contain the proportion of association p-values below a specific significance level for the five association tests and two different MAFs. All results based on 100,000 replicates.
| Sample size | MAF | Significance level |
FBAT | FBAT-ev | GDT | GDT-PO | PDT |
|---|---|---|---|---|---|---|---|
| 200 | 0.05 | 0.05 | 0.0614 | 0.053 | 0.0579 | 0.0579 | - |
| 0.01 | 0.0125 | 0.0088 | 0.0117 | 0.0117 | - | ||
| 0.001 | 0.0012 | 0.0004 | 0.0009 | 0.0009 | - | ||
| 0.30 | 0.05 | 0.0889 | 0.0877 | 0.0876 | 0.0876 | - | |
| 0.01 | 0.0228 | 0.0212 | 0.0234 | 0.0234 | - | ||
| 0.001 | 0.0034 | 0.0024 | 0.0033 | 0.0033 | - | ||
| 1000 | 0.05 | 0.05 | 0.1081 | 0.1066 | 0.0973 | 0.0973 | - |
| 0.01 | 0.0316 | 0.0303 | 0.0269 | 0.0269 | - | ||
| 0.001 | 0.0048 | 0.0039 | 0.0043 | 0.0043 | - | ||
| 0.30 | 0.05 | 0.2557 | 0.254 | 0.2487 | 0.2487 | - | |
| 0.01 | 0.1013 | 0.0991 | 0.1002 | 0.1002 | - | ||
| 0.001 | 0.0234 | 0.0222 | 0.0231 | 0.0231 | - | ||
Table 17.
Power analysis for pedigree P5. The last five columns contain the proportion of association p-values below a specific significance level for the five association tests and two different MAFs. All results based on 100,000 replicates.
| Sample size | MAF | Significance level |
FBAT | FBAT-ev | GDT | GDT-PO | PDT |
|---|---|---|---|---|---|---|---|
| 200 | 0.05 | 0.05 | 0.2044 | 0.1872 | 0.1963 | 0.2231 | 0.1886 |
| 0.01 | 0.0748 | 0.057 | 0.074 | 0.0844 | 0.0595 | ||
| 0.001 | 0.0156 | 0.0075 | 0.0152 | 0.0167 | 0.0079 | ||
| 0.30 | 0.05 | 0.5993 | 0.5909 | 0.5704 | 0.6536 | 0.5927 | |
| 0.01 | 0.3564 | 0.341 | 0.3352 | 0.4147 | 0.3476 | ||
| 0.001 | 0.1398 | 0.1225 | 0.1255 | 0.1743 | 0.1253 | ||
| 1000 | 0.05 | 0.05 | 0.7192 | 0.7107 | 0.6886 | 0.768 | 0.7122 |
| 0.01 | 0.4856 | 0.4649 | 0.4563 | 0.5509 | 0.4721 | ||
| 0.001 | 0.2278 | 0.2009 | 0.2068 | 0.2784 | 0.2049 | ||
| 0.30 | 0.05 | 0.9983 | 0.9982 | 0.9976 | 0.9996 | 0.9982 | |
| 0.01 | 0.9907 | 0.9902 | 0.9861 | 0.9964 | 0.9907 | ||
| 0.001 | 0.9503 | 0.9472 | 0.9304 | 0.9756 | 0.9488 | ||
Discussion
We start with briefly summarizing the results obtained by the simulation studies and the analytical derivations in the previous section. We then discuss the consequences of our findings for corresponding extensions of the approaches to region-based association analysis in family-based designs. Furthermore, we describe the connection to recent mixed model approaches that can also incorporate family-based data.
Type 1 error rates
In simulation studies and by theoretical derivations, we examined the robustness properties of well-established TDT-similar association tests under the null hypothesis. Our simulation studies demonstrated that there are realistic scenarios in which inflation or deflation of the type 1 error can be observed. Inflated type 1 errors can cause an increase in spurious association findings. The deviations are large enough to be of real concern in applications.
The GDT and the GDT-PO are intuitive and flexible association tests that can be applied to a wide range of pedigree structures, but they can be sensitive to population admixture and/or HWE deviations, as well as linkage or association in the absence of linkage. Furthermore, asymptotic p-values, especially when empirical variance estimators are used, require sufficiently large sample sizes. The PDT provided well-calibrated type 1 error rates in our simulations, but the test is not as flexible as FBAT and GDT regarding missing parental genotypes and different pedigree structures. Again, asymptotic p-values for the PDT require sample sizes that are large enough. We considered two versions of FBAT: the standard analytical and the empirical variance version. In the absence of linkage, both versions control the type 1 error rates. The analytical version provided slightly better results for small sample sizes since the conditional variance is computed analytically. In the presence of strong linkage with a DSL with large effect size, we observed inflated results for the analytical FBAT, as expected in theory. The empirical version corrects for the correlated transmission and thereby controls the type 1 error.
The main difference between GDT and FBAT regarding robustness can be generally explained by the following observation. All association test statistics under consideration are the sum of statistics over the independent families. This is also true for the TDT. The TDT test statistic contribution for each family has mean 0 under all null hypotheses, by design. The corresponding variance can be computed analytically, and the overall variance is then again just the sum of the individual variances since families are assumed to be independent. The FBAT approach extended this idea from affected offspring trios to general nuclear families and phenotypes, generalizing the idea of Mendelian transmission to the concept of the sufficient statistic. The FBAT statistic, therefore, has mean 0 for each nuclear family under all null hypotheses (Lake et al., 2000). The corresponding variance can be computed or consistently estimated.
The GDT test statistic for each nuclear family does have mean 0 if there is only population stratification, but the test statistic does not have mean 0, for example, in the presence of population admixture. In the scenario of population admixture, the underlying assumption of GDT is that these biases cancel out in the summation over all families in the dataset.
Power
We compared the power between all five association tests across six different pedigrees. To identify the power behavior, we restricted our simulation studies to the scenario U and a large sample size of . This implies that all deviations from the null hypothesis are due to a true signal. For the other founder genotype distribution scenarios, our type 1 error study showed that for these scenarios it is not straightforward for the GDT and GDT-PO to identify deviations from the null hypothesis as the presence of genetic effects. For a small sample size, asymptotic p-values might not be reliable enough to study the true power. Our results showed that association test statistics as the GDT and GDT-PO can be more powerful in extended pedigrees since they include all family members. However, for other scenarios, the power was comparable between all tests under consideration. It is important to note again that it is not straightforward to interpret power for tests that do not control the type 1 error under the null hypothesis.
Region-based extensions
To incorporate rare variants into the association analysis, extensions of the discussed family-based association tests have been proposed that assess multiple loci simultaneously for association. This includes the RV-TDT methods (He et al., 2014), RV-PDT and RV-GDT (He et al., 2017), rare-variant FBAT (De, Yip, Ionita-Laza, & Laird, 2013), and gTDT (R. Chen et al., 2015).
Here, we discuss the properties and similarities between these approaches and how the properties of the corresponding single variant tests extend to the region-based approaches.
The RV-TDT methods include four extensions of the TDT approach using trio data: RV-CMC, TDT-BRV, TDT-WSS, and TDT-VT. The simulation studies in (He et al., 2014) demonstrate that these approaches can control the type 1 error, even in the presence of population stratification and admixture. However, the underlying haplotype permutation procedure requires the knowledge of the phased haplotypes for the parental data which might be a bottleneck in practice.
If the parental haplotypes are known, region-based association tests for trios can be interpreted as the single variant TDTs that are applied to a multi-allelic locus, where the alleles are the phased haplotypes. This can be done under the assumption that loci which define the haplotype are tightly linked and that there is no recombination. Therefore, haplotype permutation mimics Mendelian transmissions under the null hypothesis and one can control the type 1 error rate of all suitable coding and statistic schemes.
This observation is used in the derivation of the gTDT (R. Chen et al., 2015). In this derivation, the knowledge of phased haplotypes is assumed. The general gTDT statistic is derived as a score test in a conditional logistic regression model, similar to the construction of FBATs (N. Laird & Lange, 2011). The score test includes the mean and variance under the null hypothesis, computed using Mendel’s laws of transmission. The gTDT can test different genetic models, incorporated through different coding schemes. If the phased haplotypes are not known, gTDT reconstructs the haplotypes from the genotype data. This is possible exactly except the ambiguous situation when all genotypes for a specific variant are heterozygous. In this case, gTDT assigns the phase information randomly along the possible configurations. The authors note that this scenario is rare when considering rare variants and therefore has little impact on the analysis.
We note that also treating reconstructed haplotypes as known haplotypes can be problematic for the same reasons as treating “reconstructed” missing parental information as known, i.e. RC-TDT (Knapp, 1999). This can lead to a miss-specified variance. We discuss this aspect in detail in Appendix A.
The rare-variant FBAT (De et al., 2013) is a burden test that can incorporate variant-specific weights and collapses single variant FBAT residuals across the genomic region into a single scalar. The single variant FBAT residuals are computed by the single variant FBAT approach described above. The current implementation uses an empirical estimation to account for LD between the variants. However, the FBAT-haplotype algorithm (Hecker et al., 2017; Horvath et al., 2004) can be used to compute a conditional joint offspring genotype distribution for each nuclear family that allows one to compute mean and variance for arbitrary association test statistics under the null hypothesis. Therefore, the application of the FBAT-haplotype algorithm in combination with suitable association test statistics or coding schemes generalizes the RV-TDT methods as well as gTDT and does not require phasing of the genotype data.
The RV-GDT and RV-PDT are straightforward extensions of the single variant GDT and PDT. The corresponding statistics are computed as the (weighted) sum of the single variant contributions. The significance of the RV-GDT is evaluated by shuffling the phenotypes among members of the pedigree. This assumes the exchangeability of phenotypes under the null hypothesis, corresponding to the assumption of the GDT that genotypic mean and variance are equal under the null hypothesis. Therefore, we conclude that the RV-GDT shares the features of the GDT, i.e. population admixture, HWE deviations, linkage, and LD in the absence of linkage can lead to inflated/deflated type 1 errors.
Mixed Model approaches
A very popular approach to association analysis in genetic studies is the application of mixed models. Several modifications and improvements of this approach were proposed, for example FaST-LMM (Lippert et al., 2011), GEMMA (X. Zhou & Stephens, 2012), and BOLT-LMM (Loh et al., 2015) In general, mixed model approaches treat the phenotype as random, whereas the TDT and the TDT generalizations consider the phenotypes as fixed. In addition, the standard linear mixed model assumes a normally distributed phenotype. Therefore, the standard scenario assumes random-sampling of a quantitative trait from the population. To analyze case-control datasets, phenotype transformation methods as, for example, LTMLM for unrelated samples (Hayeck et al., 2015), and LT-FAM for related samples (Hayeck et al., 2017), were proposed. To avoid phenotype transformations and violated constant variance assumptions, GMMAT provides a logistic mixed model approach, directly designed to analyze a dichotomous trait (H. Chen et al., 2016). To test a variant for association, GMMAT constructs a score test statistic based on the null model including the so-called GRM (Genetic Relationship Matrix) information to incorporate population admixture and relatedness. Very recently, a similar approach to GMMAT was proposed. SAIGE utilizes a saddle point approximation of the score statistic to deal with datasets with imbalanced case-control ratio (W. Zhou et al., 2018). SAIGE is very flexible as it can incorporate unrelated and related samples and only requires the GRM to correct for the corresponding structure. However, while transmission-based tests aim to maintain robustness/correct type 1 error for every locus that is analyzed, GRM approaches (by design) for population-admixture and confounding at the global/genome level. We therefore did not include GRM approaches in our simulation studies. We discuss additional aspects of the application of mixed models to purely family-based designs in Appendix B.
Conclusion
In this communication, we compared type 1 errors rates and power of popular TDT-generalizations for single variant family-based association analysis. Family-based designs allow the construction of association tests that are robust against population admixture. As family-based association studies, when compared to population-based studies, impose an additional burden to the investigators in terms of recruitment and genotyping/sequencing, it is important that the selected association test maintains the desired features, i.e. the correct null distribution in the presence of confounding sources, e.g. population admixture and departures from Hardy-Weinberg equilibrium. That were the very reasons for the extra effort to implement the family-based designs in the first place.
As our simulation studies show, association tests for family-based study designs that incorporate all family-members can be more powerful, but the increased power is connected to the loss of total robustness against population admixture and other non-standard population genotype distributions. These properties transfer from the single variant setting to region-based extensions that are commonly applied in whole-genome sequencing studies. Especially for rare variants, region-based analysis is important and robustness against population differences in minor allele frequencies is crucial. For rare variants, the application of mixed model approaches can be problematic, since it is known that population stratification patterns differ between common and rare variants. This emphasizes the need of robust, transmission-based approaches for the family-based analysis in sequencing studies.
Although we considered only asymptotic p-values for all association tests, it is important to note that the FBAT framework allows the computation of simulated or even exact p-values. This can be valuable if the sample size or the number of pedigrees is small. Extensions to non-binary phenotypes are also straightforward (Lange et al. 2003, Lange et al. 2004).
Supplementary Material
Figure 6:
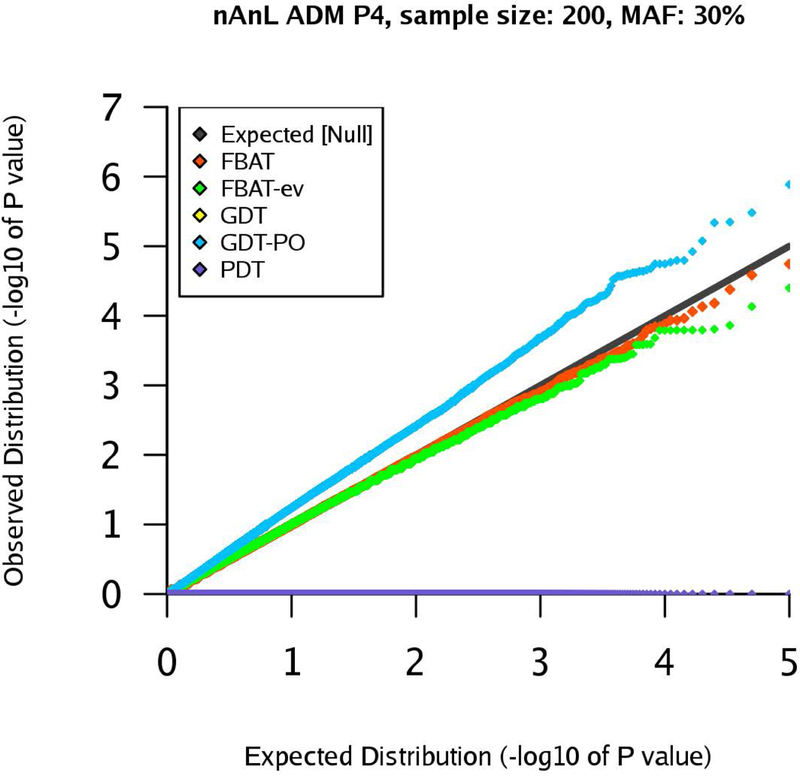
qq-plots for pedigree P4 in the nAnL ADM scenario, marker MAF 30%, sample size .
Acknowledgments
This work was supported by Cure Alzheimer’s Fund; the National Human Genome Research Institute [R01HG008976]; and the National Heart, Lung, and Blood Institute [U01HL089856, U01HL089897, P01HL120839, P01HL132825].
Grant numbers:
Cure Alzheimer’s Fund; National Human Genome Research Institute [R01HG008976]; National Heart, Lung, and Blood Institute [U01HL089856, U01HL089897, P01HL120839, P01HL132825]
Appendices
Appendix A
We discuss the theoretical issue regarding the haplotype reconstruction based on a simple example. As described above, the key to rigorous robustness against population stratification and admixture is to set up a statistic that has mean 0 and an estimable variance under the respective null hypothesis. Suppose we consider two biallelic markers, both with alleles and The unphased genotype for the offspring is and the observed parental genotype data and In this notation, denotes a homozygous A genotype and genotype and a heterozygous genotype. Using the arguments in (R. Chen et al., 2015), we can construct the parental haplotypes exactly and obtain and . This means that the parents transmitted a and a haplotype to the offspring and the phased offspring genotype is . If we fix this parental mating type, we see that the possible phased offspring genotypes are and let Only if the phased offspring genotype is or , exact reconstruction of the parental haplotypes is possible. Under the null hypothesis, the conditional offspring genotype distribution is
where the sum goes over all possible parental haplotype configurations H that are compatible with and . denotes the unknown distribution of haplotypes in the founders, describing LD and MAFs. If and are phased, the sum contains only 1 element and cancels out and we obtain for all . However, in general, does not cancel out and the conditional distribution depends on the unknown If we restrict to and , the conditional distribution is independent of the unknown haplotype distribution in founders.
This is an application of the so-called FBAT-haplotype algorithm (Hecker et al., 2017; Horvath et al., 2004) that is based on the sufficient statistic approach by Rabinowitz and Laird (Rabinowitz & Laird, 2000).
Appendix B
Based on a numerical example and the SAIGE software, we illustrate why we do not include mixed model approaches into our type 1 error and power comparison for purely family-based study designs.
We simulated genotypes for pedigree P1 under the null hypothesis of no association in absence of linkage (no genetic effect) for the founder genotype distribution scenarios U and ADM. We created independent 100,000 replicates for the underlying marker MAFs 1%, 5%, 10%, 20%, and 30%, as described in the Methods section. We selected 5,000 SNPs for the MAFs 5%, 10%, 20%, and 30% to estimate the GRM based on the resulting 20,000 independent, common SNPs and all 3,000 samples. We fitted the SAIGE null model using the GRM and the corresponding first two principal components as covariates, using four different phenotype structures. The first two principal components for both scenarios, U and ADM, are plotted against each other in Supplementary Figures 1 and 2 (Section C). Then, we tested the remaining 95,000 variants for each MAF using the null model and the score statistic-based SAIGE approach, implemented in the SAIGE R package (W. Zhou et al., 2018). First, we chose a phenotype structure where we randomly assigned 2,000 samples as affected and 1,000 as unaffected. In this setting, SAIGE provided controlled type 1 error rates in both scenarios, the lambda inflation factor (Devlin & Roeder, 1999) was approximately 1.00. If we assign the offspring as affected and the parents as unaffected, the results were extremely deflated (), for both scenarios. If we code the offspring and the father as affected, the mother as unaffected, the lambda inflation factor was approximately 0.83 across the MAFs in scenario U. In scenario ADM, the lambda factor was between 1.01 and 1.09. In addition, we observed that the empirical mean of the score test statistic was positive along variants where the founder MAF of the father is higher than the founder MAF of the mother, and vice versa. This reflects the intuitive fact that the SAIGE approach aims to construct a score test statistic that has mean 0 across different variants with different MAFs, but it cannot guarantee a mean 0 for each variant in presence of population stratification/admixture since the null model is constant. If we randomly assign affected/unaffected to mother, father and offspring with corresponding ratios 30/70,50/50, and 70/30, the lambda factor was approximately 0.94 for both scenarios and all MAFs. Mixed models are powerful and flexible methods for the analysis of large-scale genetic datasets. However, we conclude that the application to studies with strict ascertainment conditions is difficult. In addition, estimation of the GRM is not straightforward in terms of population admixture along the genome and the possible differences between common and rare variation. Since the focus of our work was the investigation of complete robustness of transmission-based approaches and their properties as the basis of region-based extensions, we did not include mixed models into our comparison.
Footnotes
Description of Supplemental Data
Supplemental Material includes four sections A, B, C, and D. Section A describes the parameter values for the simulation. Section B contains Supplementary Tables 3–8. Section C contains Supplementary Figures 1 and 2. Section D contains all qq-plots for the simulated scenarios.
Declaration of Interests
The authors declare no competing interests.
References
- Balding DJ, & Nichols RA (1995). A method for quantifying differentiation between populations at multi-allelic loci and its implications for investigating identity and paternity. Genetica, 96(1), 3–12. 10.1007/BF01441146 [DOI] [PubMed] [Google Scholar]
- Chen H, Wang C, Conomos MP, Stilp AM, Li Z, Sofer T, Lin X (2016). Control for Population Structure and Relatedness for Binary Traits in Genetic Association Studies via Logistic Mixed Models. American Journal of Human Genetics, 98(4), 653–666. 10.1016/j.ajhg.2016.02.012 [DOI] [PMC free article] [PubMed] [Google Scholar]
- Chen R, Wei Q, Zhan X, Zhong X, Sutcliffe JS, Cox NJ, Li B (2015). A haplotype-based framework for group-wise transmission/disequilibrium tests for rare variant association analysis. Bioinformatics (Oxford, England), 31(9), 1452–1459. 10.1093/bioinformatics/btu860 [DOI] [PMC free article] [PubMed] [Google Scholar]
- Chen W-M, Manichaikul A, & Rich SS (2009). A Generalized Family-Based Association Test for Dichotomous Traits. American Journal of Human Genetics, 85(3), 364–376. 10.1016/j.ajhg.2009.08.003 [DOI] [PMC free article] [PubMed] [Google Scholar]
- Corominas J, Klein M, Zayats T, Rivero O, Ziegler GC, Pauper M, Lesch K-P (2018). Identification of ADHD risk genes in extended pedigrees by combining linkage analysis and whole-exome sequencing. Molecular Psychiatry, 1 10.1038/s41380-018-0210-6 [DOI] [PMC free article] [PubMed] [Google Scholar]
- De G, Yip W-K, Ionita-Laza I, & Laird N (2013). Rare Variant Analysis for Family-Based Design. PLOS ONE, 8(1), e48495 10.1371/journal.pone.0048495 [DOI] [PMC free article] [PubMed] [Google Scholar]
- Devlin B, & Roeder K (1999). Genomic control for association studies. Biometrics, 55(4), 997–1004. [DOI] [PubMed] [Google Scholar]
- Ewens WJ, & Spielman RS (1995). The transmission/disequilibrium test: history, subdivision, and admixture. American Journal of Human Genetics, 57(2), 455–464. [PMC free article] [PubMed] [Google Scholar]
- Hayeck TJ, Loh P-R, Pollack S, Gusev A, Patterson N, Zaitlen NA, & Price AL (2017). Mixed Model Association with Family-Biased Case-Control Ascertainment. American Journal of Human Genetics, 100(1), 31–39. 10.1016/j.ajhg.2016.11.015 [DOI] [PMC free article] [PubMed] [Google Scholar]
- Hayeck TJ, Zaitlen NA, Loh P-R, Vilhjalmsson B, Pollack S, Gusev A, Price AL (2015). Mixed Model with Correction for Case-Control Ascertainment Increases Association Power. The American Journal of Human Genetics, 96(5), 720–730. 10.1016/j.ajhg.2015.03.004 [DOI] [PMC free article] [PubMed] [Google Scholar]
- He Z, O’Roak BJ, Smith JD, Wang G, Hooker S, Santos-Cortez RLP, Leal SM (2014). Rare-variant extensions of the transmission disequilibrium test: application to autism exome sequence data. American Journal of Human Genetics, 94(1), 33–46. 10.1016/j.ajhg.2013.11.021 [DOI] [PMC free article] [PubMed] [Google Scholar]
- He Z, Zhang D, Renton AE, Li B, Zhao L, Wang GT, Leal SM (2017). The Rare-Variant Generalized Disequilibrium Test for Association Analysis of Nuclear and Extended Pedigrees with Application to Alzheimer Disease WGS Data. American Journal of Human Genetics, 100(2), 193–204. 10.1016/j.ajhg.2016.12.001 [DOI] [PMC free article] [PubMed] [Google Scholar]
- Hecker J, Xu X, Townes FW, Fier HL, Corcoran C, Laird N, & Lange C (2017). Family-based tests for associating haplotypes with general phenotype data. Genetic Epidemiology, 42(1), 123–126. 10.1002/gepi.22094 [DOI] [PMC free article] [PubMed] [Google Scholar]
- Horvath S, Xu X, Lake SL, Silverman EK, Weiss ST, & Laird NM (2004). Family-based tests for associating haplotypes with general phenotype data: application to asthma genetics. Genetic Epidemiology, 26(1), 61–69. 10.1002/gepi.10295 [DOI] [PubMed] [Google Scholar]
- Knapp M (1999). The Transmission/Disequilibrium Test and Parental-Genotype Reconstruction: The Reconstruction-Combined Transmission/ Disequilibrium Test. The American Journal of Human Genetics, 64(3), 861–870. 10.1086/302285 [DOI] [PMC free article] [PubMed] [Google Scholar]
- Lange C, Blacker D, & Laird NM (2004). Family-based association tests for survival and times-to-onset analysis. Statistics in Medicine, 23(2), 179–189. 10.1002/sim.1707 [DOI] [PubMed] [Google Scholar]
- Lange C, Silverman EK, Xu X, Weiss ST, & Laird NM (2003). A multivariate family‐based association test using generalized estimating equations: FBAT‐GEE. Biostatistics, 4(2), 195–206. 10.1093/biostatistics/4.2.195 [DOI] [PubMed] [Google Scholar]
- Laird N, & Lange C (2011). The Fundamentals of Modern Statistical Genetics. New York: Springer; Retrieved from http://www.springer.com/cn/book/9781441973375 [Google Scholar]
- Laird NM, & Lange C (2006). Family-based designs in the age of large-scale gene-association studies. Nature Reviews Genetics, 7(5), 385–394. 10.1038/nrg1839 [DOI] [PubMed] [Google Scholar]
- Lake SL, Blacker D, & Laird NM (2000). Family-Based Tests of Association in the Presence of Linkage. American Journal of Human Genetics, 67(6), 1515–1525. [DOI] [PMC free article] [PubMed] [Google Scholar]
- Lippert C, Listgarten J, Liu Y, Kadie CM, Davidson RI, & Heckerman D (2011). FaST linear mixed models for genome-wide association studies. Nature Methods, 8(10), 833–835. 10.1038/nmeth.1681 [DOI] [PubMed] [Google Scholar]
- Loh P-R, Tucker G, Bulik-Sullivan BK, Vilhjálmsson BJ, Finucane HK, Salem RM, Price AL (2015). Efficient Bayesian mixed-model analysis increases association power in large cohorts. Nature Genetics, 47(3), 284–290. 10.1038/ng.3190 [DOI] [PMC free article] [PubMed] [Google Scholar]
- Martin ER, Bass MP, & Kaplan NL (2001). Correcting for a potential bias in the pedigree disequilibrium test. American Journal of Human Genetics, 68(4), 1065–1067. 10.1086/319525 [DOI] [PMC free article] [PubMed] [Google Scholar]
- Martin ER, Monks SA, Warren LL, & Kaplan NL (2000). A test for linkage and association in general pedigrees: the pedigree disequilibrium test. American Journal of Human Genetics, 67(1), 146–154. 10.1086/302957 [DOI] [PMC free article] [PubMed] [Google Scholar]
- Rabinowitz D, & Laird N (2000). A unified approach to adjusting association tests for population admixture with arbitrary pedigree structure and arbitrary missing marker information. Human Heredity, 50(4), 211–223. https://doi.org/22918 [DOI] [PubMed] [Google Scholar]
- Spielman RS, & Ewens WJ (1998). A sibship test for linkage in the presence of association: the sib transmission/disequilibrium test. American Journal of Human Genetics, 62(2), 450–458. 10.1086/301714 [DOI] [PMC free article] [PubMed] [Google Scholar]
- Spielman RS, McGinnis RE, & Ewens WJ (1993). Transmission test for linkage disequilibrium: the insulin gene region and insulin-dependent diabetes mellitus (IDDM). American Journal of Human Genetics, 52(3), 506–516. [PMC free article] [PubMed] [Google Scholar]
- Sun F, Flanders WD, Yang Q, & Khoury MJ (1999). Transmission disequilibrium test (TDT) when only one parent is available: the 1-TDT. American Journal of Epidemiology, 150(1), 97–104. [DOI] [PubMed] [Google Scholar]
- Zhou W, Nielsen JB, Fritsche LG, Dey R, Gabrielsen ME, Wolford BN, Lee S (2018). Efficiently controlling for case-control imbalance and sample relatedness in large-scale genetic association studies. Nature Genetics, 50(9), 1335–1341. 10.1038/s41588-018-0184-y [DOI] [PMC free article] [PubMed] [Google Scholar]
- Zhou X, & Stephens M (2012). Genome-wide Efficient Mixed Model Analysis for Association Studies. Nature Genetics, 44(7), 821–824. 10.1038/ng.2310 [DOI] [PMC free article] [PubMed] [Google Scholar]
Associated Data
This section collects any data citations, data availability statements, or supplementary materials included in this article.


