

Abstract
Parkinson’s disease is the second most common neurodegenerative disease. In the vast majority of cases the origin is not genetic and the cause is not well understood, although progressive accumulation of α-synuclein aggregates appears central to the pathogenesis. Currently, treatments that slow disease progression are lacking and there are no robust biomarkers that can facilitate development of such treatments, or act as aids in early diagnosis. Therefore, we have defined metabolomic changes in the brain and serum in an animal model of prodromal Parkinson’s disease. We biochemically profiled the brain tissue and serum in a mouse model with progressive synucleinopathy propagation in the brain triggered by unilateral injection of preformed α-synuclein fibrils in the olfactory bulb. In total, we accurately identified and quantified 71 metabolites in brain and 182 in serum using 1H NMR and targeted mass spectrometry, respectively. Using multivariate analysis, we accurately identified which metabolites explain the most variation between cases and controls. Using pathway enrichment analysis, we highlight significantly perturbed biochemical pathways in the brain and correlate these with the progression of the disease. Further, we identified the top 6 discriminatory metabolites and were able to develop a model capable of identifying animals that developed the pathology from healthy controls with high accuracy (AUC (95% CI) = 0.861 (0.755–0.968)). Our study highlights the utility of metabolomics in identifying elements of Parkinson’s disease pathogenesis and for the development of early diagnostic biomarkers of the disease.
Keywords: Prodromal Parkinson’s disease, metabolomics, mass spectrometry, NMR, biomarkers
Graphical Abstract
INTRODUCTION
Parkinson’s disease (PD) is the second most common neurodegenerative disease after Alzheimer’s disease 1 and the most common movement disorder in the aging human population 2. Generalized prevalence rates estimate that 1 to 2 people per 1000 are affected by PD in unselected populations 3 and that 1% of the population over 60 years of age is affected 4. The main motor symptoms of PD include tremor, rigidity, postural instability and bradykinesia 5–6. Non-motor symptoms are a major source of morbidity and some of them precede the development of the classical motor symptoms by several years, during the prodromal phase of PD 7. At the neuropathological level, PD is characterized by intra-neuronal inclusions known as Lewy bodies (in somata) and Lewy neurites, mainly composed of misfolded α-synuclein (α-syn) and lipids 8–9. In the brain, α-syn pathology progresses spatially during the course of the disease, and follows a stereotypical pattern in the brain where additional brain regions are involved the longer the disease progression. The α-syn pathology has been divided into 6 stages by Braak and coworkers depending on which brain regions are affected 10–12. In stage 1, during the prodromal phase (i.e. before motor symptoms have developed), pathology is present in the olfactory bulb and the dorsal motor nucleus of the vagus nerve. Neuropathology then spreads to additional brain regions and motor deficits appear only when the substantia nigra is affected, at stage 3, when a diagnosis for PD can be made 13.
There are no disease-modifying treatments for PD and the underlying etiopathogenesis is poorly understood 14. In addition, no biomarkers are available which can track disease progression or accurately predict the development of PD in the prodromal phase, when neuroprotective and disease-modifying strategies potentially would be most effective 15. Our group has recently developed a mouse model of prodromal PD which mimics the progression of α-syn pathology beginning in the olfactory bulb 15–16. We believe that this model can be used to identify markers of pathology and to test therapeutics aimed at preventing or slowing PD development.
Metabolomics or metabolic profiling, is the one of the newer “omics” technologies which comprehensively studies metabolic pathways in biological systems with the focus on metabolites 17. Metabolomics encompasses high-throughput identification and elucidation of the small molecule metabolites that are produced by cells, tissues and microorganisms 18–19. This technique has been employed previously in attempts to identify individuals who have PD. Using high performance liquid chromatography coupled with electrochemical coulometric array detection, Bogdanov et al., (2008) could distinguish plasma samples between controls and patients with idiopathic PD 20. In a second study, this group demonstrated that plasma profiling can distinguish patients with PD due to G2019S LRRK2 mutation from idiopathic PD patients 21. Metabolomics has also been used in animal models of PD. Chen et al., longitudinally profiled the brain from A53T transgenic mice before (3 months) and after (18 months) the development of α-syn pathology in the brain. Multivariate analyses of brain metabolomics profiles in 3 and 18 month-old A53T and control mice have revealed perturbed biochemical pathways at the various stages of the disease 22. More recently, LeWitt et al., (2017) demonstrated that gas chromatography mass spectral profiling of plasma and cerebrospinal fluid (CSF) can predict disease progression in un-medicated patients and those mildly affected by PD 23.
So far, no studies have defined metabolomic differences in brain and serum of an animal model of prodromal PD. In this study, we employ both 1H NMR and DI-LC-MS/MS to biochemically profile the brain and serum, respectively, in our new prodromal model of PD. We aim to uncover previously unreported biochemical pathways that might be relevant to early disease pathogenesis in brain, and which correlate with changes in serum. Therefore, we hypothesize that the biochemical changes in the brain will be mirrored by biochemical changes in the serum.
EXPERIMENTAL PROCEDURES
Animals
C57Bl/6J mice from Jackson laboratory were housed 5 to 6 per cage under regular 12-h light/ 12-h dark cycle. Mice had access to food and water ad libitum. The housing and all the procedures follow The Guide for Care and Use of Laboratory animals (National Research Council), and were validated by the Van Andel Research Institute’s Institutional Animal Care and Use Committee.
Purification of recombinant α-syn and assembly of pre-formed fibrils
Recombinant α-syn purification and fibril assembly was based on a previously published protocol 24. Briefly, human α-syn was expressed in BL21 E.coli, pelleted, and lysed by sonication. The lysates were boiled for 10 min and centrifuged. The supernatant was dialyzed overnight in 10 mM Tris, pH 7.5, 50 mM NaCl, and 1 mM EDTA, and then subjected to chromatographic separation by a Superdex 200 Column (GE Healthcare Life Sciences) and a Hi-trap Q HP anion exchange column (GE Healthcare Life Sciences). Fractions containing α-syn were identified by SDS-PAGE and Coomassie staining before a final dialysis into PBS buffer (Life Sciences). The concentration of purified recombinant α-syn was determined using a NanoDrop 2000 (Thermofisher) and concentrated if needed. Aliquots were stored at −80 °C until use. For amyloid fibril assembly, purified recombinant α-syn was thawed and diluted to 5 mg/ml in PBS. An aliquot of protein was subject to continuous shaking at 1,000 r.p.m at 37 °C in a Thermomixer (Eppendorf) for 7 days. Fibrils were aliquoted and frozen at −80 °C until use.
Stereotactic injections
Before injection, human α-syn fibrils (PFFs, 5 ug/uL) were thawed at RT and sonicated at RT in a waterbath sonicator (Misonix XL2020 sonicator with cup horn; 50 % power, 60 pulses of 1 s ON, 1 s OFF). Human α-syn monomers (huMonomers) were thawed at RT and spun down at 100,000 g for 30 min. The supernatant was collected and used for injections. We performed stereotactic unilateral injection of PFFs (n=20) or huMonomers (n=20) (0.8 uL, 5 ug/uL) in the OB of 2 months-old wild type mice as previously described 15, 25. Two mice injected with huMonomers were euthanized after developing severe dermatitis, unrelated to the surgical procedure.
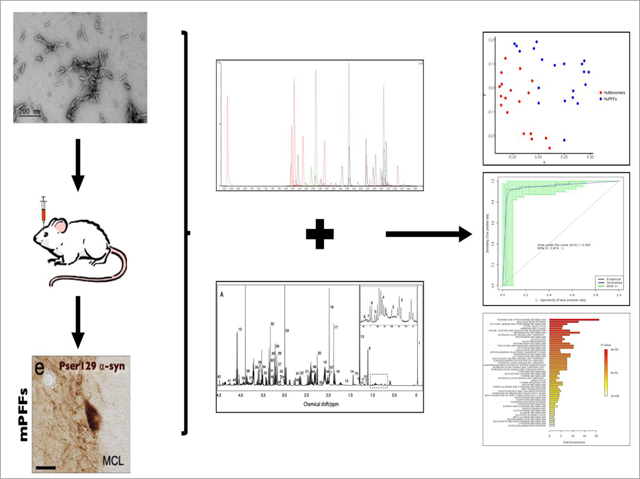
The nature of the fibrils post-sonication was verified by transmission electron microscopy. Human fibrils (after sonication) were diluted to 0.1μg /uL into sterile PBS, absorbed onto carbon coated 200-mesh grids (Electron Microscopy Science, ref #CF200-CU-UL) and were negatively stained with 2% uranyl formate (Electron Microscopy Science, ref #22400). Grids were imaged using a FEI Tecnai G2 Spirit TWIN transmission electron microscope (FEI Company) at 120kV (Supplementary Figure 1).
Brain and serum collection
Three months post-injection, mice were deeply anesthetized with sodium pentobarbital. We collected blood at final bleed by cardiac puncture and the brain was then freshly dissected. The cerebellum was cut out, and the forebrain was sectioned at the midline. The left (contralateral to the injection) and right (ipsilateral to the injection) hemispheres including the olfactory bulbs were collected separately and frozen immediately on dry ice, and stored at −80 °C. The blood was collected in BD red top –vacutainer tubes for serum collection, and kept at RT for 20–30 minutes to allow blood clot formation. Tubes were then centrifuged at 4,500 g for 10 min at 15 °C. The serum was collected and transferred to pre-cooled vials, vortexed, aliquoted and frozen on crushed dry ice. Samples were then stored at −80 °C.
Brain Sample Preparation
All brain samples were prepared using a modified version of the protocol previously described by Graham et al. (2013) 26 and Bahado-Singh et al. (2016) 27. In brief, all brain specimens were weighed and defrosted on ice. Subsequently, samples were milled and extracted in 50 % methanol/water (1 g/ml) in a sterile 2 ml Eppendorf tube. Samples were mixed for 20 min, sonicated for 15 min and the protein removed via centrifugation at 13,000 g at 4 ºC for 30 min. Supernatants were collected and dried under vacuum using a Savant DNA Speedvac (Thermo Scientific, USA) and reconstituted in 285 μL of 50 mM potassium phosphate buffer (pH 7.0), 30 μL of Sodium 2,2-dimethyl-2-silapentane-5-sulfonate (DSS) and 35 μL of D2O 28. 200 μL of the reconstituted sample was transferred to a 3 mm Bruker NMR tube for NMR analysis. All samples were housed at 4°C in a thermostatically controlled SampleJet autosampler (Bruker-Biospin, USA) and heated to room temperature over 3 min prior to analysis by NMR.
1H NMR Analysis
All 1H NMR data were acquired using a pulse sequence developed by Ravanbakhsh et al. (2015) 28. In brief, all samples were analyzed in a randomized order and all data acquired at 300 (±0.5) K on a Bruker Avance III HD 600 MHz spectrometer (Bruker-Biospin, USA) coupled with a 5 mm TCI cryoprobe. For each analysis, 256 transients were collected as 64 k data points with a spectral width of 12 kHz (20 ppm), and inter-pulse delay of 9.65 sec. In addition, the data collection protocol included 3-dimensional shimming using the z-axis profile of the deuterium solvent signal, receiver gain adjustment and acquisition. The free induction decay (FID) signal was zero filled to 128 k and exponentially multiplied with a 0.1 Hz apodization factor. The zero and first order phase constants were manually optimized following Fourier transformation and for accurate quantification a polynomial baseline correction of the FID (degree 5) was applied. All acquired data were analyzed using a custom library encompassing 71 metabolites using NMR Profiler v8.1 (Chenomx, Alberta, Canada).
DI-LC-MS/MS Analysis
All targeted quantitative metabolomics analysis of the serum was performed by combining direct injection (DI) mass spectrometry with a commercially available reverse phase LC-MS/MS kit (BiocrateIDQ p180™; Biocrates Life Sciences, Innsbruck, Austria) as previously reported by our group 29. In brief, data were acquired on a Waters TQ-S spectrometer coupled with an Acquity I-Class ultra-pressure liquid chromatography (UPLC) system. All serum specimens were acquired in accordance with the protocol as described in the AbsoluteIDQ manual. All data analysis was completed using the Biocrates MetIDQ software.
Statistical Analysis
All data were analyzed using MetaboAnalyst (v3.0) 30. A Students T-test was performed on all data acquired using both 1H NMR (brain) and DI-LC-MS/MS (serum) to determine if there were any significantly different metabolites between prodromal PD and age matched controls (p<0.05). In the case where data were considered non-normally distributed a Mann-Whitney U test was used to calculate significance. Bonferroni corrected p-values were used to correct for multiple comparisons.
Prior to multivariate analyses all data were normalized to the sum and autoscaled. The data were analyzed using principal components analysis (PCA) and partial least squares discriminant analysis (PLS-DA). The multivariate models were validated using permutation testing (2000 repeats) to determine if the observed separation was significant. This was accomplished by randomly relabeling the data and running the PLS-DA analysis again. The most discriminatory metabolites were identified from the variable importance in projection (VIP) plots.
To select the predictor variables used in the logistic regression analyses, Least Absolute Shrinkage and Selection Operator (LASSO) and stepwise variable selection were utilized for optimizing all the model components 31. A k-fold cross-validation (CV) technique was used to show the models were not over fit and to assess potential predictive accuracy in an independent sample 32. Area under the curve (AUC (95% confidence interval)), sensitivity and specificity values were calculated to estimate the performance of the logistic regression and ROC analyses. For the ROC analysis of the brain data we implemented a linear support vector machine algorithm and for the serum data we used a logistic regression algorithm for the analyses.
Random Forrest and Logistic Elastic Net
To classify huMonomer vs PFFs a random forest with 2,000 trees was fit to serum measurements using R v 3.4.1 (https://cran.r-project.org/) and the package party (http://party.r-forge.r-project.org/). Due to correlation within predictors, we used a conditionally unbiased tree algorithm (https://epub.ub.uni-muenchen.de/9387/1/techreport.pdf). The proximity matrix returned from this random forest was used to create a multi-dimensional scaling plot (MDS). We then constructed an ROC curve by applying out-of-bag predictions and estimated the 95% confidence interval for the area under the ROC curve (AUC) by utilizing 2,000 bootstraps. We also assess the predictive capabilities of these data 33 by Logistic elastic-net regression via the R package glmnet (https://www.jstatsoft.org/article/view/v033i01). The ridge/LASSO tuning parameter was set such that they were given an even contribution (alpha = 0.5) and the second tuning parameter was set such that deviance was minimized based on 10-fold cross-validation and no more than 10 variables were selected. From the predictions based on this model, we then established an ROC curve and estimated the 95% confidence interval for the AUC by applying 2,000 bootstraps.
Metabolites Pathway Enrichment Analysis
Metabolites pathway enrichment analysis (MSEA) was completed using MetaboAnalyst (v3.0) 34. Metabolites names were converted to Human Metabolite Database (HMDB) identifiers and the raw data imported in rows, normalized to the sum and autoscaled. The pathway associated metabolite sets was the chosen metabolite library and all compounds in this library were used. Pathways with a Holm corrected p-value and a false discovery rate (fdr) <0.05 were considered altered due to prodromal PD.
RESULTS
To characterize the biochemical profile of mice developing early α-syn pathology, we used 1H NMR and DI-LC-MS/MS to analyze brain tissue (hemisphere ipsilateral and contralateral to the α-syn PFF injection into the olfactory bulb) and serum, respectively. In mice injected unilaterally with PFFs, α-syn pathology develops mainly in brain regions located in the ipsilateral hemisphere. Pathology is also present in contralateral hemisphere, but to a lesser extent 15–16.
Brain tissue analysis
We first analyzed ipsilateral and contralateral hemispheres of the mice injected with α-syn huMonomers (control mice) or α-syn PFFs (prodromal PD model) at 3 months post-injection. A total of 71 and 182 metabolites were accurately identified and quantified in post-mortem brain tissue and serum using 1H NMR and DI-LC-MS/MS, respectively. Using these metabolite concentrations, we developed 4 pair wise models for brain tissue and no significant differences were observed for each of the recorded metabolites between the ipsilateral and contralateral regions (P<0.05; fdr<0.05). Of the 71 measured metabolites, none reached statistical significance when compared between HuMonomer and PFF mice (P<0.05; fdr<0.05; Supplementary Table 1). Multivariate analysis of the data, acquired from the different hemispheres also revealed no significant differences between brain regions; as a result, we pooled the data for each individual mouse based on the results of the univariate and multivariate analyses.
Subsequently, we performed multivariate analysis of the 1H NMR acquired data from the pooled brain specimens. The Scores plot and its respective VIP plot highlighting which metabolites are responsible for the observed separation is presented in Figure 1. We observe a clear separation between the two groups and following permutation testing (2000 repeats) the PLS-DA model produced a p-value = 0.001, indicating that the observed separation is indeed significant and not due to overfitting. Additionally, following a 10-fold cross validation of the model we determined that it had 87 % predictive power. Figure 1b lists the metabolites responsible for the observed separation of which taurine has the greatest impact.
Figure 1.
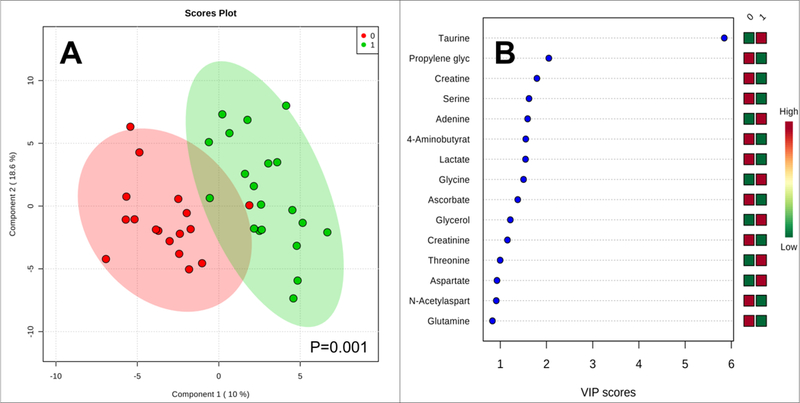
(a) PLS-DA plots for the 1H NMR acquired brain data. 0 = huMonomer mice; 1 = PFF mice; (b) the VIP plot for HuMonomers injected mouse brains vs. PFFs.
We then performed a logistic regression analysis on the 1H NMR acquired brain data (Figure 2). Using the concentrations of serine, taurine, 3-hydroxybutyrate and threonine as chosen using the LASSO method for model optimization and following cross validation (1000 permutations), we observe significant separation (p < 0.001) between HuMonomer and PFF treated mice. We developed a logistic regression algorithm with an AUC (95% CI) = 0.942 (0.874–1.000) with corresponding sensitivity and specificity equal to 0.923 (0.923–1.000) and 0.970 (0.911–1.000) respectively, following 10-fold cross validation. Table 1 lists the summary of each feature used to develop the following predictive algorithm:
Figure 2.
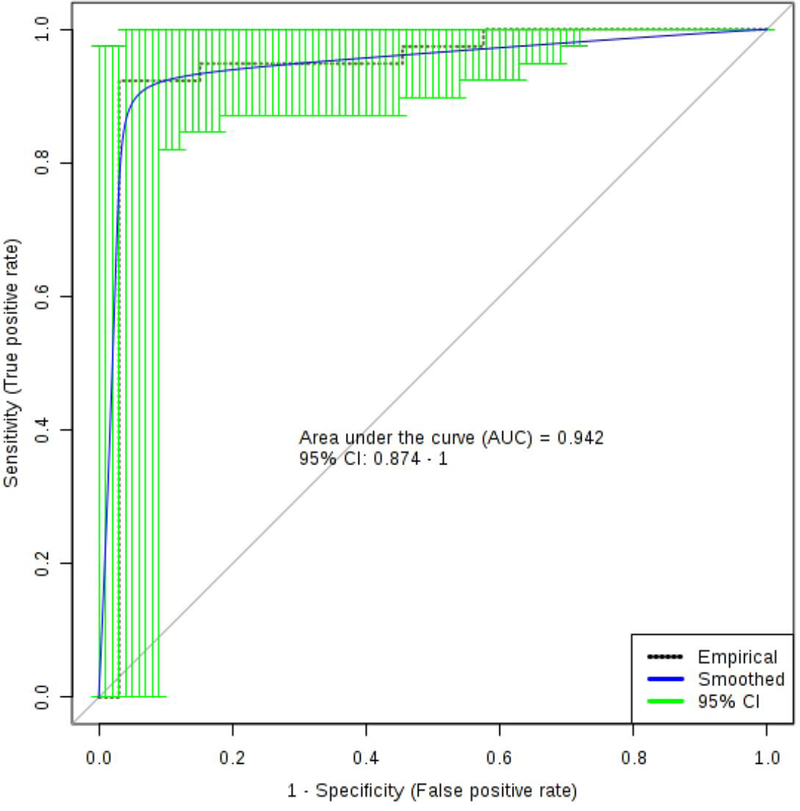
The logistic regression curve for the brain panel of biomarkers to include: serine, taurine, 3-hydroxybutyrate and threonine.
Table 1.
Summary of each feature used to develop the logistic regression predictive algorithm for prodromal Parkinson’s disease using brain tissue.
| Estimate | Std. Error | z value | Pr(>|z|) | Odds | |
|---|---|---|---|---|---|
| (Intercept) | 0.399 | 0.492 | 0.811 | 0.418 | - |
| Serine | −1.824 | 0.769 | −2.372 | 0.018 | 0.16 |
| Taurine | 1.902 | 0.752 | 2.529 | 0.011 | 6.7 |
| 3-Hydroxyisobutyrate | −2.232 | 0.662 | −3.372 | 0.001 | 0.11 |
| Threonine | 2.164 | 0.821 | 2.634 | 0.008 | 8.7 |
where P is Pr(y=1|x). The best threshold (or Cutoff) for the predicted P is 0.53.
Original Label: HuMonomers/PFFs --> Labels in Logistic Regression: 0/1
Note. The class/response value is recommended as (Case:1 and Control:0)
Serum samples analysis
We analyzed the serum of mice 3 months after injection of α-syn huMonomer or α-syn PFFs. Of the 182 metabolites measured in serum using DI-LC-MS/MS only 5 metabolites were found to be at statistically significantly different concentrations (P<0.05; fdr<0.05). These include 3 acylcarnitines (decadienylcarnitine, tetradecenoyl carnitine and hydroxytetradecadienylcarnitine), 1 glycerophospholipid (PC ae C34:0) and trans 4-hydroxypoline. The serum data acquired using DI-LC-MS/MS were examined by PLS-DA analysis (Figure 3). Modest separation can be observed between the serum from PFF mice and HuMonomer mice, however following permutation testing (2000 repeats) the model was found not to be significant (p=0.1035).
Figure 3.
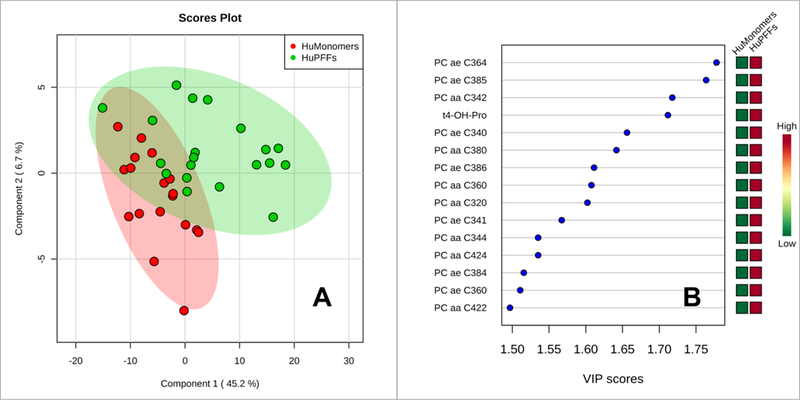
Results of the PLS-DA analysis from the serum data as acquired using DI-LC-MS/MS. Red Circles-HuMonomer injected mice; Green Circles-PFF injected mice.
We subsequently analyzed the serum data by logistic regression analysis (Figure 4). Using the concentrations of 3 glycerophospholipids, namely PC ae C36:4, PC ae C38:5, PC aa C34:2 and trans 4-hydroxyproline, we developed a predictive algorithm with an AUC (95% CI) = 0.836 (0.696–0.977) with corresponding sensitivity and specificity equal to 0.800 (0.800–0.975) and 0.889 (0.744–1.00) respectively, following 10-fold cross validation. All metabolites were recorded at concentrations above the limits of detection (LOD) and limits of quantification (LOQ) except for trans-4-hydroxyproline which fell slightly below the LOQ of 10 μM (average value = 7.6 μM). No zero values were recorded for any metabolite used in the logistic regression model. We have provided scatter plots for the individual biomarkers used to create the logistic regression model in Supplementary Figure 2. Table 2 lists the summary of each feature used to develop the following predictive algorithm:
Figure 4.
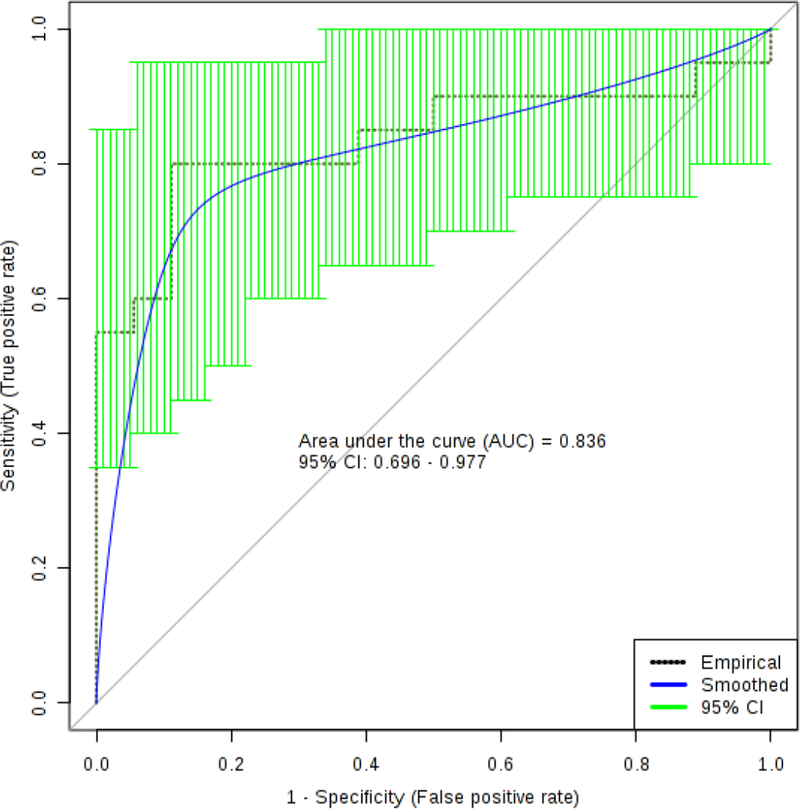
The logistic regression curve for the serum panel of biomarkers to include: decadienylcarnitine, tetradecenoyl carnitine, hydroxytetradecadienylcarnitine), PC ae C34:0 and trans 4-hydroxypoline.
Table 2.
Summary of each feature used to develop the logistic regression predictive algorithm for prodromal Parkinson’s disease in serum.
| Estimate | Std. Error | z value | Pr(>|z|) | Odds | |
|---|---|---|---|---|---|
| (Intercept) | 0.981 | 0.723 | 1.357 | 0.175 | - |
| PC ae C36:4 | 3.34 | 4.863 | 0.687 | 0.492 | 28.23 |
| t4-OH-Pro | 2.768 | 1.414 | 1.958 | 0.05 | 15.93 |
| PC ae C38:5 | −1.326 | 4.027 | −0.329 | 0.742 | 0.27 |
| PC aa C34:2 | −1.076 | 1.306 | −0.824 | 0.41 | 0.34 |
where P is Pr(y=1|x). The best threshold (or Cutoff) for the predicted P is 0.53.
Original Label: HuMonomers/PFFs --> Labels in Logistic Regression: 0/1
Note. The class/response value is recommended as (Case:1 and Control:0)
Serum data were then analyzed by Random Forrest and logistic elastic net analysis (Figure 5). Multidimensional scaling plot enables the visualization of the separation between the serum from α-syn PFF and α-syn HuMonomers mice. The distance between the individual groups is based on the Random Forrest fit and was developed using the concentration of all the metabolites (AUC (95% CI) = 0.869 (0.760–0.979). The top metabolites responsible for the observed separation are presented in Figure 5b. The Random Forrest analysis was then repeated using the top 5 metabolites identified using the Random Forrest method, namely trans 4-hydroxypoline, C14:1, C12:1, PC ae C34:0 and C14:2-OH. We used the concentration values of these metabolites to develop a predictive model with an AUC (95% CI) = 0.864 (0.754–0.974). We then used the concentration values of the top 6 metabolites identified by Elastic Net Regression to develop a predictive model evaluated using an ROC curve (Figure 5d). The model produced an AUC (95% CI) = 0.861 (0.755–0.968). As previously for the logistic regression model, all metabolites were at concentrations above the limits of detection (LOD) and limits of quantification (LOQ) except for trans-4-hydroxyproline. No zero values were recorded for any metabolite used in the logistic regression model. We have included scatter plots for the individual biomarkers used in this model as Supplementary Figure 3.
Figure 5.
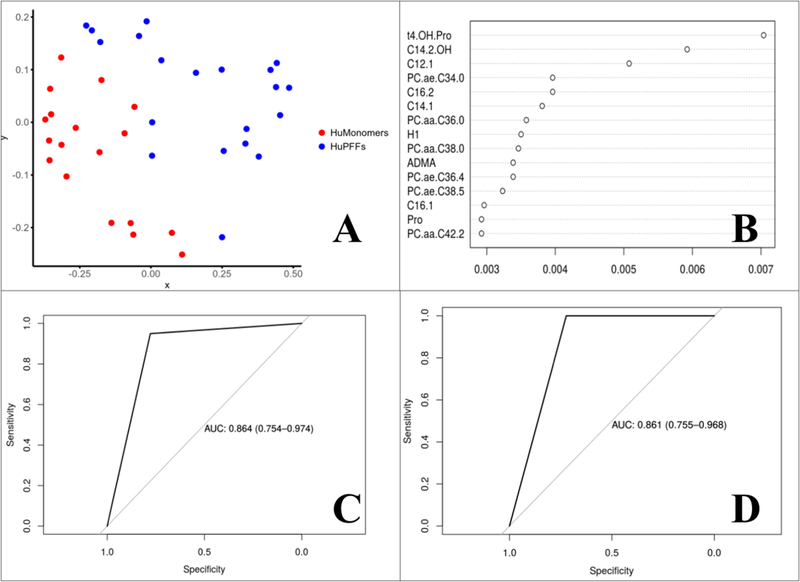
Results of the Random Forest and Logistic elastic net analysis. a) Multidimensional scaling plot fit based on the results of the Random Forest analysis; b) Logistic elastic net metabolite table listing each in terms of importance to the model; c) ROC analysis from the Random Forest analysis using all metabolites to predict which mice are in the prodromal phase; d) ROC analysis from the Random Forest analysis using a subset of metabolites to predict which mice are in the prodromal phase.
Finally, we performed pathway enrichment analysis for both brain tissue (Figure 6A) and serum (Figure 6) samples. In the brain samples, 14 biochemical pathways were identified as being significantly perturbed (Holm adjusted p<0.05; fdr<0.05) in PFF mice. The top 4 biochemical pathways include: taurine and hypotaurine metabolism, bile acid biosynthesis, glycine, serine and threonine metabolism and the citric acid cycle. A list of all the biochemical pathways that were considered significantly perturbed in the brain of mice injected with α-syn PFFs into the olfactory bulb is available as Supplementary Table 2. Contrastingly, in serum samples, only phospholipid metabolism was found to be significantly disturbed between α-syn HuMonomer and α-syn PFF mice (Holm adjusted p<0.05; fdr<0.05).
Figure 6.
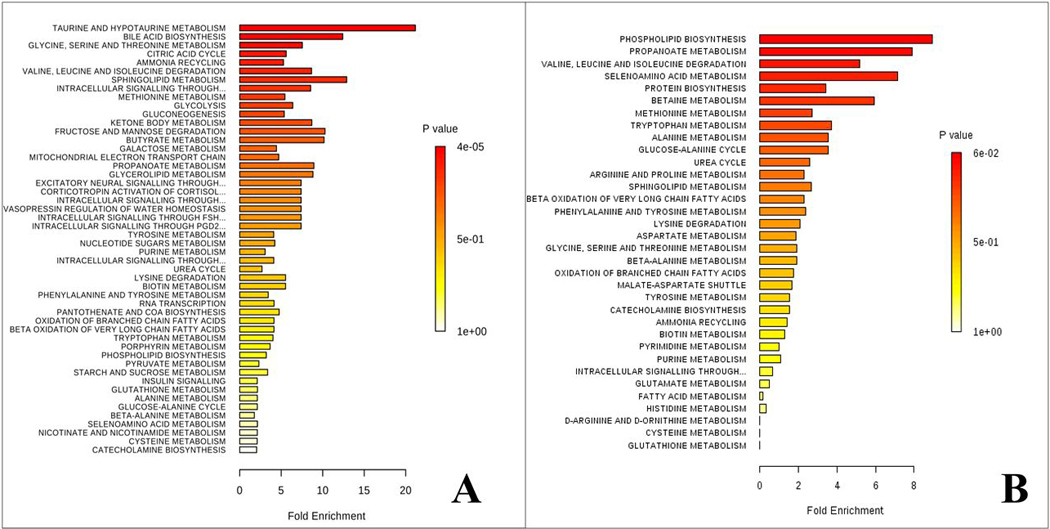
Results of the metabolite pathway enrichment analysis. a) Brain pathway analysis results from HuMonomer vs. PFF mice; b) Serum pathway results from HuMonomer vs. PFF injected mice.
DISCUSSION
This is the first study to employ quantitative, global metabolomics approaches to profile post-mortem brain and serum from a validated mouse model of prodromal PD. We demonstrate changes in brain and serum biochemistry of mice that develop progressive brain synucleinopathy.
Statistical Models
Contrary to what we initially hypothesized, no differences were observed between the ipsilateral and contralateral hemispheres of the brain. The absence of difference between the ipsilateral and the contralateral side is consistent with the fact that pathology induced by an injection of α-syn PFFs unilaterally into one OB spreads to both hemispheres, ipsilaterally and contralaterally, albeit to a greater extent on the ipsilateral side 15. Because the two sides of the brain did not differ in our initial analysis, subsequently we pooled the data from both hemispheres. Evident from the scores plot, we observed significant separation between the α-syn huMonomers and α-syn PFFs with the major metabolites responsible for the separation being taurine, propylene glycol, creatine, serine and adenine. Taurine and adenine were found to be upregulated in α-syn PFF mice while propylene glycol, creatine and serine were downregulated when compared with α-syn HuMonomer mice.
Using logistic regression analysis, we developed a model which accurately distinguished between the two treatment groups. We developed a predictive algorithm using the pooled 1H NMR acquired data which had an AUC (95% CI) = 0.942 (0.874–1.000) with corresponding sensitivity and specificity equal to 0.923 (0.923–1.000) and 0.970 (0.911–1.000). To our knowledge, no model currently exists which accurately distinguishes between control and prodromal PD mouse brain with such a high degree of accuracy.
While we are able to distinguish controls from the α-syn PFF-mice brains using 1H NMR, we ideally wanted to develop a statistical test using less invasive biomatrices, such as serum, to predict those entering the early stages of PD, which is viewed as the ideal stage at which to apply neuroprotective and disease-modifying strategies 35. Using multivariate analyses, we demonstrated modest separation between the two groups, however following cross validation (2000 permutations) the model was found not to be statistically significant (p=0.1035). Also, we demonstrated that the metabolites accounting for the differences between the groups were all phospholipids except for trans-4-hydroxyproline. While verging on statistical significance, we believe that we have an underpowered sample set, and that with increased numbers, we would indeed see significant separation between the two groups.
Using logistic regression analysis and data acquired from serum, we developed an accurate predictive algorithm capable of discriminating between the two experimental groups (α-syn PFF and α-syn huMonomers) with an AUC (95% CI) = 0.836 (0.696–0.9777) with high sensitivity and specificity values (0.800 (0.800–0.975) and 0.889 (0.744–1.00), respectively) following cross validation.
In an aid to be more stringent in our attempts to distinguish between the two groups, we employed machine-based learning which applies more rigorous criteria for predicting groups. We employed Random Forrest and Logistic elastic-net for the development of predictive models. Logistic elastic-net functions extremely well at variable selection for binary variables when some, or many, of the potential predictors are correlated. Further, it has been suggested that Logistic elastic-net out performs LASSO when it comes to predictive accuracy 33. Using Random Forrest, we achieved complete separation on the multidimensional scaling plot, in which the distances are directly related to the Random Forrest fit. This separation is much better than we originally viewed using the PLS-DA technique. We identified the top metabolites responsible for the variation between the two groups using this methodology, with the major group consisting of acylcarnitines and trans-4-hydroxyproline. Using the Logistic elastic-net method we developed a model with a high AUC (0.864 (0.754–0.974), however it is not ideal to use a panel of biomarkers consisting of 182 compounds. To overcome this issue, we developed a Logistic elastic-net model with the top 6 performing metabolites to include C10:2, C12:1, C14:1, C14:2-OH, PC ae 34:0 and trans 4-hydroxyproline. The model performed exceedingly well with an AUC = 0.861 (0.755–0.968). To our knowledge, no test currently exists which can accurately diagnose prodromal PD mice using serum with such sensitivity and specificity.
Pathway Enrichment Analysis of the Brain Data
When we analyzed the pooled brain data, we found only 14 metabolic pathways to be significantly perturbed (Holm adjusted p<0.05; fdr<0.05) in PFF mice and these include (but not limited to) taurine and hypotaurine metabolism, bile acid biosynthesis, glycine, serine and threonine metabolism and the citric acid cycle.
Most notably, taurine and hypotaurine metabolism was the major pathway found to be significantly perturbed in the brain of PFF treated mice. Taurine has several biologic functions within the brain and interestingly its role in conjugating bile acids to form water soluble bile salts such as tauroursodeoxycholic acid (TUDCA) from ursodeoxycholic acid (UDCA), play pivotal neuroprotective roles within the brain [9]. A disruption in the pathway could signal that the brain is producing more secondary bile acids to defend against the aggregation of α-syn.
Another important biochemical pathway to be perturbed due to triggering of widespread α-syn pathology by injection of α-syn PFF into the olfactory bulb was bile acid metabolism. Bile acids have long been used as therapeutic agents in medicine, yet for all the evidence supporting a neuroprotective role in neurodegenerative disorders, very little is known about their molecular mechanisms in the central nervous system 36. Secondary bile acids, UDCA and its taurine-conjugated form, TUDCA may function in part as chaperones, reducing the formation of toxic aggregates in protein folding diseases 37–38. As mentioned, their actual biologic roles are poorly understood and may be multifactorial, with evidence being reported for reducing reactive oxygen species formation 39, inhibition of apoptosis 40 and the prevention of mitochondrial dysfunction 41.
We also identified glycine, serine and threonine metabolism and the citric acid cycle to be significantly disrupted pathways in the brain of PFF mice. Threonine is a large neutral amino acid which is converted to both glycine and serine in the brain 42. Glycine is in turn converted to creatine whose primary function is recycling ADP to produce ATP (the major energy source in the brain) by donating phosphate groups 43. The citric acid cycle or tricarboxylic acid cycle occurs in the matrix of the mitochondrion and is responsible for the release of energy in the form of ATP through the oxidation of Acetyl-CoA 44. A combination of these disturbed biochemical pathways (to include bile acid biosynthesis) would suggest that energy metabolism and mitochondrial dysfunction in particular, are influential in the onset/progression of α-syn pathology in our mouse model of prodromal PD. Mitochondrial dysfunction, specifically a deficiency in complex one of the electron transport chain, has been associated with PD previously 45–46 and the majority of studies suggest that this deficiency is limited to brain regions that are pathologically affected as in this study (cerebellum removed as no pathology observed) 47. Our data may also suggest that in the brains of α-syn PFF injected mice, where α-syn pathology is beginning to propagate, energy metabolism is significantly affected due to α-syn aggregation and the development of neurodegeneration 16.
Metabolite Set Enrichment Analysis of the serum of PFFs mice
The results of the serum pathway enrichment analysis highlighted only phospholipid metabolism to be significantly perturbed in α-syn PFF injected mice. It has been hypothesized that disruption in lipid metabolism contributes to neurodegenerative diseases 48–49 and lipids can interact with α-syn and promote its aggregation 50–52. However, it is not always evident if the changes in lipid concentrations or chemical properties could contribute to the aggregation of α-syn via a direct interaction with the protein or via the influence of other cellular processes which subsequently lead to an increase in α-syn 53. While these changes have only ever been reported in the brain, we speculate that regions which control endocrine and metabolic functions (e.g. hypothalamus) may play a direct role in the disruption of this biochemical pathway.
This study demonstrates the potential of metabolomics for identifying potential biomarkers of prodromal PD while giving a previously unreported insight into the underlying pathogenesis of the disease. Our study is not without its limitations. First, our sample size was modest, however following a power calculation of the available data, with 20 HuMonomers and 20 PFF treated mice, this study was well-powered to detect most, if not all, “huge” and “very large” effects after false discovery rate multiple testing adjustments 54. We have, however, likely failed to detect the majority of true large and medium effects. Therefore, there is likely room to improve upon our estimated predictive accuracy. We have included additional information as Supplementary Table 3. To compensate for this, we have been extremely stringent in our statistical analyses, employing rigorous cross validation techniques such as permutation testing (2000 iterations), 10-fold CV and employing Logistic elastic-net and LASSO methods for variable selection.
CONCLUSIONS
We report for the first time, serum biomarkers capable of identifying mice with developing synucleinopathy. Further, we have highlighted biochemical pathways which were previously unreported to be associated with the underlying pathogenesis of PD. Finally, a more precise understanding of PD mechanism as yielded by this approach, will increase the chances of the identification of novel pharmacological therapies for the prevention and treatment of PD. Our results demonstrate the usefulness of these techniques for the study of synucleinopathy in mice and warrant a larger longitudinal study to investigate the biochemical changes in the brain as the pathology progresses. Moreover, we need to test the reported biomarkers in human cohorts to determine their clinical utility for the identification of those people at greatest risk of developing PD.
Supplementary Material
ACKNOWLEDGEMENTS
We would like to thank Mrs. Anne Whitlaw for her charitable donation which helped to fund the metabolomics section of this work. In addition, this work was partly funded by the generous contribution made by the Fred A. & Barbara M. Erb Foundation. We acknowledge the Van Andel Research Institute and the many individuals and corporations that financially support research into neurodegenerative disease at the Institute. N.L.R. is supported by the Peter C. and Emajean Cook Foundation. P.B. is supported by grants from the National Institutes of Health (1R01DC016519–01 and 5R21NS093993–02). P.B. reports additional grants from Office of the Assistant Secretary of Defense for Health Affairs (Parkinson’s Research Program, Award No. W81XWH-17–1-0534), The Michael J Fox Foundation, National Institutes of Health, Cure Parkinson’s Trust, which are outside but relevant to the submitted work.
Footnotes
DATA AVAILABILITY
The mass spectrometry data have been deposited to MetaboLights Archive (https://www.ebi.ac.uk/metabolights/mysubmissions?status=PRIVATE) via the MetaboLights partner repository with the data set# MTBLS674. Username: ali.yilmaz@beaumont.org and study ID is MTBLS674.
CONFLICT OF INTEREST
PB has received commercial support as a consultant from Renovo Neural, Inc., Cellular Dynamics International, Axial Biotherapeutics, Roche, Teva Inc, Lundbeck A/S, NeuroDerm, AbbVie, ClearView Healthcare, FCB Health, IOS Press Partners and Capital Technologies, Inc. He is conducting sponsored research on behalf of Roche and Lundbeck A/S. He has ownership interests in Acousort AB. The other authors report no conflicts of interest.
SUPPORTING INFROMATION
The following supporting information is available free of charge at ACS website http://pubs.acs.org.
References
- 1.Goedert M, Alpha-synuclein and neurodegenerative diseases. Nature reviews. Neuroscience 2001, 2 (7), 492–501. [DOI] [PubMed] [Google Scholar]
- 2.Tysnes O-B; Storstein A, Epidemiology of Parkinson’s disease. Journal of Neural Transmission 2017, 124 (8), 901–905. [DOI] [PubMed] [Google Scholar]
- 3.von Campenhausen S; Bornschein B; Wick R; Bötzel K; Sampaio C; Poewe W; Oertel W; Siebert U; Berger K; Dodel R, Prevalence and incidence of Parkinson’s disease in Europe. European Neuropsychopharmacology 2005, 15 (4), 473–490. [DOI] [PubMed] [Google Scholar]
- 4.de Lau LM; Breteler MM, Epidemiology of Parkinson’s disease. The Lancet. Neurology 2006, 5 (6), 525–35. [DOI] [PubMed] [Google Scholar]
- 5.Xia R; Mao ZH, Progression of motor symptoms in Parkinson’s disease. Neuroscience bulletin 2012, 28 (1), 39–48. [DOI] [PMC free article] [PubMed] [Google Scholar]
- 6.Moustafa AA; Chakravarthy S; Phillips JR; Gupta A; Keri S; Polner B; Frank MJ; Jahanshahi M, Motor symptoms in Parkinson’s disease: A unified framework. Neuroscience and biobehavioral reviews 2016, 68, 727–740. [DOI] [PubMed] [Google Scholar]
- 7.Postuma RB; Aarsland D; Barone P; Burn DJ; Hawkes CH; Oertel W; Ziemssen T, Identifying prodromal Parkinson’s disease: pre-motor disorders in Parkinson’s disease. Movement disorders : official journal of the Movement Disorder Society 2012, 27 (5), 617–26. [DOI] [PubMed] [Google Scholar]
- 8.Lee VM; Trojanowski JQ, Mechanisms of Parkinson’s disease linked to pathological alpha-synuclein: new targets for drug discovery. Neuron 2006, 52 (1), 33–8. [DOI] [PubMed] [Google Scholar]
- 9.Goedert M; Spillantini MG; Del Tredici K; Braak H, 100 years of Lewy pathology. Nature reviews. Neurology 2013, 9 (1), 13–24. [DOI] [PubMed] [Google Scholar]
- 10.Braak H; Ghebremedhin E; Rub U; Bratzke H; Del Tredici K, Stages in the development of Parkinson’s disease-related pathology. Cell and tissue research 2004, 318 (1), 121–34. [DOI] [PubMed] [Google Scholar]
- 11.Braak H; Del Tredici K; Rub U; de Vos RA; Jansen Steur EN; Braak E, Staging of brain pathology related to sporadic Parkinson’s disease. Neurobiology of aging 2003, 24 (2), 197–211. [DOI] [PubMed] [Google Scholar]
- 12.Del Tredici K; Braak H, Review: Sporadic Parkinson’s disease: development and distribution of α-synuclein pathology. Neuropathology and Applied Neurobiology 2016, 42 (1), 33–50. [DOI] [PubMed] [Google Scholar]
- 13.Hawkes CH; Del Tredici K; Braak H, A timeline for Parkinson’s disease. Parkinsonism & related disorders 2010, 16 (2), 79–84. [DOI] [PubMed] [Google Scholar]
- 14.Ghosh A; Tyson T; George S; Hildebrandt EN; Steiner JA; Madaj Z; Schulz E; Machiela E; McDonald WG; Escobar Galvis ML; Kordower JH; Van Raamsdonk JM; Colca JR; Brundin P, Mitochondrial pyruvate carrier regulates autophagy, inflammation, and neurodegeneration in experimental models of Parkinson’s disease. Science translational medicine 2016, 8 (368), 368ra174. [DOI] [PubMed] [Google Scholar]
- 15.Rey NL; Steiner JA; Maroof N; Luk KC; Madaj Z; Trojanowski JQ; Lee VM-Y; Brundin P, Widespread transneuronal propagation of α-synucleinopathy triggered in olfactory bulb mimics prodromal Parkinson’s disease. The Journal of Experimental Medicine 2016, 213 (9), 1759–1778. [DOI] [PMC free article] [PubMed] [Google Scholar]
- 16.Rey NL; George S; Steiner JA; Madaj Z; Luk KC; Trojanowski JQ; Lee VM-Y; Brundin P, Spread of aggregates after olfactory bulb injection of α-synuclein fibrils is associated with early neuronal loss and is reduced long term. Acta Neuropathologica 2018, 135 (1), 65–83. [DOI] [PMC free article] [PubMed] [Google Scholar]
- 17.Nicholson JK; Lindon JC, Systems biology: metabonomics. Nature 2008, 455 (7216), 1054–1056. [DOI] [PubMed] [Google Scholar]
- 18.Wishart DS; Knox C; Guo AC; Eisner R; Young N; Gautam B; Hau DD; Psychogios N; Dong E; Bouatra S, HMDB: a knowledgebase for the human metabolome. Nucleic acids research 2009, 37 (suppl 1), D603–D610. [DOI] [PMC free article] [PubMed] [Google Scholar]
- 19.Graham SF; Turkoglu O; Kumar P; Yilmaz A; Bjorndahl TC; Han B; Mandal R; Wishart DS; Bahado-Singh RO, Targeted Metabolic Profiling of Post-Mortem Brain from Infants Who Died from Sudden Infant Death Syndrome. J Proteome Res 2017, 16 (7), 2587–2596. [DOI] [PubMed] [Google Scholar]
- 20.Bogdanov M; Matson WR; Wang L; Matson T; Saunders-Pullman R; Bressman SS; Beal MF, Metabolomic profiling to develop blood biomarkers for Parkinson’s disease. Brain 2008, 131 (2), 389–396. [DOI] [PubMed] [Google Scholar]
- 21.Johansen KK; Wang L; Aasly JO; White LR; Matson WR; Henchcliffe C; Beal MF; Bogdanov M, Metabolomic Profiling in LRRK2-Related Parkinson’s Disease. PLOS ONE 2009, 4 (10), e7551. [DOI] [PMC free article] [PubMed] [Google Scholar]
- 22.Chen X; Xie C; Sun L; Ding J; Cai H, Longitudinal Metabolomics Profiling of Parkinson’s Disease-Related α-Synuclein A53T Transgenic Mice. PLOS ONE 2015, 10 (8), e0136612. [DOI] [PMC free article] [PubMed] [Google Scholar]
- 23.LeWitt PA; Li J; Lu M; Guo L; Auinger P, Metabolomic biomarkers as strong correlates of Parkinson disease progression. Neurology 2017, 88 (9), 862–869. [DOI] [PMC free article] [PubMed] [Google Scholar]
- 24.Volpicelli-Daley LA; Luk KC; Lee VM, Addition of exogenous alpha-synuclein preformed fibrils to primary neuronal cultures to seed recruitment of endogenous alpha-synuclein to Lewy body and Lewy neurite-like aggregates. Nature protocols 2014, 9 (9), 2135–46. [DOI] [PMC free article] [PubMed] [Google Scholar]
- 25.Rey NL; Petit GH; Bousset L; Melki R; Brundin P, Transfer of human alpha-synuclein from the olfactory bulb to interconnected brain regions in mice. Acta Neuropathol 2013, 126 (4), 555–73. [DOI] [PMC free article] [PubMed] [Google Scholar]
- 26.Graham SF; Holscher C; McClean P; Elliott CT; Green BD, 1H NMR metabolomics investigation of an Alzheimer’s disease (AD) mouse model pinpoints important biochemical disturbances in brain and plasma. Metabolomics 2013, 9 (5), 974–983. [Google Scholar]
- 27.Bahado-Singh RO; Graham SF; Turkoglu O; Beauchamp K; Bjorndahl TC; Han B; Mandal R; Pantane J; Kowalenko T; Wishart DS; Stahel PF, Identification of candidate biomarkers of brain damage in a mouse model of closed head injury: a metabolomic pilot study. Metabolomics 2016, 12 (3), 42. [Google Scholar]
- 28.Ravanbakhsh S; Liu P; Bjordahl TC; Mandal R; Grant JR; Wilson M; Eisner R; Sinelnikov I; Hu X; Luchinat C; Greiner R; Wishart DS, Accurate, fully-automated NMR spectral profiling for metabolomics. PLoS One 2015, 10 (5), e0124219. [DOI] [PMC free article] [PubMed] [Google Scholar]
- 29.Bahado-Singh RO; Graham SF; Han B; Turkoglu O; Ziadeh J; Mandal R; Er A; Wishart DS; Stahel PL, Serum metabolomic markers for traumatic brain injury: a mouse model. Metabolomics 2016, 12 (6), 100. [Google Scholar]
- 30.Xia J; Sinelnikov IV; Han B; Wishart DS, MetaboAnalyst 3.0—making metabolomics more meaningful. Nucleic Acids Research 2015, 43 (W1), W251–W257. [DOI] [PMC free article] [PubMed] [Google Scholar]
- 31.Tibshirani R, Regression Shrinkage and Selection via the Lasso. Journal of the Royal Statistical Society. Series B (Methodological) 1996, 58 (1), 267–288. [Google Scholar]
- 32.Xia J; Psychogios N; Young N; Wishart DS, MetaboAnalyst: a web server for metabolomic data analysis and interpretation. Nucleic Acids Res 2009, 37 (Web Server issue), W652–60. [DOI] [PMC free article] [PubMed] [Google Scholar]
- 33.Zou H; Hastie T, Regularization and variable selection via the elastic net. Journal of the Royal Statistical Society: Series B (Statistical Methodology) 2005, 67 (2), 301–320. [Google Scholar]
- 34.Xia J; Wishart DS, Using MetaboAnalyst 3.0 for Comprehensive Metabolomics Data Analysis. Current Protocols in Bioinformatics 2016, 1410. 1-–14..10. 91. [DOI] [PubMed] [Google Scholar]
- 35.Espay AJ; Schwarzschild MA; Tanner CM; Fernandez HH; Simon DK; Leverenz JB; Merola A; Chen-Plotkin A; Brundin P; Kauffman MA; Erro R; Kieburtz K; Woo D; Macklin EA; Standaert DG; Lang AE, Biomarker-driven phenotyping in Parkinson’s disease: A translational missing link in disease-modifying clinical trials. Movement disorders : official journal of the Movement Disorder Society 2017, 32 (3), 319–324. [DOI] [PMC free article] [PubMed] [Google Scholar]
- 36.Ackerman HD; Gerhard GS, Bile Acids in Neurodegenerative Disorders. Frontiers in Aging Neuroscience 2016, 8, 263. [DOI] [PMC free article] [PubMed] [Google Scholar]
- 37.Geier A; Wagner M; Dietrich CG; Trauner M, Principles of hepatic organic anion transporter regulation during cholestasis, inflammation and liver regeneration. Biochimica et biophysica acta 2007, 1773 (3), 283–308. [DOI] [PubMed] [Google Scholar]
- 38.Cortez LM; Campeau J; Norman G; Kalayil M; Van der Merwe J; McKenzie D; Sim VL, Bile Acids Reduce Prion Conversion, Reduce Neuronal Loss, and Prolong Male Survival in Models of Prion Disease. Journal of Virology 2015, 89 (15), 7660–7672. [DOI] [PMC free article] [PubMed] [Google Scholar]
- 39.Rodrigues CM; Fan G; Wong PY; Kren BT; Steer CJ, Ursodeoxycholic acid may inhibit deoxycholic acid-induced apoptosis by modulating mitochondrial transmembrane potential and reactive oxygen species production. Molecular medicine (Cambridge, Mass.) 1998, 4 (3), 165–78. [PMC free article] [PubMed] [Google Scholar]
- 40.Rodrigues CM; Sola S; Sharpe JC; Moura JJ; Steer CJ, Tauroursodeoxycholic acid prevents Bax-induced membrane perturbation and cytochrome C release in isolated mitochondria. Biochemistry 2003, 42 (10), 3070–80. [DOI] [PubMed] [Google Scholar]
- 41.Rodrigues CM; Fan G; Ma X; Kren BT; Steer CJ, A novel role for ursodeoxycholic acid in inhibiting apoptosis by modulating mitochondrial membrane perturbation. The Journal of clinical investigation 1998, 101 (12), 2790–9. [DOI] [PMC free article] [PubMed] [Google Scholar]
- 42.Govindaraju V; Young K; Maudsley AA, Proton NMR chemical shifts and coupling constants for brain metabolites. NMR in biomedicine 2000, 13 (3), 129–53. [DOI] [PubMed] [Google Scholar]
- 43.Wyss M; Kaddurah-Daouk R, Creatine and Creatinine Metabolism. Physiological reviews 2000, 80 (3), 1107–1213. [DOI] [PubMed] [Google Scholar]
- 44.Krebs HA, CHAPTER 4 - The Tricarboxylic Acid Cycle A2 - GREENBERG, DAVID M In Chemical Pathways of Metabolism, Academic Press: 1954; pp 109–171. [Google Scholar]
- 45.Hattori N; Tanaka M; Ozawa T; Mizuno Y, Immunohistochemical studies on complexes I, II, III, and IV of mitochondria in Parkinson’s disease. Annals of neurology 1991, 30 (4), 563–71. [DOI] [PubMed] [Google Scholar]
- 46.Schapira AH; Cooper JM; Dexter D; Clark JB; Jenner P; Marsden CD, Mitochondrial complex I deficiency in Parkinson’s disease. Journal of neurochemistry 1990, 54 (3), 823–7. [DOI] [PubMed] [Google Scholar]
- 47.Gibson GE; Kingsbury AE; Xu H; Lindsay JG; Daniel S; Foster OJF; Lees AJ; Blass JP, Deficits in a tricarboxylic acid cycle enzyme in brains from patients with Parkinson’s disease. Neurochemistry International 2003, 43 (2), 129–135. [DOI] [PubMed] [Google Scholar]
- 48.Kim K-Y; Stevens MV; Akter MH; Rusk SE; Huang RJ; Cohen A; Noguchi A; Springer D; Bocharov AV; Eggerman TL; Suen D-F; Youle RJ; Amar M; Remaley AT; Sack MN, Parkin is a lipid-responsive regulator of fat uptake in mice and mutant human cells. The Journal of clinical investigation 2011, 121 (9), 3701–3712. [DOI] [PMC free article] [PubMed] [Google Scholar]
- 49.Ross BM; Moszczynska A; Erlich J; Kish SJ, Low activity of key phospholipid catabolic and anabolic enzymes in human substantia nigra: possible implications for Parkinson’s disease. Neuroscience 1998, 83 (3), 791–8. [DOI] [PubMed] [Google Scholar]
- 50.Magalhaes J; Gegg ME; Migdalska-Richards A; Doherty MK; Whitfield PD; Schapira AH, Autophagic lysosome reformation dysfunction in glucocerebrosidase deficient cells: relevance to Parkinson disease. Human molecular genetics 2016, 25 (16), 3432–3445. [DOI] [PMC free article] [PubMed] [Google Scholar]
- 51.Bosco DA; Fowler DM; Zhang Q; Nieva J; Powers ET; Wentworth P Jr.; Lerner RA; Kelly JW, Elevated levels of oxidized cholesterol metabolites in Lewy body disease brains accelerate alpha-synuclein fibrilization. Nature chemical biology 2006, 2 (5), 249–53. [DOI] [PubMed] [Google Scholar]
- 52.Sharon R; Bar-Joseph I; Mirick GE; Serhan CN; Selkoe DJ, Altered fatty acid composition of dopaminergic neurons expressing alpha-synuclein and human brains with alpha-synucleinopathies. The Journal of biological chemistry 2003, 278 (50), 49874–81. [DOI] [PubMed] [Google Scholar]
- 53.Galvagnion C, The Role of Lipids Interacting with alpha-Synuclein in the Pathogenesis of Parkinson’s Disease. Journal of Parkinson’s disease 2017, 7 (3), 433–450. [DOI] [PubMed] [Google Scholar]
- 54.Sawilowsky SS, New Effect Size Rules of Thumb. Journal of Modern Applied Statistical Methods 2009, 8 (2), 597–599. [Google Scholar]
Associated Data
This section collects any data citations, data availability statements, or supplementary materials included in this article.