

Abstract
Purpose.
To understand how focused versus general practice facilitation can impact goal setting, action planning, and team performance in primary care transformation.
Background.
Practice transformation in primary care is a crucial part of health reform, but can fatigue teams, leading to variable results. Practice facilitation may reduce primary care fatigue to help teams reach challenging transformation goals, but may require a more focused approach than previous studies suggest.
Methods.
We performed a 12-month cluster randomized trial, during which eight primary care clinics received practice facilitation. Four practices in the intervention arm received targeted facilitation to focus quality improvement goals on high-value elements (HVEs) intended to reduce cost and utilization, while four control practices received generalized quality improvement facilitation. We investigated the impact of the targeted versus generalized approach on goal selection, action item selection and achievement, HVE attainment and collaborative practice, using quantitative and qualitative methods.
Results.
Intervention clinics selected an average of 7 goals and 29 action items, compared to 8 goals and 40 action items among controls. 83% of intervention goals were related to HVEs, compared to 27% of goals among controls. Intervention clinics selected 101 HVE goals and met 68%, while controls selected 41 and met 61%. Analysis of pre-post practice surveys indicated greater improvement among intervention across four of eight domains of collaborative practice.
Conclusion.
Targeted facilitation may be more effective than a generalized approach to support practices in reaching high-value change goals, as well as fostering improvement of team focus on goals, roles and responsibilities.
INTRODUCTION
Primary care practice transformation is a cornerstone in health care reform due to its broad population reach and longitudinal focus on patient needs; however, selecting quality improvement (QI) goals and developing QI infrastructure to best achieve improved population health, better patient experience of care, and improved efficiency can be challenging and fatiguing for primary care practices.1–4 As more practices work to transform into patient-centered medical homes and prepare for alternative payment models (APMs), it is crucial to understand how practice facilitation occurs and what aspects of facilitation could be effective in achieving focused practice changes to improve patient outcomes. This study aims to assess the impact of general versus targeted practice facilitation on a group of Oregon primary care practices’ QI by reporting intermediate measures of goal selection, team participation in goal and action item selection, action item achievement, and time to achieve goals.
Previous studies have demonstrated that practice facilitation guidance has been used to successfully assist with transformation efforts and system-level change.5,6 Practice facilitation provides strategies and frameworks to increase awareness of needed change, identify leadership and improve team function, emphasize local context, and monitor transformation progress.7,8 In brief, the practice facilitator (PF) interacts directly with practices to find a way forward towards transformation goals and to support tailored implementation of evidence-based interventions or guideline recommendations. A randomized controlled trial of 23 primary care practices demonstrated that practices with a PF compared to those without were more likely to define improvement objectives, successfully complete projects9 and avoid change fatigue.10 Recent efforts to understand how PFs are effective draw from organizational learning theory and build on the learning-performance link for adult learners.11
PFs commonly support practices with general QI strategies to improve prevention services, practice efficiency, or disease-specific outcomes.12 Within these generalized QI interventions, the PF provides a structure for QI processes, and practices work collaboratively with the PF to identify and select activities appropriate for improvements. Results of generalized QI with a PF are mixed: some studies have shown increases in prevention services like mammography;13 implementation of evidence-based guidelines for treatment of asthma,14 and outreach to promote health screening services,15,16 while others have shown no effect.14,15,17 Limited work has explored whether practice facilitation improves broader health reform goals, such as reduction in health care utilization and cost for patients with complex needs; Nutting showed that while practices had more change energy with practice facilitation, facilitation did not affect cost and utilization outcomes. Some studies have tested methods of practice facilitation to understand what aspects are most effective.18–20 Targeted or focused practice facilitation where the PF introduces a set of key improvements through a change package and promotes pre-defined QI activities likely to achieve key driver goals might be particularly effective in assisting practices to achieve cost and utilization outcomes. Parchman et al. demonstrated that targeted practice facilitation resulted in significant and sustained improvements, while implementing the Chronic Care Model on goals derived from the model.21 With increasing movement toward APMs, testing practice facilitation under incentive models is a question for study as it is unknown whether incentives reduce practice willingness to engage across improvement not directly tied to payments.
We hypothesized that use of a pre-defined menu of goals in conjunction with monthly practice facilitation would result in greater progress toward achieving QI goals. We further hypothesized that clinics receiving targeted facilitation would be more likely than the clinics receiving the general approach to improve team function without losing their ‘change energy’ or adaptive reserve.22 Our study setting is the Transforming Outcomes for Patients through Medical home Evaluation and reDesign (TOPMED) trial23 and this is a focused presentation on the PF’s impact on goals and action planning.
METHODS
TOPMED was funded by the Gordon and Betty Moore Foundation from 2011 to 2015 to understand how practice facilitation, performance incentives, and information technology (IT) support could be better utilized as practice transformation tools to reduce avoidable health care costs and service utilization in primary care. The complete TOPMED protocol23 and preliminary results on patient satisfaction24 are published elsewhere. In brief, eight primary practices in Oregon participated in this year-long, two-arm, pragmatic cluster randomized trial and received general or targeted practice facilitation, IT-based milestone reporting, and financial incentives based on achievement of QI goals.
Participating practices were recruited from member and affiliated practices of the Oregon Rural Practice-based Research Network (ORPRN).25 The study team recruited physician champions and practice leadership via phone and e-mail and eligible practices were engaged in health reform, had achieved Oregon’s Patient-Centered Primary Care Home (PCPCH) standards at level 3 (out of 3), were willing to receive practice facilitation, and were willing to use a population registry management HIT tool, the Integrated Care Coordination System (ICCIS).26 A single, masters-level PF trained in quality improvement methodology and practice transformation supported all eight participating practices, and practices had variable experience both with QI and in working with an external PF. The study PI (DD), ORPRN Director (LJF), and PF traveled to practices to finalize participation details and to complete the study memorandum of understanding. Enrolled practices were matched based on size, location, ownership, and proportion of high-risk patients, followed by matched randomization using computer algorithms completed simultaneously.
Study protocol and data collection
The study protocol is described below, including data collection and monitoring steps. The Oregon Health & Science University (OHSU) Institutional Review Board reviewed and monitored the study. Data sources for this study include field notes and goal tracking documentation from practice facilitation, and practice surveys assessing team development and collaborative practice.
Practice Facilitation and Goal Tracking
Targeted practice facilitation was provided to the four intervention practices that focused on the achievement of selected benchmarks associated with improved cost and utilization in within the medical home model. These benchmarks, or “high value elements” (HVEs), were a subset of PCPCH criteria determined from a literature review and structured expert input to have greatest likelihood to reduce cost and utilization.27 Each intervention practice received encouragement to specifically work towards the HVE change package. The four control practices received general QI guidance from the PF. All participating practices received an equal payment across the study for the trial period; however, a portion of the intervention practice’s payment was reserved for meeting HVEs to mimic payments for meeting quality and utilization metrics in some APMs.
Prior to study initiation, the PF met with each practice QI implementation team to establish the TOPMED QI structure and to document practice features relevant to a transformation environment. In April 2013, practice QI implementation teams from all eight practices attended an in-person training session to receive study details, results of baseline staff surveys, and an orientation to the IT tools. Starting in May 2013, the PF held a minimum of 12 one-hour team meetings with each clinic over the course of the project, and conducted a meeting at project conclusion to evaluate the final set of goals and plan for sustainability. During monthly PF visits, practice QI implementation teams reviewed a customized dashboard displaying practice data coupled with PF-led consensus building to select goals and create small tests of change to accomplish goals. Monthly meetings were audio recorded to assist in documentation of activities. The purpose of the PF was to encourage and record goal-setting and actions related to goals in addition to documenting achievement of HVEs and communicating with practices about study progress.
The PF created semi-structured field notes capturing progress toward goals and meeting details, including team participation and goal selection, description of goals and action items for the upcoming month, and communications with implementation team members during and between monthly meetings. The project team defined “goals” as the long-term, overarching objectives that practices worked on for at least one month, while “action items” are monthly task assignments to individuals or team members generally expected to be completed by the next PF meeting. The PF compiled a database summarizing details of monthly visits that included QI goal drivers, contextual information, plans for the current month, progress toward goals, and action item outcomes from the previous month. During the 12 months of facilitation, an OHSU evaluation team with expertise in primary care, practice facilitation, and data-driven QI reviewed field notes and worksheets, and met with the PF monthly to evaluate progress and make joint recommendations for activities in subsequent months.
Achievement of HVEs
There are a total of 12 HVEs with one to three achievement levels each, yielding 26 total measures (see Table 3). For example, the first level of the care plan utilization HVE requires practices to report data on high-risk patients, while levels 2 and 3 require practices to provide care plans for more than 25% of high-risk patients and 50% of high-risk patients, respectively. For our analysis, HVE achievement is measured by progress toward all 26 total measures and is summed for up to 26 HVEs achieved cumulative for allocation arm, or 104 points per arm.
Table 3:
High Value Element (HVE) Descriptions and Clinic Selection of HVEs
| HVE | # clinics selected | Level 1 | Level 2 | Level 3 | |
|---|---|---|---|---|---|
| % improvement pre/post* | |||||
| I | C | ||||
| After Hours Access | 0 | 0 | Offers access to in-person care at least 12 hours weekly outside traditional business hours. | ||
| 0% | +25% | ||||
| Tracking 3rd Next Available Appointments | 3 | 1 | Tracks 3rd next available appointments. | Meets a benchmark on 3rd next available appointments. | |
| +25% | +13% | ||||
| Tracking/responding to electronic requests | 1 | 0 | Able to receive and respond to electronic requests. | Able to track electronic request response times. | Provides a response to online or electronic queries within two business days. |
| +17% | +17% | ||||
| Reminders | 4 | 0 | Uses patient information, clinical data, and evidence-based guidelines to generate lists of patients who need reminders and to proactively remind patients/families/caregivers and clinicians of needed services. | Tracks the number of eligible patients who were sent appropriate reminders. | Sends appropriate reminders to at least 20% of all eligible patients. |
| +75% | +50% | ||||
| Clinical Information Exchange | 0 | 0 | Exchanges structured clinical information and tracks critical elements (e.g., hospitalizations). | ||
| +50% | 0% | ||||
| Utilization Follow-up | 4 | 2 | Follows up on patient hospitalizations and ED visits 30% of the time (when they have the information). | Follows up on patient hospitalizations or ED visits 70% of the time (when they have the information). | Follows up on patient hospitalizations and ED visits 70% of the time (when they have the information). |
| +58% | +8% | ||||
| Utilization Prevention | 2 | 1 | Selects and reviews utilization measures and goals most relevant to their overall patient panel, or an at-risk patient population. | Shows improvement or meets a benchmark in utilization metrics on measures closely linked to utilization. | |
| +13% | +13% | ||||
| Performance Data Utilization | 2 | 1 | Uses performance data to identify opportunities for improvement and acts to improve clinical quality, efficiency and patient experience. | ||
| +25% | 0% | ||||
| Care Coordination Outreach | 0 | 1 | Care coordination outreach reaches 25% of high risk patients. | Care coordination outreach reaches 50% of high risk patients. | |
| +12% | +25% | ||||
| Care Plan Utilization | 3 | 1 | Reports data on care plans provided to high risk patients. | Provides care plans to > 25% of high risk patients. | Provides care plans to >50% of high risk patients. |
| +50% | 0% | ||||
| Advance Directive Utilization | 3 | 1 | Tracks offers of advance directives to patients over 65. | Offers advance directives to at least 30% of patients over 65. | Offers advance directives to at least 50% of patients over 65. |
| +42% | +8% | ||||
| Education and Self-management Resources | 2 | 0 | More than 10% of all unique patients are provided patient-specific education resources. | More than 10% of all unique patients are provided patient-specific education resources and self-management services. | |
| +25% | +25% | ||||
Improvement indicates average change in levels passed from baseline to quarter 4 of HVE reporting
All practices were measured monthly on their achievements in HVEs using a PCPCH Attestation Tool module in ICCIS with both the standard PCPCH measures and HVEs. Measurement consisted of two phases; first, electronic health record (EHR) data was drawn into the tool and measured for each quantitative element. Second, the PF met with practice staff for 1–2 hours to explain additional elements and assist staff with assessing and calculating measures. Practices also reviewed the quantitative measurements and were allowed to provide more specific evidence to adjust these calculations. Both arms used the HIT tool ICCIS, which was designed for care management tracking and measured clinical data to report progress toward HVEs.
Incentives and Feedback
Incentives were set specifically on goal selection and attainment. Specifically, control clinics received a percentage score based on the amount of effort they put into goal selection and attainment, and this score was averaged and translated into the quarterly payment of up to $10,000. The intervention clinics were given a score based on goal selection; this score was augmented by the proportion of HVEs attained. This score was also translated into a monthly payment which had to average $10,000 over 4 quarters, but could provide up to a 10% ‘bonus’ for high achievement. Incentives at this level are only large enough to cover staff time and data collection costs.
Clinician and Staff Surveys: Team Development and Adaptive Reserve
We used questionnaires to understand the impact of practice facilitation on team function, adaptive reserve (or ability to continue transformation efforts), and collaboration; practice facilitation has been shown to enhance these aspects in transformation, but focused PF may worsen effects by being too directive. At baseline and post intervention, clinicians and staff members completed three surveys: the Team Development Measure (TDM), the Clinician and Staff Questionnaire (CSQ), and the Collaborative Practice Assessment Tool (CPAT). The TDM measures a clinic’s ability to function as a team, including cohesiveness, communication, and role and goal clarity.28–29 The questionnaire contains 31-items with four-point ordinal ratings (Strongly Disagree to Strongly Agree) and demonstrates good reliability. The scores are summed and converted to a 0–100 score, with higher scores representing more team development components firmly in place.29 The CSQ is a validated assessment that measures attributes important for understanding practices in the process of change.12,17 It contains 38 questions with five-point ordinal ratings (Strongly Disagree to Strongly Agree) across five domains: 1) adaptive reserve (ability to make and sustain change); 2) community knowledge; 3) health information technology integration; 4) cultural sensitivity; and 5) patient safety culture. The CPAT is a validated tool used in healthcare settings to measure the degree to which team members perceive that they collaborate effectively.30 It includes 56 items with a seven-point ordinal rating (Strongly Disagree to Strongly Agree) across eight domains: 1) mission, meaningful purpose, goals; 2) general relationships; 3) team leadership; 4) general role responsibilities, autonomy; 5) communication and information exchange, 6) community linkages and coordination of care; 7) decision-making and conflict management, and 8) patient involvement.
Analysis
Qualitative
After the intervention, two qualitative research personnel reviewed the PF’s field notes. Using the recorded text of the item, each action item was assigned to a general QI goal or HVE. Specifically, if the description matched the HVE explicitly, it was assigned the HVE designation; all others were designated as a general goal. From the field notes, the clinic staff member who selected the goal was noted, and action items were tracked month to month for completion. Coded action items were tabulated for each HVE or QI goal and month in which they occurred. These results were charted to understand each practice’s progress toward achieving goals and to compare intervention and control practices.
Quantitative
Descriptive statistics were calculated on numbers of goals set and goals achieved, numbers of action steps set, HVE achievement, and on each individual clinician and staff survey scale. HVE achievement was calculated as number of 26 achieved at baseline, at each quarter, and end of study. We performed difference-in-difference analyses to compare pre- and post-trial goals, action plans, HVE achievement, and survey results between intervention and control clinics.
Multivariable models adjusted standard errors for clustering at the clinic level using the SAS Surveyreg procedure, which can handle complex survey sample designs, including designs with stratification, clustering, and unequal weighting. The procedure fits linear models for survey data and computes regression coefficients by generalized least squares estimations and their variance-covariance matrix. Surveyreg computes the regression coefficient estimators by generalized least squares estimation and computes variances of the regression parameters using Taylor series linearization. For each of the survey composite scores, we fit a probability model with the computed survey score as the unit of analysis. We assessed differences in change from pre- to post-trial between intervention and control clinics using the following regression model: survey outcome = clinic + intervention group + time + intervention*time. A statistically significant interaction term (p < 0.05) indicates difference in difference between intervention and control clinics.
RESULTS
A total of eight practices participated in the study, were randomized, and received 12 months of practice facilitation from May 2013 to April 2014. Table 1 displays the descriptive statistics by clinic in their paired randomization group. The clinics ranges in size from 7,257 to 14,119 empaneled patients, with between 4 and 13 provider FTE per clinic. The clinics were predominantly fee-for-service, with < 20% of payments from other forms, such as capitation or quality / care management fees. Insurance status of the patients was mixed, with Medicare ranging from 16–34%, Medicaid from 5–42%, and the rest commercially insured. For the patient panels, range of average ages was 39.7–52.5, with between 1.3–5.6% of patients above 85. Gender of patients in the clinics ranges from 56.8%−64.4% female. HCC scores in the clinic ranged from .87 to 1.09. To accommodate differences between clinics, a stratified matching approach was used for intervention assignment and for patient level analyses.
Table 1.
Practice characteristics of Intervention and Control Clinics
| Arm | Organization | Location | Patient panel | High risk patients (%) | MD, DO | PA, NP |
|---|---|---|---|---|---|---|
| Intervention | Single Clinic | Urban/Suburban | 11,603 | 18 | 4 | 0 |
| Control | Multiclinic group | Urban | 14,119 | 8 | 7 | 1 |
| Intervention | Community-based Academic Medical Center | Urban | 13,125 | 16 | 10 | 2 |
| Control | Academic Medical Center | Urban | 13,040 | 21 | 12 | 1 |
| Intervention | Small Health System | Rural | 7,257 | 8 | 3 | 1 |
| Control | Small Health System | Rural | 10,282 | 9 | 5 | 3 |
| Intervention | Small Health System | Rural | 13,321 | 3.2 | 7 | 0 |
| Control | Small Health System | Rural | 1,200 | 30 | 1 | 3 |
Goal Selection and Action Items
Goals were selected monthly. Examination of both general QI goals and HVE goals showed nearly an equal number set across both arms (7.3 goals for intervention and 7.5 for control), as shown in Table 2. Each practice in the intervention and control arms selected goals related to HVEs, and intervention practices selected a higher percentage of HVE goals (82.8%) than control (26.7%). Intervention practices worked on HVE goals for an average of 2.7 months and on other goals an average of 2.2 months. Control practices worked on HVE goals an average of 2.4 months and other QI goals an average of 2.1 months. Overall intervention practices selected a total of 101 HVE goals and met 68% while control practices selected 41 HVE goals and met 61%. Control practices set more individual action items (mean = 40) to achieve goals than intervention practices (mean = 28.75). Clinician implementation team participants within intervention practices led selection of 30% of action items compared to 20% in the control arm.
Table 2:
Goals and Action Items
| Goal selection and progress | Intervention | Control |
|---|---|---|
| Average # of Goals selected per clinic (range) | 7.3 (7–8) | 7.5 (6–10) |
| % goals that were HVEs | 82.8 | 26.7 |
| Average months worked on individual HVE goal | 2.7 | 2.4 |
| Average months worked on other goal | 2.2 | 2.1 |
| Action Items | Intervention | Control |
| Total action items | 115 | 160 |
| % Complete | 65.2 | 65.6 |
| Total action items for HVE goals | 101 | 41 |
| % Complete | 68.3 | 61.0 |
| Total action items for other goals | 6 | 80 |
| % Complete | 42.9 | 67.2 |
| % Total Acton Items Chosen by Provider | 29.6 | 20.0 |
| % Total Action Items Chosen by PF | 14.8 | 19.4 |
| %Total Action Items Chosen by “Other” | 55.6 | 60.6 |
Achievement of HVE Goals
Table 3 shows selection and progress toward achieving 12 HVE topics. Intervention practices selected goals related to nine HVE topics. None of the intervention practices selected goals related to after hours access, clinical information exchange or care coordination outreach. Though HVEs were not specifically introduced to control practices, they independently selected goals related to seven HVEs: tracking third next available appointment, utilization follow-up, utilization prevention, performance data utilization, care coordination outreach, care plan utilization, and advance directive utilization.
Intervention practices showed a marked increase in achieving HVE elements at project end. At baseline, intervention practices had a cumulative score of 38 HVE elements achieved compared to control practices at 27 HVE elements. At quarter 4, intervention practices doubled to 76 HVE elements achieved (average 19 per practice, or 73% of maximum) while baseline practices increased to 44 HVE elements (11 per practice or 42% of maximum).
Survey Results
Clinician and staff survey results were mixed. Response rate for the TDM, measuring team function and cohesiveness, was 80.4% pre-trial (N=137) and 43.5% post-trial (N=83). Scores increased for the intervention relative to the control clinics (+2.38/100 difference-in-difference), but this was not statistically significant (p = .312). CSQ response rates were 92.3% pre-trial (N=210) and 60.4% post-trial (N=104). Intervention and control clinics performed similarly on four out of five domains, while control clinics demonstrated statistically significant (p=.030) improvement in community knowledge, compared to the intervention clinics (+.38/5.0 difference-in-difference). Response rates for the CPAT were 71.3% pre-trial (N=119) and 44.0% post-trial (N=101). The intervention clinics performed significantly better relative to controls (p < .05) on four of the eight domains, including Mission, Meaningful Purpose, Goals (+.61/7.0 difference-in-difference); Team Leadership (+.85/7.0 difference-in-difference); General Role, Responsibility, Autonomy (+.63/7.0 difference-in-difference); and Communication and Information Exchange, and Coordination of Care (+.58/7.0 difference-in-difference).
DISCUSSION
TOPMED compared the ability of targeted practice facilitation coupled with a change package to that of generalized quality improvement in driving clinics towards more effective components of practice transformation. Practices in the intervention arm selected HVE goals consistently over the 12 months of the project, continued to progress across nine of the 12 HVE topics, and sought to reach increasingly challenging clinical benchmark tiers within each HVE. From baseline to quarter 4, intervention practices doubled their achievement of measurable HVE elements from 38 to 76 (out of 104). Control practices progressed from 27 to 44 over the same time period. Staff survey results on team function and ability were mixed and did not demonstrate a lot of change; however, the intervention arm performed better on two of three surveys.
HVE goals challenge practices to make changes that might reduce cost and utilization. It seemed likely that practices selecting HVEs would require more time to achieve the goals and would accomplish fewer goals overall because of their difficulty. Notably, intervention and control practices achieved nearly the same number of goals over the course of the project. Our review of action items showed clinician members of implementation teams were more involved in selecting improvement goals when chosen from the HVE menu set. Practices were able to achieve HVEs with fewer action items. This could be because the PF was able to efficiently guide implementation teams to focus on the most effective actions to undertake for HVEs, or it could reflect the complex or non-linear nature of selected non-HVE goals. Field notes show the PF actively spread success ideas from one practice to another in HVE work. This combination of rapid and efficient goal progression, clinician involvement and achievement of increasingly challenging benchmarks supports the effectiveness of a high-value menu set in conjunction with targeted practice facilitation in reaching goals most likely to impact practice improvement.
As the field of practice facilitation grows, there is a need to identify and document those strategies that best enable practices to achieve and maintain transformation. To understand correlations between improvement activities and external factors like practice facilitation requires in-depth analysis. Other studies demonstrate the effectiveness of continuous quality improvement compared to a reflective adaptive process18 and the use of practice-tailored facilitation. In TOPMED, we found that use of a targeted HVE change package across 12 non condition-specific practice improvement elements enabled practices to set and achieve valued improvement goals. Coding goals and action items allowed the research team to measure progress across the diverse practice improvement elements that were selected, and may be useful for similar projects.
The study has several limitations. The pragmatic design of the trial makes it more difficult to determine trial effectiveness. Many of the practices were contemporaneously involved with other QI initiatives and programs. The small sample size and recruitment approach made it difficult to match practice pairs, and the intervention arm had already achieved more HVEs at baseline compared to control. The practices themselves also underwent changes that may have diverted them from TOPMED efforts, including transitions in ownership and changes to EHRs. The duration of the practice facilitation was limited to 12-months and studies of practice change show that transformation is uneven, unstable and takes time31. It is challenging to understand the impact financial incentives had on practice engagement. However, as the goals for QI changes are the outcome of interest, we were able to demonstrate whether these more challenging goals could be met. Finally, the post-trial survey had a low response rate from a different distribution of respondents, making it difficult to compare to the baseline surveys.
CONCLUSION
As predicted, intervention clinics worked on and completed more HVEs than control clinics regardless of the difficult nature of HVEs. Targeted practice facilitation was effective in assisting practices to achieve HVEs, and intervention and control practices achieved the same number of goals. Intervention practices were more efficient in action item selection. Targeted facilitation improved care team function and collaboration. Overall, the TOPMED trial supports the effectiveness of combining a menu set with targeted practice facilitation in reaching HVE goals. Because HVEs have demonstrated capacity to improve the Triple Aim, working on them may improve patient care and reduce cost and utilization.
Figure 1.
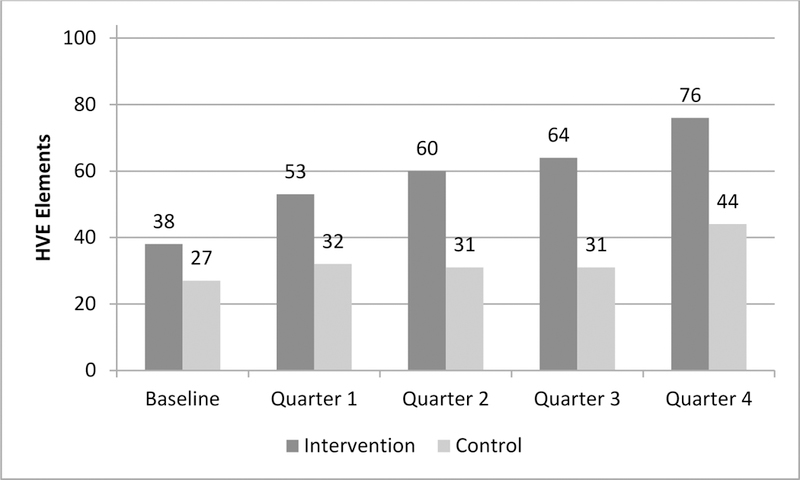
Summed HVE Selection and Achievement by arm
Table 4.
Clinician and staff survey results before and after TOPMED trial
| Survey/Scale | N | Intervention | Control | Difference-in-difference (Intervention - Control) | p± | ||||||||
|---|---|---|---|---|---|---|---|---|---|---|---|---|---|
| Pre | Post | Difference | Pre | Post | Difference | ||||||||
| TDM Pre: N = 137; Post: N = 83 |
Mean | (95% CI) | Mean | (95% CI) | Mean | (95% CI) | Mean | (95% CI) | |||||
| Score | 220 | 59.1 | (57.3–60.8) | 62.0 | (59.4–64.6) | 2.96 | 59.9 | (56.9–62.8) | 60.4 | (58.3–62.6) | 0.59 | 2.38 | 0.312 |
|
CSQ Pre: N = 210; Post: N = 104 |
N | Mean | (95% CI) | Mean | (95% CI) | Difference | Mean | (95% CI) | Mean | (95% CI) | Difference | Diff-in-diff | p |
| Adaptive Reserve | 276 | 3.8 | (3.7–3.9) | 3.8 | (3.6–3.9) | −0.01 | 3.7 | (3.5–3.8) | 3.9 | (3.7–4.1) | 0.21 | −0.21 | 0.139 |
| Community Knowledge | 285 | 3.8 | (3.7–3.9) | 3.7 | (3.6–3.9) | −0.04 | 3.7 | (3.5–3.8) | 4.0 | (3.8–4.3) | 0.35 | −0.38* | 0.030 |
| Health Information Technology Integration | 309 | 3.8 | (3.7–3.9) | 3.9 | (3.8–4.0) | 0.10 | 3.8 | (3.7–3.9) | 3.6 | (3.4–3.8) | −0.15 | 0.25 | 0.080 |
| Cultural Sensitivity | 313 | 4.1 | (3.9–4.2) | 4.0 | (3.9–4.2) | −0.02 | 4.1 | (3.9–4.2) | 4.2 | (4.0–4.4) | 0.11 | −0.13 | 0.473 |
| Patient Safety Culture | 312 | 3.5 | (3.4–3.6) | 3.7 | (3.5–3.8) | 0.16 | 3.4 | (3.2–3.6) | 3.8 | (3.6–4.1) | 0.42 | −0.26 | 0.139 |
|
CPAT Pre: 119; Post: 101 |
N | Mean | (95% CI) | Mean | (95% CI) | Difference | Mean | (95% CI) | Mean | (95% CI) | Difference | Diff-in-diff | p |
| Mission, Meaningful Purpose, Goals | 213 | 5.6 | (5.2–5.9) | 6.0 | (5.8–6.3) | 0.45 | 6.1 | (5.9–6.3) | 5.9 | (5.7–6.2) | −0.16 | 0.61* | .013 |
| General Relationships | 215 | 6.0 | (5.6–6.3) | 6.1 | (5.9–6.3) | 0.09 | 6.4 | (6.3–6.5) | 6.2 | (6.0–6.4) | −0.26 | 0.35 | 0.127 |
| Team Leadership | 206 | 5.0 | (4.6–5.3) | 5.7 | (5.5–6.0) | 0.76 | 5.7 | (5.6–5.9) | 5.7 | (5.5–5.9) | −0.08 | 0.85* | < .001 |
| General Role, Responsibility, Autonomy | 204 | 5.0 | (4.7–5.3) | 5.4 | (5.2–5.6) | 0.42 | 5.5 | (5.4–5.7) | 5.3 | (5.1–5.5) | −0.21 | 0.63* | .002 |
| Communication and Information Exchange | 215 | 5.2 | (4.8–5.6) | 5.7 | (5.5–6.0) | 0.52 | 5.8 | (5.6–6.0) | 5.8 | (5.5–6.0) | −0.06 | 0.58* | 0.036 |
| Community Linkages and Coordination of Care | 217 | 4.7 | (4.4–5.1) | 5.4 | (5.1–5.7) | 0.72 | 5.3 | (5.0–5.5) | 5.4 | (5.1–5.7) | 0.15 | 0.57 | 0.057 |
| Decision-making and Conflict Management | 209 | 4.5 | (4.3–4.7) | 4.3 | (4.2–4.5) | −0.21 | 4.3 | (4.2–4.4) | 4.3 | (4.2–4.5) | 0.02 | −0.23 | 0.153 |
| Patient Involvement | 211 | 5.7 | (5.3–6.2) | 6.1 | (5.8–6.3) | 0.33 | 6.2 | (6.0–6.4) | 6.0 | (5.8–6.2) | −0.16 | 0.49 | 0.092 |
p<.05
P value associated with interaction term in multivariable model: posttest = clinic + intervention group + time + intervention group*time.
ACKNOWLEDGMENTS:
The authors would like to extend special acknowledgment to Beth Sommers, Melinda Davis and Sonya Howk for their contributions to this study.
FUNDING STATEMENT: Gordon and Betty Moore Foundation Grant ID: GBMF2908; AHRQ R18 HS17832 (Enhancing Complex Care Coordination Information Systems)
Footnotes
CONFLICTING AND COMPETING INTERESTS: The authors have nothing to disclose.
References
- 1.Nutting PA, Crabtree BF, Miller WL, Stange KC, Stewart E, Jaén C. Transforming physician practices to patient-centered medical homes: lessons from the national demonstration project. Health Aff. (Millwood). 2011;30(3):439–445. [DOI] [PMC free article] [PubMed] [Google Scholar]
- 2.McNellis RJ, Genevro JL, Meyers DS. Lessons learned from the study of primary care transformation. Ann Fam Med. 2013;11(Suppl 1):S1–S5. [DOI] [PMC free article] [PubMed] [Google Scholar]
- 3.Geonnotti K, Taylor EF, Peikes D, et al. Engaging Primary Care Practices in Quality Improvement: Strategies for Practice Facilitators (White Paper). Princeton, NJ: Mathematica Policy Research;2015. [Google Scholar]
- 4.Willard-Grace R, Hessler D, Rogers E, Dubé K, Bodenheimer T, Grumbach K. Team structure and culture are associated with lower burnout in primary care. J Am Board Fam Med. 2014;27(2):229–238. [DOI] [PubMed] [Google Scholar]
- 5.Nagykaldi Z, Mold JW, Aspy CB . Practice facilitators: a review of the literature. Fam Med. 2005;37(8):581. [PubMed] [Google Scholar]
- 6.Sugarman JR, Phillips KE, Wagner EH, Coleman K, Abrams MK. The safety net medical home initiative: transforming care for vulnerable populations. Med Care. 2014;52(11 Suppl 4):S1–10. [DOI] [PubMed] [Google Scholar]
- 7.Dogherty EJ, Harrison MB, Graham ID. Facilitation as a role and process in achieving evidence-based practice in nursing: a focused review of concept and meaning. Worldviews Evid Based Nurs. 2010;7(2):76–89. [DOI] [PubMed] [Google Scholar]
- 8.Nagykaldi Z, Mold JW, Robinson A, Niebauer L, Ford A. Practice facilitators and practice-based research networks. J Am Board Fam Med. 2006;19(5):506–510. [DOI] [PubMed] [Google Scholar]
- 9.Engels Y, van den Hombergh P, Mokkink H, van den Hoogen H, van den Bosch W, Grol R. The effects of a team-based continuous quality improvement intervention on the management of primary care: a randomised controlled trial. Br. J. Gen. Pract. 2006;56(531):781–787. [PMC free article] [PubMed] [Google Scholar]
- 10.Nutting PA, Crabtree BF, Miller WL, Stewart EE, Stange KC, Jaén CR. Journey to the patient-centered medical home: a qualitative analysis of the experiences of practices in the National Demonstration Project. Ann Fam Med. 2010;8(Suppl 1):S45–S56. [DOI] [PMC free article] [PubMed] [Google Scholar]
- 11.Whitney B, Cranley L, Dearing JW, Dogherty EJ, Squires JE, Estabrooks CA. Why (we think) facilitation works: insights from organizational learning theory. Implement Sci. 2015;10. [DOI] [PMC free article] [PubMed] [Google Scholar]
- 12.Baskerville NB, Liddy C, Hogg W. Systematic review and meta-analysis of practice facilitation within primary care settings. Ann Fam Med. 2012;10(1):63–74. [DOI] [PMC free article] [PubMed] [Google Scholar]
- 13.Aspy CB, Enright M, Halstead L, Mold JW. Improving mammography screening using best practices and practice enhancement assistants: an Oklahoma Physicians Resource/Research Network (OKPRN) study. J Am Board Fam Med. 2008;21(4):326–333. [DOI] [PubMed] [Google Scholar]
- 14.Mold JW, Fox C, Wisniewski A, et al. Implementing asthma guidelines using practice facilitation and local learning collaboratives: a randomized controlled trial. Ann Fam Med. 2014;12(3):233–240. [DOI] [PMC free article] [PubMed] [Google Scholar]
- 15.Hogg W, Lemelin J, Graham I, et al. Improving prevention in primary care: evaluating the effectiveness of outreach facilitation. Fam Pract. 2008;25(1):40–48. [DOI] [PubMed] [Google Scholar]
- 16.Margolis PA, Lannon CM, Stuart JM, Fried BJ, Keyes-Elstein L, Moore DE. Practice based education to improve delivery systems for prevention in primary care: randomised trial. BMJ. 2004;328(7436):388. [DOI] [PMC free article] [PubMed] [Google Scholar]
- 17.Jaén CR, Ferrer RL, Miller WL, et al. Patient outcomes at 26 months in the patient-centered medical home National Demonstration Project. Ann Fam Med. 2010;8(Suppl 1):S57–S67. [DOI] [PMC free article] [PubMed] [Google Scholar]
- 18.Dickinson WP, Dickinson LM, Nutting PA, et al. Practice facilitation to improve diabetes care in primary care: a report from the EPIC randomized clinical trial. Ann Fam Med. 2014;12(1):8–16. [DOI] [PMC free article] [PubMed] [Google Scholar]
- 19.Meropol SB, Schiltz NK, Sattar A, et al. Practice-tailored facilitation to improve pediatric preventive care delivery: a randomized trial. Pediatrics. 2014;133(6):e1664–e1675. [DOI] [PMC free article] [PubMed] [Google Scholar]
- 20.Lessard S, Bareil C, Lalonde L, et al. External facilitators and interprofessional facilitation teams: a qualitative study of their roles in supporting practice change. Implement Sci. 2016;11(1):1. [DOI] [PMC free article] [PubMed] [Google Scholar]
- 21.Parchman ML, Noel PH, Culler SD, et al. A randomized trial of practice facilitation to improve the delivery of chronic illness care in primary care: initial and sustained effects. Implement Sci. 2013;8(1):1. [DOI] [PMC free article] [PubMed] [Google Scholar]
- 22.Nutting PA, Crabtree BF, Miller WL, Stewart EE, Stange KC, Jaen CR. Journey to the patient-centered medical home: a qualitative analysis of the experiences of practices in the National Demonstration Project. Ann Fam Med. 8 Suppl 1:S45–56; S92; 2010. [DOI] [PMC free article] [PubMed] [Google Scholar]
- 23.Dorr DA, McConnell KJ, Williams MP-J, et al. Study protocol: transforming outcomes for patients through medical home evaluation and redesign: a cluster randomized controlled trial to test high value elements for patient-centered medical homes versus quality improvement. Implement Sci. 2015;10(1):13. [DOI] [PMC free article] [PubMed] [Google Scholar]
- 24.Dorr DA, Anastas T, Ramsey K, et al. Effect of a Pragmatic, Cluster-Randomized Controlled Trial on Patient Experience With Care: The Transforming Outcomes for Patients Through Medical Home Evaluation and reDesign (TOPMED) Study. Med Care. 2016. [DOI] [PMC free article] [PubMed] [Google Scholar]
- 25.Fagnan LJ, Morris C, Shipman SA, Holub J, King A, Angier H. Characterizing a practice-based research network: Oregon Rural Practice-Based Research Network (ORPRN) survey tools. J Am Board Fam Med. 2007;20(2):204–219. [DOI] [PubMed] [Google Scholar]
- 26.Dale JA, Behkami NA, Olsen GS, Dorr DA. A multi-perspective analysis of lessons learned from building an Integrated Care Coordination Information System (ICCIS). AMIA Annu Symp Proc. 2012;2012:129–135. [PMC free article] [PubMed] [Google Scholar]
- 27.Oregon Health Authority. Patient Centered Primary Care Program - Home Page. http://www.oregon.gov/oha/pcpch/Pages/index.aspx. Accessed April 25, 2016.
- 28.Salem-Schatz S, Ordin D, Mittman B. Guide to the team development measure. 2010. http://www.queri.research.va.gov/ciprs/projects/team_development_measure.pdf.
- 29.Stock R, Mahoney E, Carney PA. Measuring team development in clinical care settings. Fam Med. 2013;45(10):691–700. [PubMed] [Google Scholar]
- 30.Schroder C, Medves J, Paterson M, et al. Development and pilot testing of the collaborative practice assessment tool. J Interprof Care. 2011;25(3):189–195. [DOI] [PubMed] [Google Scholar]
- 31.Donahue KE, Newton WP, Lefebvre A, Plescia M. Natural history of practice transformation: development and initial testing of an outcomes-based model. Ann Fam Med. 2013;11(3):212–219. [DOI] [PMC free article] [PubMed] [Google Scholar]