Abstract
We hypothesize that our smartphone-based arrhythmia discrimination algorithm with data acquisition approach reliably differentiates between normal sinus rhythm (NSR), atrial fibrillation (AF), premature ventricular contractions (PVCs) and premature atrial contraction (PACs) in a diverse group of patients having these common arrhythmias. We combine Root Mean Square of Successive RR Differences (RMSSD) and Shannon Entropy (ShE) with Poincare plot (or turning point ratio (TPR) method) and pulse rise and fall times to increase the sensitivity of AF discrimination and add new capabilities of PVC and PAC identification. To investigate the capability of the smartphone-based algorithm for arrhythmia discrimination, 99 subjects, including 88 study participants with AF at baseline and in NSR after electrical cardioversion, as well as 7 participants with PACs and 4 with PVCs were recruited. Using a smartphone, we collected 2-minute pulsatile time series from each recruited subject. This clinical application results show that the proposed method detects AF with sensitivity of 0.9836, and discriminates PVCs and PACs from AF with sensitivities of 0.9680 and 0.9750, respectively.
Keywords: Arrhythmia, atrial fibrillation, Poincare plot, premature atrial contraction, premature ventricular contraction, root mean square of successive RR differences (RMSSD), Shannon entropy, turning point ratio
I. Introduction
Atrial fibrillation (AF) is the most common sustained arrhythmia. Over 5.2 million Americans have been diagnosed with AF, and the prevalence of AF is increasing concomitant with the aging of the U.S. population [1-3]. AF exerts a significant negative impact on the longevity and quality of life of a growing number of Americans, predominantly through its association with increased risk for heart failure and stroke. Effective AF treatments reduce risk for complications from AF. A major challenge facing clinicians and researchers is the early detection of AF, because particularly in its early stages, AF can be intermittent and asymptomatic [4]. While the population with undiagnosed AF is substantial [5], studies have shown that more intensive cardiac monitoring can improve AF detection and enable timelier institution of treatment [6]. Automated AF detection algorithms offer real-time realizable AF detection but often suffer from the fact that common benign causes of rhythm irregularity, most notably premature atrial (PAC) and ventricular (PVC) contractions, can cause false positive AF detection. [7, 8]. There is a pressing need to develop a continuous arrhythmia monitoring device that can accurately and reproducibly distinguish between AF, NSR, and premature beats (PACs and PVCs) in order to improve patients’ cardiovascular health and reduce the costs associated with treating AF [9].
A mobile cardiac monitoring device that is readily accessible, inexpensive, and simple to operate is needed to enhance rhythm monitoring. As smartphones have become prevalent, they meet the criteria of ready access and acceptance by the general public for monitoring their health [10]. Moreover, the use of pulsatile signals from smartphones has recently attracted the attentions of many researchers [8, 11, 12]. In prior studies, we have demonstrated that a smartphone camera recording of a fingertip yields pulsatile signals that are similar to heart-rate fluctuations. One of the major advantages of our approach is that it does not require extra hardware. The optical video monitoring of the skin with the standard digital camera embedded in smartphones is sufficient to extract information related to the variability in heart rate signal. We tested our smartphone-based AF detection application in 76 individuals with AF undergoing cardioversion and showed that it was able to distinguish between AF (pre-cardioversion) and NSR (post-cardioversion) with 96% accuracy [11]. However, in pilot work, we discovered that PACs and PVCs resulted in false positive AF detection.
Premature atrial contractions occur when an ectopic focus originating in the atrium leads to premature activation of the atria prior to typical sinoatrial node activation [13] whereas a PVC occurs when a similar process occurs in the ventricle [14]. PACs and PVCs can cause symptoms similar to AF, e.g., the sensation of an irregular pulse or having skipped beats. In contradistinction to AF, the clinical course of patients with PACs or PVCs is typically benign [15]. PACs and PVCs commonly occur in patterns, e.g., occurring every 2nd, 3rd, or 4th beat, termed bigeminy, trigeminy, and quadrigeminy. There are PAC and PVC discrimination algorithms that have been developed to distinguish these benign arrhythmias from AF, but such algorithms require an electrocardiographic signal [16, 17]. One limitation of existing approaches is that many templates of PAC/PVC waveforms need to be stored in memory since the approach is based on template matching. More importantly, this approach is only suited for ECG signals, not for pulsatile signals, such as those obtained from camera-enabled smartphones. Pulsatile signals have different characteristics and lower time resolution compared to ECG signals. Hence, there is a need to develop a new arrhythmia discrimination algorithm for a smartphone, which can differentiate between NSR, AF, PACs and PVCs.
In this paper, we propose a real-time comprehensive accurate arrhythmia discrimination algorithm for iPhone 4S/5S, which can discriminate between NSR, AF, PACs and PVCs using pulsatile time series collected from a smartphone’s camera. To increase the sensitivity of AF detection and add the new capabilities of PVC and PAC identification, our arrhythmia discrimination algorithm combines Root Mean Square of Successive RR Differences (RMSSD), Shannon Entropy (ShE) and turning point ratio (TPR), used in the previous AF detection algorithms, with the Poincare plot, and utilizes the features of pulse amplitude, and rise and fall times for arrhythmia discrimination. The RMSSD, ShE, Poincare plot and pulse amplitude, and rise and fall times features have been widely used in analyzing heart rhythms [18-27] while the TPR was proposed to be applied to heart rhythm analysis [28]. Here, we modified the conventional Poincare plot (or TPR) to discriminate bigeminy, trigeminy and quadrigeminy patterns of PACs/PVCs as well as detect PAC/PVC rhythms themselves among non-NSR subjects. Moreover, the use of pulse amplitude, and rise and fall times is especially well-suited for differentiating between the PAC and PVC. In this work, we evaluate our arrhythmia discrimination algorithms’ performance with data from patients with NSR, AF, PACs and PVCs who were recruited after consenting for our study and a clinically indicated electrical cardioversion at the University of Massachusetts Medical Center (UMMC). The main contributions of this paper is summarized as follows:
Smartphone-based pulsatile time series analysis: We analyze NSR, AF, PAC and PVC pulsatile time series obtained from smartphones to characterize their features. We consider i) pulse amplitude/times and ii) their RMSSD, ShE and TPR values, and iii) Poincare plot. A paired t-test is performed to verify significant differences between the features of NSR, AF, PAC and PVC.
PAC/PVC and its pattern discrimination: Using Poincare plot or turning point ratio (TPR), we discriminate PAC/PVC and its patterns, e.g. bigeminy, trigeminy, quadrigeminy, among non-NSR subjects which are classified from NSR by RMSSD and ShE. We begin by characterizing Poincare plot trajectory or TPR statistics of each specific PAC/PVC pattern. Here, the characterization is based on observation of pulsatile time series from smartphones. We then evaluate the performance of Poincare plot and TPR methods in terms of PVC/PAC classification accuracy.
PAC and PVC differentiation: We derive pulse amplitude, and rise and fall times near PAC/PVC episodes to estimate if they have complete compensatory pause or not. This pulse amplitude/time are used to differentiate between PAC and PVC episodes.
II. Materials and Methods
A. NSR, AF, PVC, and PAC Databases and Clinical Data Collection
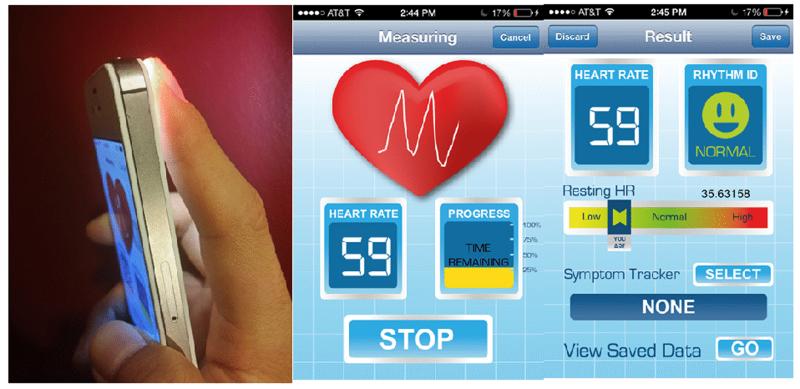
For the iPhone data collection, 88 subjects with recordings were obtained before and after cardioversion, as well as 7 with PACs and 4 with PVCs were recruited at UMMC. The subjects all gave their informed consent (H#14490 and #14-261) (IRB numbers for the studies). Our data collection protocol was approved by the Institutional Review Boards of UMMC and Worcester Polytechnic Institute. Participants were instructed to place their first (index) or second (middle) finger on a standard smart phone camera with the flash turned on (the flash will be automatically invoked by the application software) for two minutes. Data were recorded with participants in a supine position with spontaneous breathing. Fig 1 shows a current prototype of arrhythmia discrimination application for iPhone 4S.
Fig. 1.
A smart phone application for data recording (the application uses the camera lens and illumination to acquire information about heart rate and rhythm).
B. Preprocessing
Videos of their fingertip blood flow intensity were taken with 640×480 pixel resolution at a sampling rate of 30 frames per second and processed in real time. Only the green band from the RGB video was used as our recent results indicate this gives the best signal fidelity [29]. An average is made of the intensity values of the upper 320×480 pixels in each frame, i.e. the upper half of the fingertip on the green video signal, as our systematic analysis showed this region provided the best signal quality. Once the clean green signals are identified, pulse beat-to-beat detection from the green signals was performed incorporating interpolation, sudden DC change elimination, two stages of band pass filter, derivative rank filter and matching of original peaks. Specifically, the sudden DC change elimination is performed by removing differential changes larger than a predefined threshold value while the filters are designed to remove the high frequency noise and the DC component.
C. Arrhythmia Discrimination
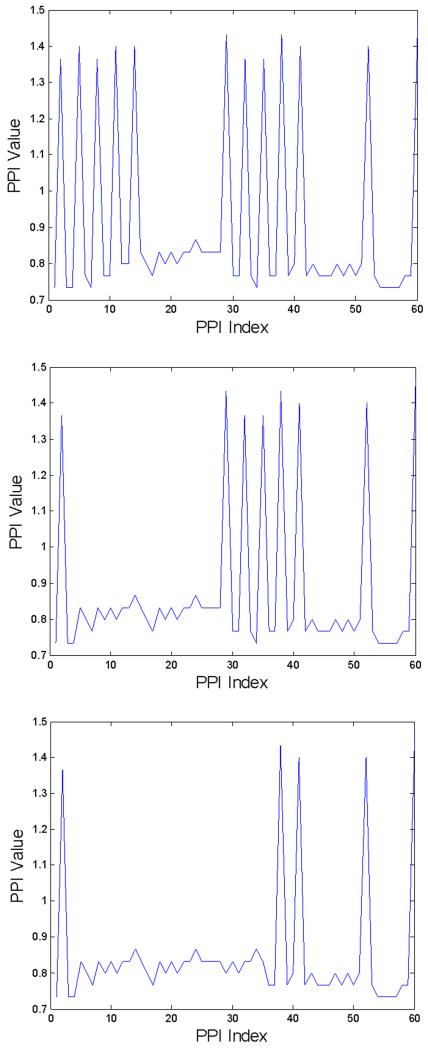
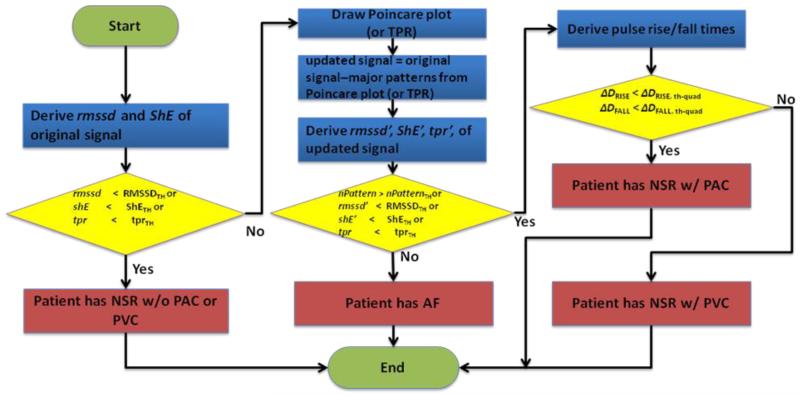
Fig. 2(a)-(c) shows three cases of PPI sequences of 60 beat-to-beat segments with ten, six, and three PAC quadrigeminy patterns, respectively. The previous algorithm [11] which is based on RMSSD and ShE classifies 60 beat-to-beat segments with at least 4 PAC patterns to be AF (see Figs. 2(a) and 2(b)) while classifying those with less than 4 PAC patterns to be NSR (see Fig. 2(c)). Our algorithm includes PAC and PVC discrimination capability which will further improve AF detection accuracy. The proposed arrhythmia discrimination algorithm is detailed in our flowchart, which is shown in Fig. 3.
Fig. 2.
Three PPI secquences extracted from 60 beat-to-beat segments. Threshold values are RMSSD/meanth=0.115 and ShEth = 0.55 [11]. (a): 10 PACs (RMSSD/mean=0.3758, ShE=0.4451), (b): 6 PACs (RMSSD/mean=0.2652, ShE=0.4345), (c): 3 PACs (RMSSD/mean=0.0997, ShE=0.4438).
Fig. 3.
Flowchart of NSR, AF, PVC, PAC detection and discrimination procedure
1) Feature Extraction
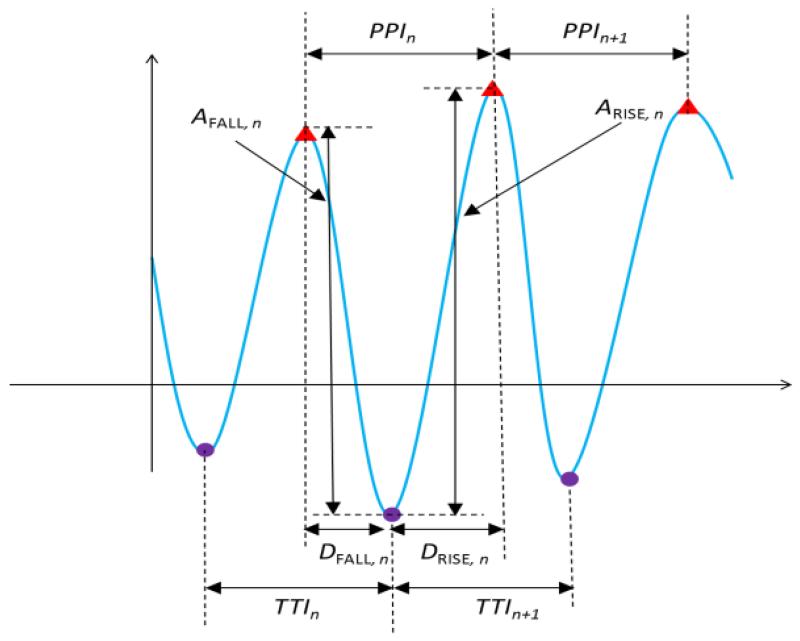
Our discrimination algorithm extracts features of the PPI signal, e.g., peak-to-peak interval (PPI) and trough-to-trough interval (TTI), rise time (DRISE) and fall time (DFALL) from the measured pulsatile time series. As shown in Fig. 4, the PPI is calculated by the difference between two successive peak times, TPEAK,n - TPEAK,n-1, and TTI is obtained by the difference between two successive trough times, TTROUGH,n - TTROUGH,n-1. DRISE is defined by the difference between the peak and the trough of the nth pulse, TPEAK,n - TTROUGH,n while DFALL is the difference between the trough of the nth pulse and the peak of the n-1th pulse and, TTROUGH,n - TPEAK,n-1. Similarly, ARISE is YPEAK,n - YTROUGH,n while AFALL is YPEAK,n-1 - YTROUGH,n.
Fig. 4.
Feature extraction of smartphone pulsatile time series. PPI and TTI are used to discriminate between AF, PAC/PVC and NSR as well as identify specific patterns (bigeminy, trigeminy, and quadrigeminy) of PAC/PVC. DRISE, DFALL, ARISE, and AFALL are for differentiating between PAC and PVC.
2) NSR Discrimination from AF, PAC and PVC subjects using RMSSD and ShE
We first derive the RMSSD and ShE from the PPI. The RMSSD is to measure the variability in a time series sequence and is calculated as follows:
| (1) |
The RMSSD of NSR is expected to be small compared to those of AF, PAC and PVC.
The ShE is to quantify the regularity of pattern in a time series and ShE on the time series ai, …, ai+L−1 is derived as:
| (2) |
where NBIN denotes the number of bins, of which each has lower (BLOW,k) and upper (BUP,k) bin boundaries for k ∈ {1,NBIN} and p(ai, …, ai+L−1,k) is expressed as:
The ShE of NSR is expected to be small compared to those of AF, PAC and PVC. The TPR is to measure a degree of independence in a time-series. A turning point (TP) is usually defined as a point having larger or smaller value than two nearest neighbor points [4]. The TPRs of NSR and AF are expected to be within in a range since they are from random PPIs while those of PAC and PVC are expected to be out of the range due to their regularities.
Our algorithm compares the RMSSD, ShE and TPR of PPI to their corresponding thresholds, respectively. If they are less than their thresholds, the pulsatile time series is classified as NSR without PAC or PVC (see the first condition in the flowchart in Fig. 3). Otherwise, the algorithm goes to next step and checks if the pulsatile time series is AF or PAC/PVC.
3) PAC/PVC Discrimination from non-NSR subjects using Poincare Plot or TPR
Our discrimination algorithm uses Poincare plot or TPR to determine if the non-NSR subject has PAC/PVC interspersed with NSR. Moreover, the algorithm gives information of PAC/PVC patterns, e.g., bigeminy, trigeminy, and quadrigeminy.
a) Poincare Plot
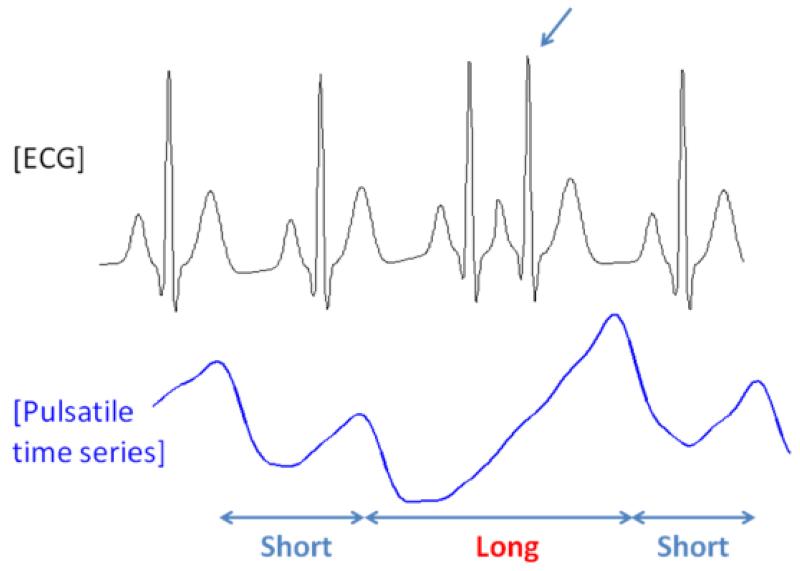
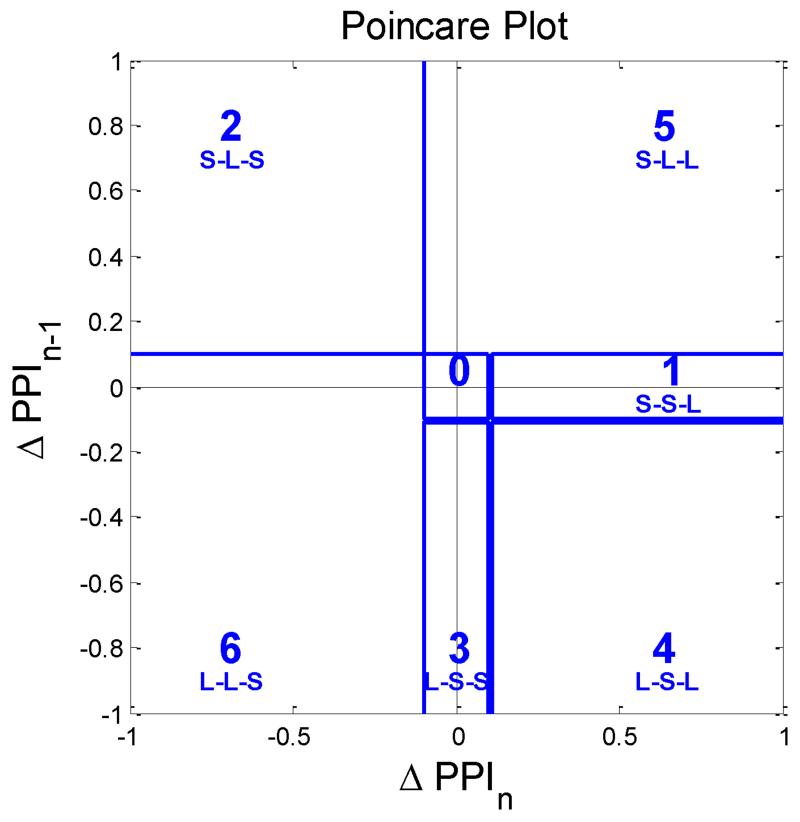
Shown at the bottom panel of Fig. 5 is an iPhone recording of a PAC subject and the top panel represents its corresponding ECG data. When a PAC episode occurs as noted by an arrow on the top panel of Fig. 5, the rising phase of iPhone’s PPI recording is markedly prolonged. Hence, taking the difference between the iPhone peak times of a normal beat and a PAC beat following another normal beat (ΔPPI), a “long” pulse interval is obtained (noted by a red interval). The difference between two consecutive normal pulse beats is termed the “short” pulse interval. The occurrences of PAC and PVC episode at every 2nd, 3rd and 4th pulse beats are known as bigeminy, trigeminy and quadrigeminy, respectively. We adopt a Poincare plot, which is widely used to quantify the similarity in time series xi for i = 2, …, N [30] by drawing a two-dimensional plot (xi−1, xi), to characterize ΔPPI dynamics and to discriminate PAC/PVC episodes from those of AF and NSR. To facilitate the discrimination among bigeminy, trigeminy and quadrigeminy patterns of the PAC and PVC, the Poincare plot was divided into six regions as shown in Fig. 6. The six regions represent permutations of all possible sequences of “long” and “short” based on 3 consecutive pulse intervals which are derived from 4 consecutive pulse beats as detailed in Table I. The region boundary was set optimally based on experiment results. The Poincare plot trajectory patterns of NSR, AF, PAC and PVC are respectively detailed in Table II. Moreover, the PAC and PVC are further classified into bigeminy, trigeminy, and quadrageminy patterns. Note that the trajectory pattern associated with NSR is expected to be “0-0-0-0-0-0-…” while AF is irregular at all 6 possible regions. Moreover, the various combinations of trigeminy and quadrigeminy associated with the PAC or PVC are distinct from either the NSR or AF. Combinations of PAC and PVC patterns have more orderly patterns (since the phase trajectory patterns will largely be confined to regions 0, 1, 2, 3 and 4 as shown above) than the random trajectory patterns associated with AF (trajectory patterns are evident in all regions of the Poincare plot). For bigeminy rhythm, the difference between NSR and PAC/PVC bigeminy is that the bigeminy has larger PPI value than NSR. Hence, the PAC/PVC bigeminy can be appropriately discriminated by the mean and variance.
Fig. 5.
Comparison of ECG RR intervals to pulse intervals obtained from an iPhone in a PAC episode (a premature atrial contraction results in a longer duration pulse interval and larger amplitude pulse beat when compared to a normal pulse beat).
Fig. 6.
Poincare plot divided into six regions. AF, NSR, PVC and PAC rhythms will have different trajectory patterns and they may be confined to only a single region or multiple regions as demonstrated in Fig. 4.
TABLE I.
Poincare plot sectors corresponding to PAC/PVC patterns which consist of bigeminy, trigeminy and quadrigeminy.
| PPIi-2- PPIi-1-PPIi | Region IDi |
|---|---|
| Short-Short-Long | 1 |
| Short-Long-Short | 2 |
| Long-Short-Short | 3 |
| Short-Short-Short | 0 |
| Long-Long-Long | 0 |
| Long-Long-Short | 4 |
| Short-Long-Long | 5 |
| Long-Short-Long | 6 |
TABLE II.
Arrhythmia with its corresponding trajectory pattern in Poincare plot
| Type of Arrhythmia | Trajectory Patterns in the Poincare plot’s six regions (ΔPPIi-3 − ΔPPIi-2 − ⋯ − ΔPPIi+2) |
|---|---|
|
Premature Atrial
Contraction (PAC) |
|
| Bigeminy | 0-0-0-0-0-0-… |
| Trigeminy | 2-4-2-4-2-4-… |
| Quadrigeminy | 1-2-3-1-2-3-… |
|
Premature
Ventricular Contraction (PVC) |
|
| Bigeminy | 0-0-0-0-0-0-… |
| Trigeminy | 2-4-2-4-2-4-… |
| Quadrigeminy | 1-2-3-1-2-3-… |
|
Normal Sinus
Rhythm (NSR) |
0-0-0-0-0-0-… |
|
Atrial Fibrillation
(AF) |
irregular patterns with trajectories at all 6 possible regions |
a) Turning point ratio (TPR)
To apply TPR in discriminating PAC/PVCs, we redefine a TP as a point where a specific pattern starts, e.g. bigeminy, trigeminy and quadrigeminy patterns. If an unknown time series has similar number of TP (or TPR), related to a specific pattern, to that of an independent time series, the unknown series is expected to be independent. Otherwise, the time series is expected to be dependent.
To detect a quadrigeminy, we define TPQUAD as a starting point of “Short – Short – Long – Short – Short – Long – Short - Short (SSLSSLSS)” in a PPI sequence. Considering an independent time sequence Xi, the probability of a point being quadrigeminy TP is given by:
Using the stochastic theory, the expectation μTP,quad and standard deviation σTP,quad of the number of quadrigeminy TPs in a segment ℓ are given by
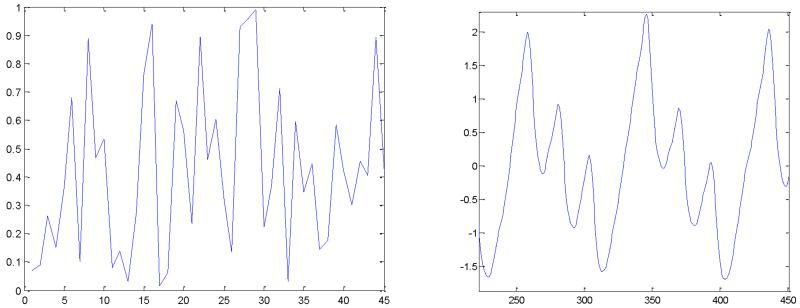
For example, an independent pulsatile time series with ℓ = 45 has μTP,QUAD and σTP,QUAD of 1.435 and 1.1737, respectively. A pulsatile time series segment is considered independent if the number of TPs (or TPR) falls within some threshold confidence interval TpThresh (or TprThresh) of the expected TP (or TPR). Otherwise, a pulsatile time series segment is not considered to be dependent. For example, the TPR method determines Figs. 7(a) and 7(b) to be non-quadrigeminy and quadrigeminy, respectively.
Fig. 7.
TPR of independent and dependent processes. (a): Independent process-random (TPR=0.0), (b): dependent process-PAC-quadrigeminy (TPR=0.125).
For trigeminy, we defined the TPTRI as a starting point where “Short-Long-Short-Long-Short (SLSLS)” PPI pattern begins. Hence, the probability of being TPTRI is similarly given by:
The μTP,TRI and σTP,TRI are given by:
For bigeminy, TPs are defined as a starting point where “Long-Long (LL)” PPI pattern starts. PAC/PVC bigeminy is appropriately discriminated by the mean and variance than TPR since the TPR of PAC/PVC is expected to be similar to that of NSR.
4) Differentiation between PVC and PAC using pulse amplitude, and rise and fall times
The PVC and PAC have similar Poincare plot trajectories and TPR values for the same pattern type (bigeminy, trigeminy, and quadrigeminy). To discriminate between PAC and PVC, our arrhythmia discrimination algorithm utilizes the physiological difference between PAC and PVC explained in the followings.
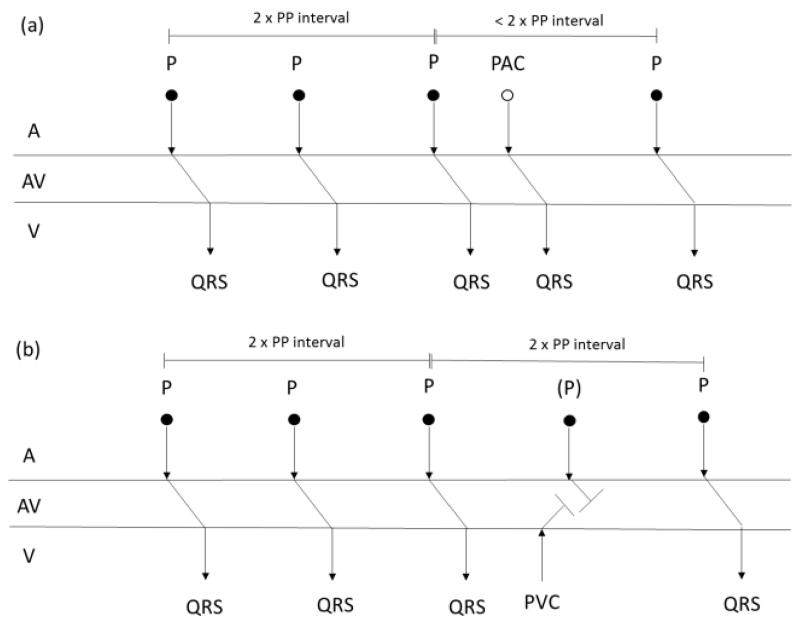
A PAC is an abnormal beat initiated in the atria before sinoatrial (SA) node triggers and the PAC usually interrupts the SA node and resets its timing. Hence, the PAC mostly generates a QRS complex similar to the NSR episode. Moreover, the NSR episode following a PAC usually occurs at time rescheduled by the PAC (called incomplete compensatory pause) as shown in Fig. 8(a). On the other hand, a PVC is a beat initiated in the ventricle before atrioventricular (AV) node triggers and the PVC does not usually interrupt the SA node. Hence, the NSR episode following a PVC usually occurs at previously scheduled time by SA node (called complete compensatory pause) as shown in Fig. 8(b). Moreover, the PVC usually generates a wider QRS complex compared to that of an NSR episode.
Fig. 8.
Heart rhythm timing diagrams of representative (a) PAC and (b) PVC subjects. PAC and PVC episodes are interspersed with NSR episodes. (a): incomplete compensatory pause is occurred between the PAC episode and the fourth NSR espisode, and (b): complete compensatory pause is occurred between the PVC episode and the fourth NSR episode.
The completeness and incompleteness are distinguished by the rise and fall times of the pulse signals. PAC episodes are usually expected to have similar rise and fall times similar to those of NSRs while PVC episodes have different fall times compared to those of NSRs. We define the difference (ΔDRISE) between the rise times of current and previous beats, i.e., ΔDRISE = DRISE,n - DRISE,n-1. Similarly, we define the difference between the fall times as ΔDFALL,n = DFALL,n - DFALL,n-1. For the ectopic beat of n, we derive the rise and fall time differences between ectopic beat and a normal beat following the ectopic beat which are ΔDRISE,n+2 and ΔDFALL,n+2, respectively. If ΔDRISE,n+2 and ΔDFALL,n+2 are within ΔDRISE,th-quad and ΔDFALL,th-quad, the ectopic beat is determined to be a PAC. Otherwise, it is considered as a PVC. For trigeminy beat of n, we utilize the differences between peak times between a normal before an ectopic beat and another normal beat after the ectopic beat, i.e., ΔPPIn+1 =PPIn+1 - PPIn. If the difference is less than ΔPPIth-tri, the ectopic beat is determined to be a PAC. Otherwise, the beat is considered as a PAC.
III. Results
We evaluated the performance of the arrhythmia discrimination algorithm with iPhone’s pulsatile time series data. Two minute pulsatile time series is collected from each subject. We compared our new algorithm to the previous arrhythmia discrimination algorithms, which are based on RMSSD and ShE. As performance metrics, we considered classification accuracy, sensitivity and specificity.
A. Detection of NSR
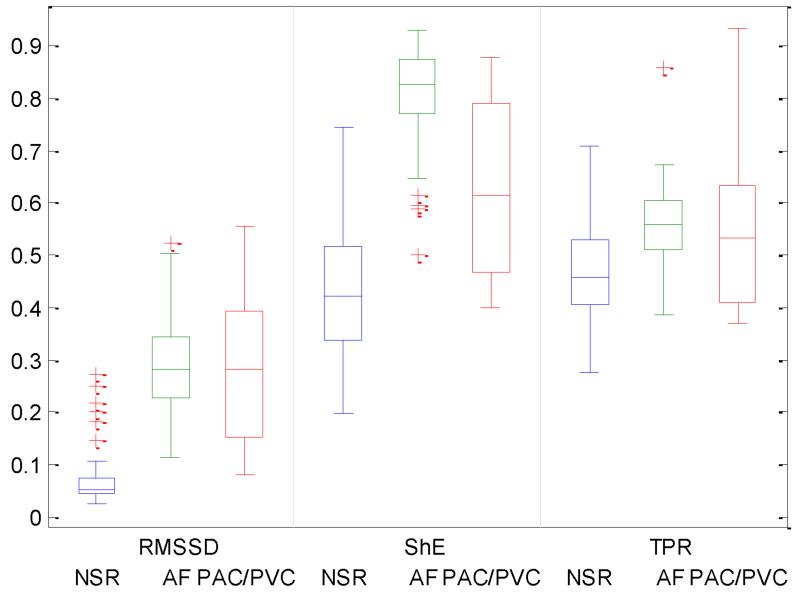
Fig. 9 compares the RMSSD (left), ShE (middle) and TPR (right) values of NSR, AF and PAC/PVC subjects. We performed paired t-test to determine if there are significant RMSSD differences between NSR, AF and PAC/PVC. The p-values between NSR and each arrhythmia indicate that RMSSD values are significantly different (p<0.05 at 95% CI) between NSR and each of other arrhythmias. However, RMSSD differences between AF and PAC/PVC are not significant. Similarly, ShE and TPR values of NSR, AF and PAC/PVC subjects are also found significantly different between NSR and each of arrhythmia, resepectively. Based on this observation, we applied RMSSD, ShE and TPR thresholds to classifying NSR subjects from others rhythms. The optimal RMSSD and ShE threshold values are derived as 0.09275, 0.3800 and 0.3600, respectively. As a result, the proposed method detects NSR with accuracy of 0.9788 which is higher than accuracy of 0.9577 from the conventional algorithm based on a combination of Rmssd and ShE [11].
Fig. 9.
Comparision of statistical values (RMSSD, ShE and TPR) between NSR, AF and PAC/PVC. The central mark on each box corresponds to the median; the edges of the box correspond to the 25th and 75th percentiles, the whiskers extend to the most extreme data points not considered outliers, and outliers are plotted individually.
B. PAC/PVC Discrimination among non-NSR Subjects: Poincare Plot vs. TPR
1) Poincare Plot
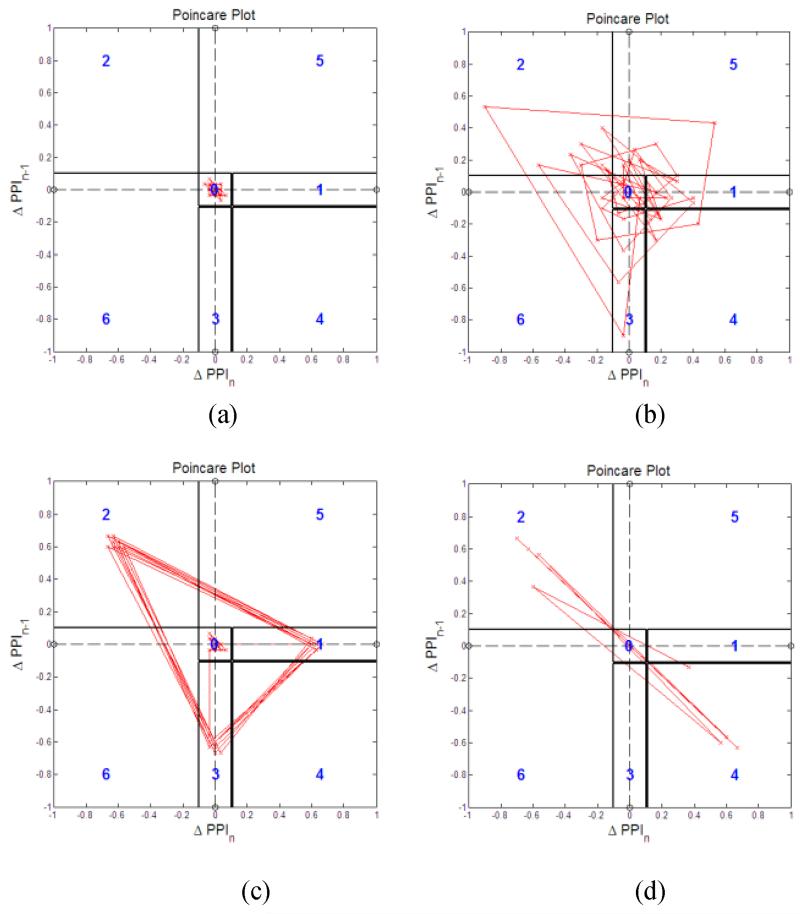
The Poincare pattern for NSR is largely confined within the region “0” as shown in Fig. 10(a) while the Poincare patterns of AF are random and their trajectories cross all six regions as shown in Fig. 10(b). For both PVC and PAC’s quadrigeminy, the Poincare plot shows repeating triangle patterns spanning the regions 1, 2 and 3, as shown in Fig. 10(c) as expected in Table II. On the other hand, the trigeminy of the PVC in Fig. 10(d) shows repeating patterns spanning the regions 2 and 4 as described in Table II.
Fig. 10.
Poincare plot with (ΔPPIi-1,ΔPPIi) trajectory for PAC/PVC and its pattern detections. (a): NSR: (b): AF, (c): PAC-quadrigeminy, and (d): PVC-trigeminy.
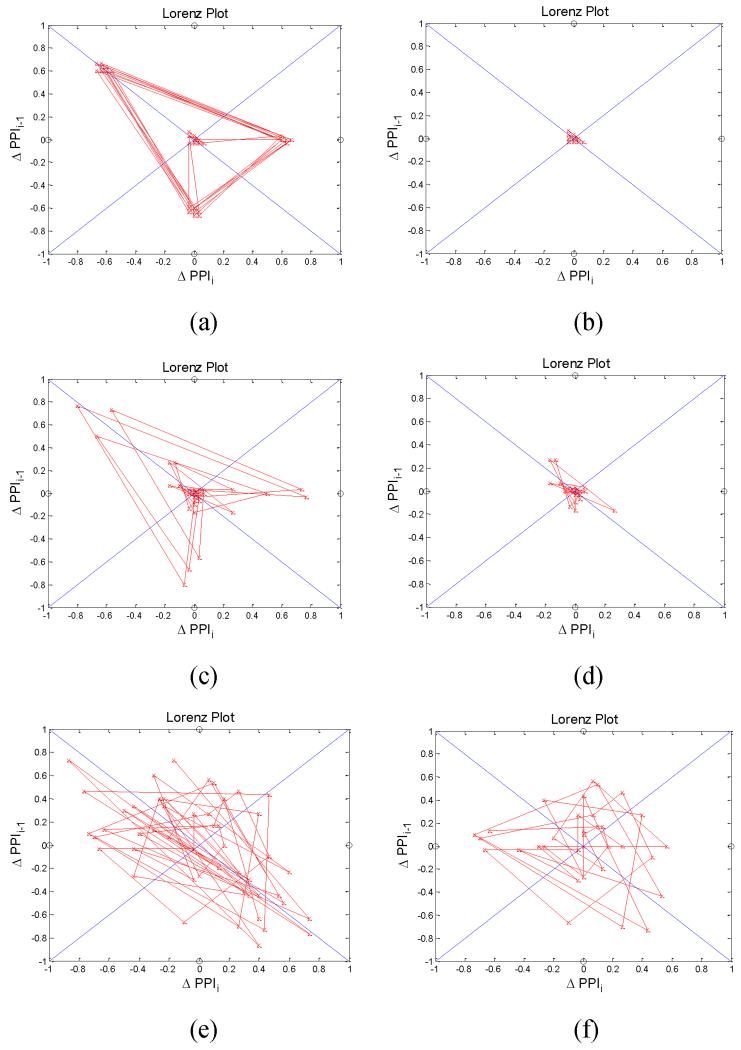
Fig. 11 shows Poincare plots of PAC, PVC and AF subjects before (left) and after (right) removing patterns. For the Poincare plots of PAC and PVC subjects after removing patterns, it is similar to NSR as shown in Figs. 11b and 11d. On the other hand, the Poincare plot of AF after removing patterns remains similar (see Fig. 11f) to that before removing patterns (see Fig. 11e).
Fig. 11.
Poincare plot with (ΔPPIi-1,ΔPPIi) trajectory before (right) and after (left) removing patterns (a): PAC-before, (b): PAC-after, (c): PVC-before, (d): PVC-after, (e): AF-before, and (f): AF-after.
2) TPR
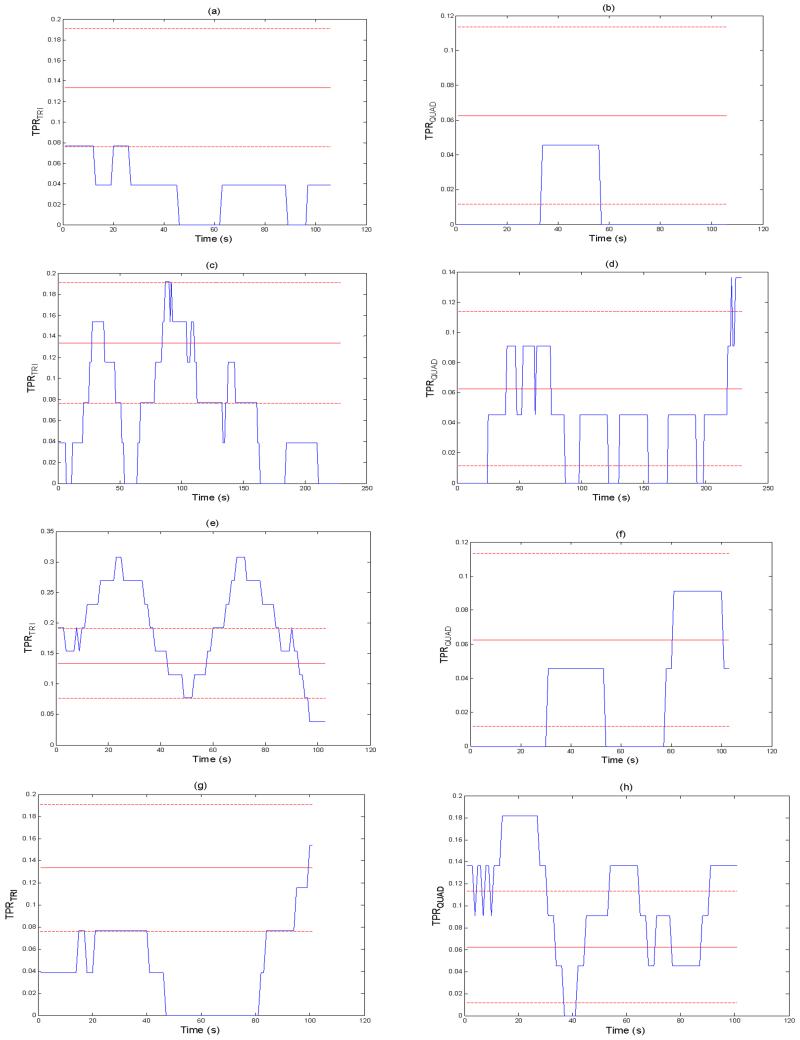
The TPRTRI and TPRQUAD of NSR are below μTPRTRI ± σTPRTRI and μTPRQUAD ± σTPRQUAD boundaries, respectively, as shown in Figs. 12(a) and (b). For AF, the TPRTRI and TPRQUAD cross their corresponding boundaries but are within the ranges for 50% of the entire time as shown in Figs. 12(c) and (d). Interestingly, the TPRTRI of PVC-trigeminy is larger than its corresponding upper bound, μTPRTRI + σTPRTRI, for 50 % of the time as shown in Fig. 12(e) while the TPRQUAD of PAC-quadrigeminy is much larger than μTPRQUAD + σTPRQUAD for most of the time as shown in Fig. 12(h). However, both the TPRTRI of PAC-quadrigeminy and TPRQUAD of PVC-trigeminy are mostly confined to be lower than μTPRTRI + σTPRTRI and μTPRQUAD + σTPRQUAD, respectively, as shown in Figs. 12(f) and 12(g).
Fig. 12.
TPRTRI(left) and TPRQUAD (right) of arrhythmia pulsatile time series (N=30, 0.13, 0.04,) (a): NSR (TPRTRI), (b): NSR (TPRQUAD), (c): AF (TPRTRI), (d): AF (TPRQUAD), (e): PVC-trigeminy (TPRTRI), (f): PVC-trigeminy (TPRQUAD), (g): PAC-quadrigeminy (TPRTRI), and (h): PAC-qudarigeminy (TPRQUAD).
C. Differentiation between PAC and PVC based on Complete and Incomplete Compensatory Pauses
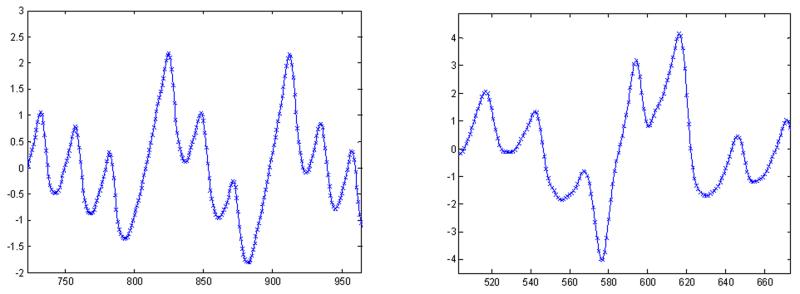
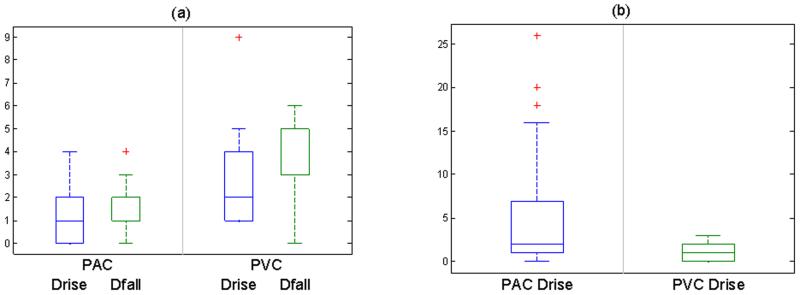
Representative PAC and PVC recordings are shown in Fig. 13. From these PAC and PVC recordings, rise and fall amplitudes (ARISE, AFALL) and their durations (DRISE, DFALL) near PAC or PVC episode are calculated. Fig. 14 compares DRISE, DFALL, ARISE and AFALL of 7 PACs (left) to those of 4 PVCs (right). Note the clear difference in the rise and fall time ratios between PAC and PVC. The paired-t test was performed to determine if there is a significant difference in the rise and fall time ratios between PAC and PVC subjects. Based on the our observation of measurement data, we set both of the thresholds ΔDRISE,th-quad, ΔDFALL,th-quad, ΔPPIth-tri to be 0.0667, 0.0667 and 0.0334 seconds. The proposed discrimination algorithm discriminates PAC from PVC subjects with accuracy of 1.000.
Fig. 13.
Representative smartphone data for (a): PAC and (b): PVC.
Fig. 14.
Comparision of Drise, Dfall and Ratio between PAC and PVC for (a): Quadrigeminy (p< 0.05 at 95% CI) and (b): Trigeminy (p < 0.05 at 95% CI).
D. Multiclass Classification Accuracy: NSR, AF, PAC, and PVC
The test characteristics of our multiclass arrhythmia discrimination algorithm are shown in Table IV. We describe the sensitivity, specificity, and accuracy values of the algorithm running on an iPhone 4S in 99 participants with AF (pre-cardioversion) and NSR (post-cardioversion) who were recruited at the UMMC. For PVC and PAC identification, our results are based on 7 subjects from UMMC with PACs and 4 subjects with PVCs. As shown in Table 4, when we combine our AF detection algorithms (RMSSD and ShE) with the Poincare plot (or TPR) and pulse rise and fall times, the accuracy of detection of PVCs and PACs is 100% and discrimination between the two rhythms is nearly 97%.
TABLE IV.
Test characteristics of PVC and PAC detection and discrimination using statistical methods* on a sample of 99 subjects’ data recorded using iPhone 4s (88 subjects with AF (pre-cardioversion) and NSR (post-cardioversion), 7 subjects with PAC and 4 subjects with PVC)
| Algorithm | PVC | PAC | ||||
|---|---|---|---|---|---|---|
| Sensitivity | Specificity | Accuracy | Sensitivity | Specificity | Accuracy | |
| 1.0000 | 0.9540 | 0.9680 | 1.0000 | 0.9620 | 0.9750 | |
Test Characteristics of PVC/PAC Detection Statistical Methods Established using the threshold values of RMSDD = 0.1093, Shannon Entropy = 0.4890, Poincare Plot = 0.2.
IV. Discussion and Conclusion
Accurate real-time arrhythmia discrimination using smartphones has been elusive to date. Given that paroxysmal and asymptomatic AF is a growing clinical and public health problem, better, cheaper, and more readily available AF detection technology is needed. In this paper, we have shown that subjects with AF, PVCs and PACs can be accurately distinguished from each other, and one another, using pulsatile signals obtained from the human fingertip using the camera of an iPhone 4s. Our proposed arrhythmia discrimination algorithm for smartphone was designed based on five parameters: (a) RMSSD, (b) Shannon entropy, (c) Poincare plot, (d) turning point ratio, and (e) pulse ampltitude, and rise and fall times. We evaluated our arrhythmia algorithm with iPhone pulsatile time series and the results demonstrated that our proposed algorithm has offered high classification accuracy, sensitivity, and specificity. The paired t-test has shown that there is a significant difference, in terms of RMSSD, ShE, TPR, pulse amplitude, and rise and fall time values, between NSR, AF, PAC and PVC. Moreover, our algorithm has an advantage in that it is able to discriminate with a near pinpoint accuracy when PAC and PVC episodes start and end. The potential for the method proposed in this work is directly translated into practical applications, and the integration of the designed algorithm with a smartphone may have significant implications for real-time clinical applications especially for continuous monitoring of arrhythmia. Given the ever-growing popularity of smartphones, our approach to AF detection using a smart phone will give the population as well as health care providers the opportunity to monitor for AF under a wide variety of conditions outside of the physician’s office. Because our approach does not involve a separate ECG sensor but instead uses only standard smart phone hardware, it is cost-effective, thereby leading to better acceptance and use by patients. We are not aware of any other algorithms that have the accuracy of our arrhythmia algorithm for smartphone applications, that are already developed using a moderately sized clinical study, and that have the capability to discriminate PVCs and PACs from AF. Since this is an algorithm development study, and the fact that there were a limited number of subjects with PACs and PVCs for validation, we will need to further test the algorithm in a separate cohort of patients with PVCs and PACs.
TABLE III.
Comparison between Poincare Plot and TPR. Test Characteristics of AF Detection among Non-NSR Subjects
| AF Detection without PAC/PVC Discrimination [11] |
Poincare Plot |
TPR (ΔPIi-1,ΔPIi) |
|
|---|---|---|---|
| Sensitivity | 0.9775 | 1.0000 | 0.6667 |
| Specificity | 0.0000 | 1.0000 | 0.7879 |
| Accuracy | 0.9293 | 1.0000 | 0.7934 |
References
- [1].Savelieva I, Camm AJ. Clinical Relevance of Silent Atrial Fibrillation: Prevalence, Prognosis, Quality of Life, and Management. Journal of Interventional Cardiac Electrophysiology. 2000 Jun 01;4:369–382. doi: 10.1023/a:1009823001707. 2000. [DOI] [PubMed] [Google Scholar]
- [2].Miyasaka Y, Barnes ME, Gersh BJ, Cha SS, Bailey KR, Abhayaratna WP, et al. Secular Trends in Incidence of Atrial Fibrillation in Olmsted County, Minnesota, 1980 to 2000, and Implications on the Projections for Future Prevalence. Circulation. 2006 Jul 11;114:119–125. doi: 10.1161/CIRCULATIONAHA.105.595140. 2006. [DOI] [PubMed] [Google Scholar]
- [3].Colilla S, Crow A, Petkun W, Singer DE, Simon T, Liu X. Estimates of Current and Future Incidence and Prevalence of Atrial Fibrillation in the U.S. Adult Population. The American Journal of Cardiology. 2013 Oct 15;112:1142–1147. doi: 10.1016/j.amjcard.2013.05.063. [DOI] [PubMed] [Google Scholar]
- [4].Sanders P, Berenfeld O, Hocini M, Jaïs P, Vaidyanathan R, Hsu L-F, et al. Spectral Analysis Identifies Sites of High-Frequency Activity Maintaining Atrial Fibrillation in Humans. Circulation. 2005 Aug 9;112:789–797. doi: 10.1161/CIRCULATIONAHA.104.517011. 2005. [DOI] [PubMed] [Google Scholar]
- [5].Humphries KH, Kerr CR, Connolly SJ, Klein G, Boone JA, Green M, et al. New-Onset Atrial Fibrillation: Sex Differences in Presentation, Treatment, and Outcome. Circulation. 2001 May 15;103:2365–2370. doi: 10.1161/01.cir.103.19.2365. 2001. [DOI] [PubMed] [Google Scholar]
- [6].Defaye P, Dournaux F, Mouton E, A. M. S. G. for the Prevalence of supraventricular arrhythmias from the automated analysis of data stored in the DDD pacemakers of 617 patients: the AIDA study. Pacing and Clinical Electrophysiology. 1998;21:250–255. doi: 10.1111/j.1540-8159.1998.tb01098.x. [DOI] [PubMed] [Google Scholar]
- [7].Tateno K, Glass L. Automatic detection of atrial fibrillation using the coefficient of variation and density histograms of RR and ΔRR intervals. Medical and Biological Engineering and Computing. 2001 Nov 01;39:664–671. doi: 10.1007/BF02345439. 2001. [DOI] [PubMed] [Google Scholar]
- [8].Jinseok L, Reyes BA, McManus DD, Mathias O, Chon KH. Atrial Fibrillation Detection Using an iPhone 4S. Biomedical Engineering, IEEE Transactions on. 2013;60:203–206. doi: 10.1109/TBME.2012.2208112. [DOI] [PubMed] [Google Scholar]
- [9].Benjamin EJ, Chen P-S, Bild DE, Mascette AM, Albert CM, Alonso A, et al. Prevention of Atrial Fibrillation: Report From a National Heart, Lung, and Blood Institute Workshop. Circulation. 2009 Feb 3;119:606–618. doi: 10.1161/CIRCULATIONAHA.108.825380. 2009. [DOI] [PMC free article] [PubMed] [Google Scholar]
- [10].Mosa AS, Yoo I, Sheets L. A Systematic Review of Healthcare Applications for Smartphones. BMC Medical Informatics and Decision Making. 2012;12:67. doi: 10.1186/1472-6947-12-67. [DOI] [PMC free article] [PubMed] [Google Scholar]
- [11].McManus DD, Lee J, Maitas O, Esa N, Pidikiti R, Carlucci A, et al. A novel application for the detection of an irregular pulse using an iPhone 4S in patients with atrial fibrillation. Heart Rhythm. 2013 Mar;10:315–9. doi: 10.1016/j.hrthm.2012.12.001. [DOI] [PMC free article] [PubMed] [Google Scholar]
- [12].Scully CG, Lee J, Meyer J, Gorbach AM, Granquist-Fraser D, Mendelson Y, et al. Physiological parameter monitoring from optical recordings with a mobile phone. IEEE Trans Biomed Eng. 2012 Feb;59:303–6. doi: 10.1109/TBME.2011.2163157. [DOI] [PMC free article] [PubMed] [Google Scholar]
- [13].Brodsky M, Wu D, Denes P, Kanakis C, Rosen KM. Arrhythmias documented by 24 hour continuous electrocardiographic monitoring in 50 male medical students without apparent heart disease. The American Journal of Cardiology. 1977;39:390–395. doi: 10.1016/s0002-9149(77)80094-5. [DOI] [PubMed] [Google Scholar]
- [14].Belhassen B. Radiofrequency ablation of “benign” right ventricular outflow tract extrasystoles: A therapy that has found its disease? Journal of the American College of Cardiology. 2005 Apr 19;45:1266–1268. doi: 10.1016/j.jacc.2005.01.028. [DOI] [PubMed] [Google Scholar]
- [15].Kimura K, Tabei K, Asano Y, Hosoda S. Cardiac Arrhythmias in Hemodialysis Patients. Nephron. 1989;53:201–207. doi: 10.1159/000185745. [DOI] [PubMed] [Google Scholar]
- [16].Krasteva V, Jekova I. QRS Template Matching for Recognition of Ventricular Ectopic Beats. Annals of Biomedical Engineering. 2007 Dec 01;35:2065–2076. doi: 10.1007/s10439-007-9368-9. 2007. [DOI] [PubMed] [Google Scholar]
- [17].Tran T, McNames J, Aboy M, Goldstein B. Prediction of paroxysmal atrial fibrillation by analysis of atrial premature complexes. Biomedical Engineering, IEEE Transactions on. 2004;51:561–569. doi: 10.1109/TBME.2003.821030. [DOI] [PubMed] [Google Scholar]
- [18].Lee J, Nam Y, Chon K. Time-Varying Coherence Function for Atrial Fibrillation Detection. Biomedical Engineering, IEEE Transactions on. 2013;60:2783–2793. doi: 10.1109/TBME.2013.2264721. [DOI] [PubMed] [Google Scholar]
- [19].Palazzolo JA, Estafanous FG, Murray PA. Entropy measures of heart rate variation in conscious dogs. Am J Physiol. 1998 Apr;274:H1099–105. doi: 10.1152/ajpheart.1998.274.4.H1099. [DOI] [PubMed] [Google Scholar]
- [20].Lee J, McManus DD, Merchant S, Chon KH. Automatic motion and noise artifact detection in Holter ECG data using empirical mode decomposition and statistical approaches. IEEE Trans Biomed Eng. 2012 Jun;59:1499–506. doi: 10.1109/TBME.2011.2175729. [DOI] [PubMed] [Google Scholar]
- [21].Zabel M, Koller BS, Sachs F, Franz MR. Stretch-induced voltage changes in the isolated beating heart: importance of the timing of stretch and implications for stretch-activated ion channels. Cardiovascular Research. 1996 Jul 1;32:120–130. 1996. [PubMed] [Google Scholar]
- [22].Franz MR, Cima R, Wang D, Profitt D, Kurz R. Electrophysiological effects of myocardial stretch and mechanical determinants of stretch-activated arrhythmias. Circulation. 1992 Sep 1;86:968–78. doi: 10.1161/01.cir.86.3.968. 1992. [DOI] [PubMed] [Google Scholar]
- [23].Mourot L, Bouhaddi M, Perrey S, Rouillon J-D, Regnard J. Quantitative Poincaré plot analysis of heart rate variability: effect of endurance training. European Journal of Applied Physiology. 2004 Jan 01;91:79–87. doi: 10.1007/s00421-003-0917-0. 2004. [DOI] [PubMed] [Google Scholar]
- [24].Brennan M, Palaniswami M, Kamen P. Do existing measures of Poincare plot geometry reflect nonlinear features of heart rate variability? Biomedical Engineering, IEEE Transactions on. 2001;48:1342–1347. doi: 10.1109/10.959330. [DOI] [PubMed] [Google Scholar]
- [25].Guzzetti S, Borroni E, Garbelli PE, Ceriani E, Bella PD, Montano N, et al. Symbolic Dynamics of Heart Rate Variability: A Probe to Investigate Cardiac Autonomic Modulation. Circulation. 2005 Jul 26;112:465–470. doi: 10.1161/CIRCULATIONAHA.104.518449. 2005. [DOI] [PubMed] [Google Scholar]
- [26].Voss A, Hnatkova K, Wessel N, Kurths J, Sander A, Schirdewan A, et al. Multiparametric Analysis of Heart Rate Variability Used for Risk Stratification Among Survivors of Acute Myocardial Infarction. Pacing and Clinical Electrophysiology. 1998;21:186–196. doi: 10.1111/j.1540-8159.1998.tb01086.x. [DOI] [PubMed] [Google Scholar]
- [27].DeGiorgio CM, Miller P, Meymandi S, Chin A, Epps J, Gordon S, et al. RMSSD, a measure of vagus-mediated heart rate variability, is associated with risk factors for SUDEP: The SUDEP-7 Inventory. Epilepsy & Behavior. 2010;19:78–81. doi: 10.1016/j.yebeh.2010.06.011. [DOI] [PMC free article] [PubMed] [Google Scholar]
- [28].Dash S, Raeder E, Merchant S, Chon K. A statistical approach for accurate detection of atrial fibrillation and flutter. Computers in Cardiology, 2009. 2009:137–140. [Google Scholar]
- [29].Scully C, Jinseok L, Meyer J, Gorbach AM, Granquist-Fraser D, Mendelson Y, et al. Physiological Parameter Monitoring from Optical Recordings With a Mobile Phone. Biomedical Engineering, IEEE Transactions on. 2012;59:303–306. doi: 10.1109/TBME.2011.2163157. [DOI] [PMC free article] [PubMed] [Google Scholar]
- [30].Sarkar S, Ritscher D, Mehra R. A Detector for a Chronic Implantable Atrial Tachyarrhythmia Monitor. Biomedical Engineering, IEEE Transactions on. 2008;55:1219–1224. doi: 10.1109/TBME.2007.903707. [DOI] [PubMed] [Google Scholar]


