

Abstract
Scope:
Buckwheat (BW) consumption has been associated to a broad range of health benefits: antioxidant, anti-inflammatory and anticancer. These beneficial effects have been partially related to the presence of flavonoids. However, some of these compounds (i.e., rutin and quercetin) are metabolized in the gastrointestinal tract generating derived phenolic metabolites. In this study we investigated the biological activity of rutin (Ru), quercetin (Q) an their derived phenolic metabolites 3,4-dihydroxyphenylacetic acid (3,4-DHPAA), 3-hydroxyphenylacetic acid (3-HPAA), and 4-hydroxy-3-methoxyphenylacetic acid (homovanillic acid, HVA).
Methods and results:
Q showed the highest antioxidant and reducing activity, and Ru the maximum chelating activity (85.33%). Antioxidant activity of 3,4-DHPAA was 5-fold higher than that of HVA, whereas their reducing activity was similar. The formation of methylglyoxal (MGO)-BSA and glucose-BSA (advanced glycation end products) was inhibited by Ru (98.5 and 92.7%), Q (95.6 and 89.1%) and 3,4-DHPPA (84.4.6 and 77.5%). Furthermore, Q (10–50 μM) and Ru (1–50 μM) downregulated the release of PGE2, IL-8 and MCP-1, molecules involved in the inflammatory response, in IL1β-inflamed myofibroblasts of colon CCD-18Co.
Conclusion:
This study describes that BW phytochemicals and their phenolic metabolites may be responsible for the beneficial effects against chronic diseases ttributed to BW consumption.
Keywords: Buckwheat, antioxidant activity, anti-inflammatory, antiglycation, phytochemicals
Introduction
The relation between plant-derived food consumption and health benefits has been described in an important number of epidemiological studies [1]. The interest of BW as a functional food has increased in the past few years [2]. BW has been used as an important raw material for functional food development because of its functionalities and compounds content, such as proteins, flavonoids, and phytosterols among others [3]. The presence of Ru (quercetin-3-rutinoside), suggested as the main BW flavonoid, has been reported in BW seeds and sprouts [4]. Ru is known for its anti-oxidant activity in Fenton reaction [5] and inhibiting low-density lipoprotein (LDL) peroxidation [6], as well as for its anti-inflammatory and vasoactive properties [6]. Q, the aglycone of Ru, is a flavonoid with a potent antioxidant activity that is present in BW groats in a lower concentration [4].
A relevant fraction of dietary flavonoids is not absorbed in the small intestine and reach unaltered the colon, where are transformed by the gut microbiota enzymes into a wide range of phenolic acids [7]. The colonic microbiota shows diverse deglycosylation activities, thus releasing aglycones that are rapidly degraded to produce simpler phenolics [8, 9]. It is known that the intestinal microflora participates in the metabolism of BW flavonoids, including Ru and Q, generating phenolic metabolites such as 3-HPAA, 3,4-DHPAA and HVA [10]. The metabolic activity of the gut microflora on polyphenols is often responsible for the modulation of the biological activity of these dietary compounds and their potential health effects [11]. Some of these metabolites might be biologically active, be absorbed and contribute to the biological activity associated with the flavonoid-rich food [12].
However, hitherto the lack of information about the specific properties of the main metabolites makes difficult to determine which compounds, native forms of flavonoids or their derived metabolites, are responsible for the effects observed.
Different antioxidant activity depending on the methodology and conditions used [13], and inconsistent anti-inflammatory activity at the intestinal level [14, 15] of rutin and querecetin has been documented. In addition to this, the activity of the phenolic metabolites has been poorly investigated [16]. Hence, in order to shed some light about what compounds may be responsible of the benefits attributed to BW consumption, in this study we have investigated: (i) the antioxidant, reducing and chelating activity of Ru, Q and their phenolic metabolites, (ii) their ability to inhibit AGEs formation, and (iii) their capacity to ameliorate IL-1β induced inflammation in an intestinal inflammation cell model.
Materials and methods
2.1. Chemicals
All chemicals were of analytical grade. 2,2-diphenyl-1-picrylhydrazyl (DPPH), 6-hydroxy-2,5,7,8-tetramethylchroman-2-carboxylic acid (Trolox), Q (3,3’,4’,5,7-pentaxydroxyflavone) and Ru (quercetin-3-rutinoside) were supplied by Extrasynthese (Genay, France). 3,4-DHPAA, 3-HPAA, HVA, sodium azide, BSA, D-glucose, methylglyoxal (MGO), 2,4,6-tripirydyl-S-triazine (TpTZ), deferoxamine (DEF), 3-(2-pyridyl)-5,6-diphenyl-1,2,4-triazine-p,p’-disulfonic acid monosodium salt hydrate (ferrozine, FZ), and 3-(4,5-dimethylthiazol-2-yl)-2,5-diphenyltetrazolium (MTT) were purchased from Sigma (Sigma Chemical Co., St. Louis, MO, U.S.A.). DMSO was purchased from MERK Millipore (Germany). Methanol, acetic acid (supra-gradient) and sodium acetate were from Merck KGaA, Darmstadt, Germany. Water was purified with a Mili-Q-system (Milipore, Bedford, USA).
2.2. Preparation of Ru, Q and their phenolic metabolites for assays.
For antioxidant/reducing activity assays, an appropriate amount of Ru, Q and their phenolic metabolites were dissolved in methanol and the concentration was confirmed by UV measurement as previously described [17, 18]. For the measurement of the antioxidant activity with DPPH assay, reducing activity with cyclic voltammetry and FRAP assays, 1 mM stock solutions of each compound was prepared in methanol, whilst for chelating activity solutions were in DMSO.
For determination the inhibitory activity against formation of AGEs in BSA/glucose and BSA/MGO systems, Ru, Q and their phenolic metabolites were initially diluted in a small volume of DMSO and then in phosphate buffer (0.1 M, pH 7.4) to obtain 1 mM concentration of each compound (DMSO/phosphate buffer; 1:5; v/v).
For the study of the anti-inflammatory activity, stock solutions were prepared in DMSO at the final concentration of 10 mM. These solutions were used to treat the myofibroblasts of colon CCD-18Co, at the desired concentrations, by addition to the culture medium. The cells were not exposed to concentrations of DMSO higher than 0.5%.
2.3. Determination of the antioxidant activity
Antioxidant activity was carried out using DPPH• radicals according to Brand-Williams et al. [19]. DPPH radical scavenging activity (DPPH RSA) was expressed as mM of Trolox. Measurements (n=9) were carried out using a temperature-controlled spectrophotometer UV-160 1PC with CPS-Controller (Shimadzu, Japan).
2.4. Cyclic voltammetry
Reducing capacity was determined by cyclic voltammetry (CV) method as previously described in details by Zielinska et al. [20]. Standards solutions of the tested compounds were diluted with the Britton-Robinson (B-R) buffer (0.1 M, pH 6.0) at 1:1 ratio, and the final standard concentration was 250 μM. Cyclic voltammograms of the tested compounds (n=9) were recorded using a G 750 Gamry potentiostat (USA) in the potential range from −0.1 to 1.2 V, while for Trolox from −0.1 to 1.3 V at a scan rate of 0.1 V s−1. The results were expressed as mM of Trolox.
2.5. FRAP assay
FRAP was determined by the method of Benzie and Strain [21]. The samples were measured in 9 different replicates. The standard curve was prepared using Trolox solution (0.034 – 0.612 mM), and the results were expressed as mM of Trolox equivalent.
2.6. Chelating activity
Ferrous ions chelating activity was measured by inhibition of the formation of Fe2+ - FZ complex after treatment of the tested compounds with Fe2+ according to Mladénka et al. [22]. A standard curve of Fe2+ ions was prepared within the range of concentration 5 – 60 μM. Ferrous chelation efficiency of tested compounds was expressed in %. Sample were measured in 9 replicates.
2.7. BSA-glucose and BSA-MGO assays
The inhibitory activity against formation of AGEs in BSA/glucose and BSA/MGO systems was determined as previously described in details by Szawara-Nowak et al. [23]. Aminoquanidine (AG) 1 mM was used as positive control. Fluorescent intensity (BSA-glucose: Ex 330 nm/Em 410 nm and BSA-MGO: Ex 340 nm/Em 420 nm) was measured. Nine samples were run for each set and the percent inhibition of AGEs formation by BW flavonoids and their metabolites or AG solution was calculated.
2.8. Cell line and culture conditions.
The myofibroblasts-like cell line CCD-18Co was purchased from the American Type Culture Collection (ATTCC) (Rockville, MD, USA). The cells were maintained in Eagle’s minimum essential medium (EMEM) at a final pH 7.2 – 7.4 and enriched with L-glutamine (2 mM), nonessential amino acids (0.1 mM), sodium pyruvate (1 mM), sodium bicarbonate (1.5 g/L), penicillin and streptomycin (100 U mL−1 and 100 mg mL−1, respectively) and fetal bovine serum – FBS – (10% v/v). The cells were grown at 37° C under a 5% CO2 / 95% air atmosphere at constant humidity. The cells were cultured at 6000 cells/cm2 and incubated for 4 – 5 days until reaching confluence >80%. Next, the cells were subcultured using Trypsin-EDTA (0.25%−0.03%). All the experiments were performed at population doubling levels (PDL) and passages between 33 – 34 and 15 – 16, respectively.
2.6. Measurement of PGE2 by enzyme-linked immunosorbent assay (ELISA)
Since FBS influences COX-2 activity and the production of PGE2 [24], confluent myofibroblasts cultured in 96-well plates were incubated in deprived-medium (0.1% FBS v/v) without phenol red for 24h. Next, the cells were treated with the pro-inflammatory cytokine IL-1β (1 ng/mL) in the presence or absence of Ru (50, 10 and 1 μM) and Q (50 and 10 μM) for 24 h. In parallel, cells exposed to DMSO (0.5% v/v) were used as control. As the effect of 3,4-DHPAA, 3-HPAA, and HVA has already been determined in the the myofibroblasts of colon CCD-18Co at concentrations higher than those used in this study [25], these compounds were discarded for this assay. The level of PGE2 released to the culture medium was determined using an ELISA kit following the manufactureŕs instructions (Cayman Chemicals, San Diego, CA, USA). The medium was removed and kept at –80 ºC until analysis. A 1:80 dilution was used.
2.10. Analysis of COX-2 expression by western blot
Cells treated as described for PGE2 analysis were washed with sterile PBS and lysed using ice-cold RIPA buffer supplemented with protease inhibitors (Sigma). Samples were centrifuged at 13000 × rpm for 15 min at 4 ºC. Protein concentration was determined by DC colorimetric assay (Bio-Rad) at 750 nm using a microplate reader (SynergyH1, Biotek) and software GEN5 v 2.0. 10 μg of protein was loaded in each lane, separated by 10% SDS-PAGE and transferred to polyvinylidene difluoride membranes (GE Healthcare) by electroblotting. After blocking with albumin (5% w/v) for 1 h, the membranes were incubated with the primary antibodies of COX-2 (mouse anti-COX2; dilution 1:1000) and GAPDH (rabbit anti-GAPDH; dilution 1:2500) for 2 h. The incubation with the secondary antibodies, goat anti-rabbit and goat anti-mouse, at the dilution 1:10000 (Li-COR Bioscience, USA) was performed in darkness for 1 h. For the detection and quantification of the proteins, COX-2 and GAPDH, Odyssey Infrared Imagine System v. 1.2 (Li-COR Bioscience, USA) was used. This assay was repeated three times.
2.11. Measurement of IL-6, IL-8, MCP-1 and ICAM-1 by enzyme-linked immunosorbent assay (ELISA)
For this assay, the cells were treated as described in the previous assays. Furthermore, the effect 50 μM 3,4-DHPAA, 3-HPAA and HVA in IL-1β-treated cells was also investigated. Culture medias were used for the analysis of IL-6, IL-8 and MCP-1, whereas protein lysates were used for the analysis of ICAM-1. The ELISA kits selected for the analysis of these cytokines were purchased from peprotech (USA). The limits of detection were: 16 pg/mL for IL-8 and MCP-1, 32 pg/mL for IL-6, and 23 pg/mL for ICAM-1.
2.12. Statistical analysis
Results are given as mean values ± standard deviation (SD) of 9 independent measurements for chemical analysis, and between 3 – 4 independent biological replicates for the cellular assays. The results were subjected to one-way analysis of variation ANOVA followed by post-hoc analysis. The significant differences (P < 0.05) were calculated and indicated. The correlation analysis was performed and the Pearson correlation coefficient was calculated.
3. Results
3.1. Antioxidant, reducing and chelating activity of Ru, Q and their phenolic metabolites
In this study Q showed the highest ability to scavenge DPPH• radicals followed by Ru, whilst amongst low-molecular-weight phenolic acids 3,4-DHPAA showed equivalent antioxidant activity to Ru. The antioxidant activity of HVA was 5-fold lower than Ru whilst DPPH• scavenging activity of 3-HPAA was negligible (Table 1). The order of the antioxidant activity provided by the DPPH RSA assay was: Q > Ru = 3,4-DHPAA > HVA >> 3-HPAA.
Table 1.
The antioxidant, reducing, chelating activity and inhibitory activity against AGEs formation of rutin (Ru), quercetin (Q), 3,4-dihydroxyphenylacetic acid (3,4-DHPAA), 3-hydroxyphenylacetic acid (3-HPAA) and 3-methoxy-4-hydroxyphenylacetic acid (homovanillic acid, HVA).
| Compound/assay | Antioxidant activity (mM Trolox) |
Reducing activity (mM Trolox) |
Chelating activity (%) |
Inhibitory activity against AGEs (% of fluorescence inhibition) |
||
|---|---|---|---|---|---|---|
| DPPH RSA | FRAP | CV | FZ | BSA/glucose | BSA/MGO | |
| Ru | 1.687 ± 0.02c | 1.636 ± 0.06b | 0.459 ± 0.01c | 85.33 ± 2.13e | 98.5 ± 0.1e | 92.7 ± 0.2d |
| Q | 2.087 ± 0.03d | 3.677 ± 0.19e | 0.897 ± 0.04d | 72.84 ± 1.82d | 95.6 ± 0.2d | 89.1 ± 0.4c |
| 3,4-DHPAA | 1.756 ± 0.02c | 2.113 ± 0.02c | 0.382 ± 0.05b | 1.87 ± 0.06a | 84.4 ± 0.7c | 77.5 ± 0.7b |
| 3-HPAA | 0.005 ± 0.001a | 0.001 ± 0.001a | 0.314 ± 0.02a | 2.77 ± 0.07b | 44.3 ± 0.6b | 4.6 ± 0.2a |
| HVA | 0.343 ± 0.01b | 2.800 ± 0.02d | 0.394 ± 0.01b | 59.34 ± 1.48c | 37.4 ± 0.1a | 3.9 ± 0.5a |
Results were provided by DPPH RSA - DPPH radical scavenging activity assay; FRAP - ferric reducing/antioxidant power assay; CV - cyclic voltammetry assay; FZ - ferrozine assay; BSA/glucose - bovine serum albumin/glucose model system; BSA/MGO - bovine serum albumin/methylglyoxal model system. The inhibitory effect of 1.0 mM of standard solution of aminoguanidine (AG) was 75.3 and 52.4% in BSA/glucose and BSA/MGO model systems, respectively. Data are expressed as means ± standard deviation (n = 9). Means in a column related to a respective assay followed by the different letters are significantly different (P ≤ 0.05).
Reducing activity of Ru, Q, 3,4-DHPAA, 3-HPAA and HVA was determined by CV and FRAP assays (Table 1). The cyclic voltammetry method based on the first oxidation potential and the area under voltammograms was used for the characterization of the reducing activity of Ru, Q, 3,4-DHPAA, 3-HPAA and HVA (Figure 2). Q showed the highest reducing activity followed by Ru, whilst 3,4-DHPAA, 3-HPAA and HVA showed lower reducing activity by 17, 32 and 14% as compared to Ru and almost 3-fold lower activity as compared to Q. The rank of the anodic peak potentials (Epa) of the investigated compounds was as follows: Q (0.334 V) ˂ Ru (0.390 V) ˂ 3,4-DHPAA (0.406 V) ˂ HVA (0.564 V) ˂ 3-HPAA (0.852 V) whilst Trolox showed Epa= 0.346 V (Figure 2).
Figure 2.
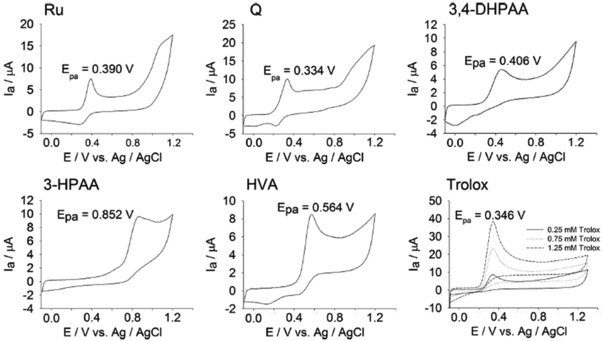
Cyclic voltammograms of 0.25 mM of standards solution (final concentration) of Ru, Q, 3,4-DHPAA), 3-HPAA, HVA and selected Trolox solutions in Britton-Robinson (B-R) buffer (0,1 M; pH 7,4) recorded from −100 to +1300 mV; scan rate 100 mV s-1.
The results of FRAP assay are shown in Table 1. It is characterized by the reduction of Fe3+ to Fe2+ depending on the available reducing species [26]. Q showed the highest FRAP value, but that for Ru was twice lower. It was also found that FRAP values of 3,4-DHPAA and HVA were between those of Q and Ru, whilst 3-HPAA was negligible. Interestingly, the latest one showed also the lowest reducing activity by CV assay and no scavenging activity against DPPH (Table 1).
The anodic peak potentials (Epa) of Ru and Q were related to DPPH RSA and reducing activity determined by FRAP and CV methods. The activity of 3,4-DHPAA and HVA was in agreement to their DPPH RSA and FRAP values as well as to their anodic peak potentials (0.406 V and 0.564 V, respectively). In contrast, reducing activity and Epa for 3-HPAA were the lowest, what correlates with its negligible DPPH RSA and FRAP values.
Ru showed the highest iron(II) – chelation whilst Q a little lower (Table 1). Amongst low-molecular-weight phenolic acids only HVA showed chelating activity being lower than noted for RU and Q. The 3,4-DHPAA and 3-HPAA were not able to iron(II) – chelation higher than 3%.
3.2. Inhibitory activity of Ru, Q and their phenolic metabolites against formation of AGEs
The data on the inhibitory activity of Ru, Q and their phenolic metabolites against formation of AGEs in a model system are compiled in Table 1. The inhibitory activity of Ru was higher by 31 and 77 % as compared to that of AG in BSA/glucose and BSA/MGO model systems, respectively. AG (a hydrazine compound) is a representative drug, which prevents AGEs formation by trapping intermediates at the initial glycation stages [27]. The inhibitory activity of Q was slightly lower as compared to that of Ru. Amongst low molecular weight metabolites, 3,4-DHPAA showed the highest inhibitory activity, being even higher by 12% and 48% as compared to AG in BSA/glucose and BSA/MGO model systems. The 3-HPAA and HVA showed 2-fold lower inhibitory activity as compared to that of 3,4-DHPAA in BSA/glucose system while almost 20-fold lower in BSA/MGO model system. In general, the rank of the inhibitory activity of the investigated compounds in BSA/glucose and BSA/MGO model systems was as follows: Ru ˃ Q ˃ 3,4-DHPAA ˃ AG ˃ 3-HPAA ˃ HVA. The results provided in both models were highly correlated (r = 0.99). The inhibitory activity of Ru, Q and their low molecular weight metabolites against formation of AGEs in BSA/glucose and BSA/MGO model systems were highly correlated with their DPPH RSA values (r= 0.95 and r= 0.97, respectively) and their Epa (r= −0.82 and r= −0.86, respectively). A weak positive correlation was observed between the inhibitory activity against AGEs formation and FRAP values (r ˂ 0.43), reducing activity by CV (r ˂ 0.58) and chelating activity (r ˂ 0.40).
3.3. PGE2 production
In this study we investigated the ability of Ru and Q, to ameliorate the IL-1β-induced production of PGE2. The exposure of the myofibroblasts to IL-1β (1 ng/mL) induced an increase of the release of PGE2 to the culture medium (p < 0.001; Figure 3). Co-treatment with Ru attenuated the IL-1β-induced release of PGE2 at 50 (19% reduction), 10 (27% reduction) and 1 μM (40% reduction; p < 0.05). As expected, 50 and 10 μM of Q, a well-known inhibitor of COX-2 activity [28], caused a statistically significantly (P < 0.001) reduction of the level of PGE2 at both concentrations. To discard that these effects might be due to cytotoxicity, we determined whether these compounds affected the viability of these cells at 50 μM for 24 h by MTT as previously described [29]. None of the compounds investigated caused cytotoxicity indicating that the effects observed were not due to a decrease in cell viability (data not shown).
Figure 3.
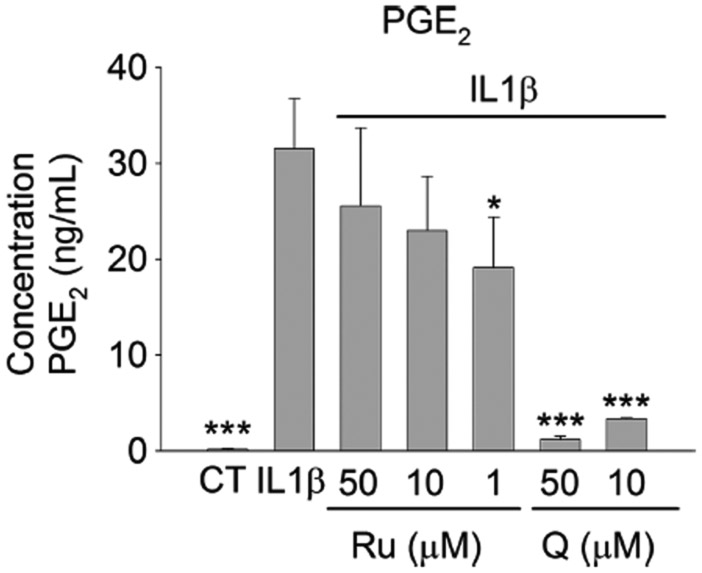
Concentration of PGE2 measured in culture medium after exposure myofibroblasts of colon CCD-18Co to IL-1b (1 ng/mL) and Ru (1 – 50 μM) or Q (10 – 50 μM) for 24 h. Data are presented as mean ± SD of three independent experiments (n=3). Symbols indicate: * P < 0.05; *** P < 0.001.
3.4. COX-2 protein expression
To determine whether the reduction of PGE2 observed in the group of cells exposed to Ru and IL-1β was associated with a downregulation in the expression of COX-2, we investigated the effect of this compound on the expression of this enzyme. COX-2 was not detected in the control group, whereas a remarkable increase was observed in the group of the cells exposed to IL-1β. Exposure to Ru lowered the expression of COX-2 at 50 (19.53% reduction), 10 (27.68% reduction) and 1 μM (50.23% of reduction), although this reduction was only significant (P < 0.05) at 1 μM (Figure 4). Q (50 μM), used as positive control, exerted a strong inhibition of COX-2 expression (83.61%; P < 0.05).
Figure 4.
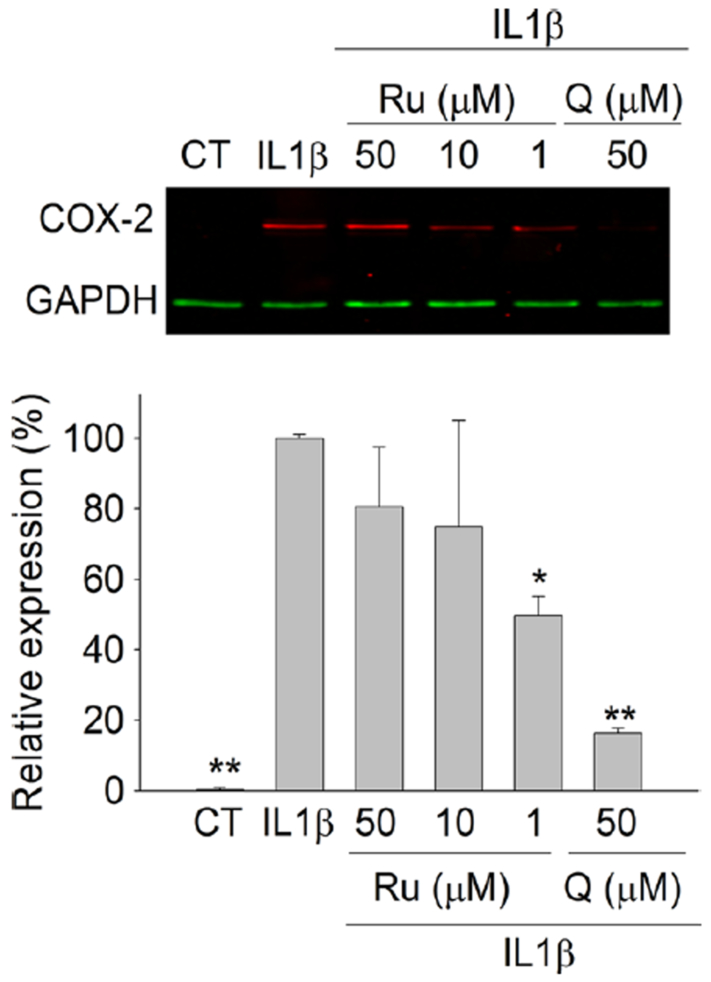
Analysis by western blot of COX-2 expression in myofibroblasts of colon CCD-18Co after exposure to IL-1β (1 ng/mL) and Ru (1 – 50 μM) or Q (10 – 50 μM) for 24 h. The COX-2 expression in control and treated cells was normalized to GAPDH and expressed as percent of the IL-1β-treated group (set as 100% of expression). Results are displayed as the mean ± SD of three independent experiments (n=3). Symbols indicate differences in comparison with the IL-1β-treated group: * P< 0.05; ** P < 0.01. The upper image illustrates the effect of Ru and Q on the expression of COX-2 in IL-1β-stimulated cells.
3.5. IL-8, IL-6, MCP-1 and ICAM-1 production
We next investigated the effect of Ru and Q on the production of different molecules involved in the regulation of the inflammatory response (Figure 5). Our results show that IL-1β stimulation increased the level of IL-8, IL-6, MCP-1, and ICAM-1 in a significant manner (P < 0.001). Ru attenuated the effect of IL-1β on the expression of IL-8 at the concentrations investigated. 50 μM of Ru down-regulated IL-8 release a 24.14%, whereas 10 and 1 μM reduced IL-8 level 49.55% (P < 0.05) and 39.93%, respectively. Ru had no effect at the concentrations investigated on the production of IL-6, MCP-1 and ICAM-1 in IL-1β-inflammed myofibroblasts. Q only was able to reduce the production of IL-8 (60.81%; P < 0.05), and MCP-1 (62.24%; P < 0.05) at 50 μM. At this concentration, Q also caused a slight but non-significant (P > 0.05) reduction of IL-6 (22.94%).
Figure 5.
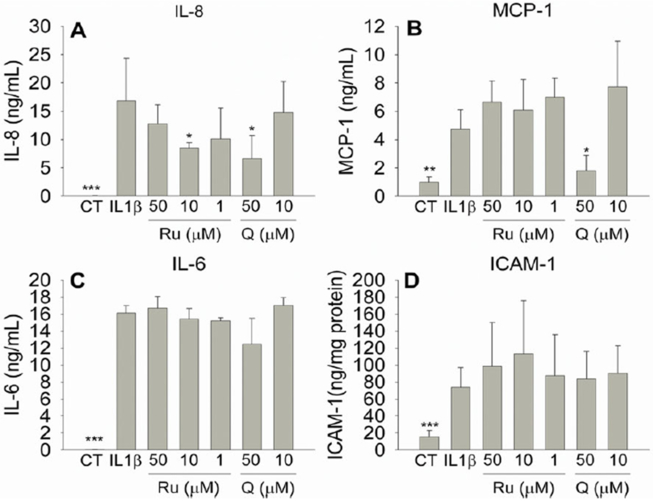
Concentration of chemokines (IL-8, MCP-1), cytokines (IL-6) and adhesion proteins (ICAM-1) in culture medium measured by ELISA. Myofibroblasts of colon CCD-18Co were exposed to IL-1β (1 ng/mL) and Ru (1 – 50 μM) or Q (10 – 50 μM) for 24 h. (A,B) Concentration of the chemokines, IL-8 and MCP-1, released to the culture medium after exposure to IL-1β and Ru or Q; (C) concentration of the citokyne IL-6 released to the culture medium after exposure to IL-1β and Ru or Q; (D) expression of the adhesion protein ICAM-1 in cells exposed to IL-1β and Ru or Q. Results are displayed as the mean ± SD of three independent experiments (n=3). Symbols indicate differences in comparison with the IL-1β-treated group: * P< 0.05; ** P < 0.01: *** P < 0.001.
4. Discussion
In this study, Ru and Q showed powerful antioxidant and reducing activity. The data obtained confirmed our previous studies regarding the antioxidant properties of these compounds [30, 31]. It was well evidenced that properties of these compounds were closely related to the free hydroxyl group in the C ring of these compounds. 3,4-DHPAA displayed similar antioxidant activity to that observed for Ru, and higher than that reported for HVA and 3-HPAA, thus indicating that the antioxidant properties of these compounds are mostly dependent on the free hydroxyl group forming catecholic set in the B ring of these compounds [32]. The phenolic metabolites of Ru showed a hierarchy of antioxidant and reducing activity as follows: 3,4-DHPAA ˃ HVA ˃ ˃ 3-HPAA. This order is in agreement with the data reported by Dueñas et al. [33]. They showed that 3,4-DHPAA and HVA behaved as relatively good antioxidants in both ABTS and FRAP assays. The first one has consistently been described as a major metabolite from the colonic degradation of Ru and Q. Regarding the chelating activity, Ru was the most effective compound followed by Q. Among the phenolic metabolites, only HVA was able to show any effect, which may be associated with its reducing activity (highest FRAP and CV values). Biologically, iron(II) – chelation may render important antioxidant effects by retarding metal-catalyzed oxidation [34], thus indicating that Ru, Q and HVA may afford protection against oxidative damage by removing iron (II) that may otherwise participate in hydroxyl radicals (HO•) generating Fenton type reactions.
Glycation is a non-enzymatic condensation reaction between reducing sugars and amino groups of proteins that undergo rearrangements to stable ketoamines, thus leading to the formation of AGEs including fluorescent and non-fluorescent protein adducts and protein cross-links [35]. AGEs are formed via protein glycation and correlate with processes resulting in aging and diabetes complications [36]. Inhibition of AGEs formation prevents the development of chronic diseases [37]. Several mechanisms have been proposed to inhibit the formation of AGEs, including scavenging hydroxyl and superoxide radicals, metal ion chelation or trapping of reactive dicarbonyl especies such asMGO [38]. BW is known as an important source of phenolic antioxidants including Ru, one of the most potent natural, plant-derived inhibitors of AGEs [12]. Thus, the dietary intake of flavonoids may reasonably offer effective protection through their antioxidant, reducing and chelating activity. Besides, Ru, Q and their phenolic metabolites can protect against glucose- and MGO-induced protein damage inasmuch as equimolar concentrations of Ru metabolites are effective inhibitors of reactive carbonyl species (RCS) - induced protein damage [39]. The estimation of MGO plasma levels in humans is in the range 0.3–1.5 μmol/L range, and its concentrations are higher in types 1 and 2 diabetes and chronic renal failure [40-42]. Pharmacokinetic studies in healthy volunteers have reported plasma level of quercetin equivalents of 1.65 μM (0.6 _g/mL) [43], although this concentration has been reported to reach 6.78 μM (2.05 mg/mL) in animals fed BW extract [44]. Moreover, up to 50% of an ingested dose of the 75 mg Ru was recovered as microbial metabolites from urine of human volunteers [45], further supporting the appearance of μmol/L metabolite concentrations after Ru consumption. We investigated the inhibitory activity of Ru, Q, 3,4-DHPAA, 3-HPAA and HVA in BSA/glucose and BSA/MGO model systems. The range of the inhibitory activity of the investigated compounds in BSA/glucose and BSA/MGO model systems was as follows: Ru ˃ Q ˃ 3,4-DHPAA ˃ AG ˃ 3-HPAA ˃ HVA. This finding was in agreement with recent report provided by Pashikanti et al. [39]. They showed that 3,4-DHPAA was very potent in suppressing the formation of fluorescent derivatives induced by ADP-ribose glycation of histone H1 whilst 3-HPAA and HVA were not effective in suppressing the fluorescence. These authors associated this effect of 3,4-DHPAA to the presence of a vicinal group in its structure. Therefore, among Ru metabolites only 3,4-DHPAA can be considered as a potent glycation inhibitor compared with AG.
BW consumption has been recently proposed as a method to reduce intestinal inflammation and enhance intestinal health [46]. With a view to elucidating which compounds are behind these beneficial effects, in this study we also examined the effects of Ru, Q, and their phenolic metabolites (HVA, 3-HPAA and 3,4-DHPAA) on the production of molecules involved in the regulation of the inflammatory response and the expression of COX-2 in a non-cancerous intestinal cell model.
Myofibroblasts of colon are a cell line placed in the lamina propia of the intestinal wall. Although these cells are not directly exposed to the lumen content, inflammation generates alteration of the intestinal permeability, thus favoring the contact between the molecules (i.e., flavonoids) of the lumen and subephitelial cells, including myofibroblasts [47].
Intestinal fibroblasts play an essential role in the modulation of the inflammatory response by producing inflammatory mediators such as PGE2 [48]. Ru and Q exhibited ability to reduce the concentration of PGE2 in myofibroblasts of colon CCD-18Co exposed to IL-1β. González-Sarrías et al. [49] reported that Q was able to reduce the IL-1β-induced PGE2 production in the same cell line used in this study at 10 μM but not 1 μM. In this study, Q showed ability to reduce PGE2 production at concentrations from 10 to 50 μM (Figure 3). Like Q, Ru also attenuated the effect of IL-1β in the production of PGE2. Quite unexpectedly, 1 μM of Ru, a concentration that can be achieved in vivo [50], exerted higher reduction of the PGE2 level than that observed at 10 and 50 μM (Figure 3). Dietary polyphenols can display hormetic response, exhibiting beneficial effects at low doses, whereas higher concentrations may have no effect or affect negatively [51, 52]. Studies by Gautam et al. [53] reported that the high level of the pro-inflammatory cytokine IL-2 (671.93 pg/mL ± 56.65) in animals fed with a methotrexate-supplemented diet was reduced to a greater extent in the group that consumed 50 mg/kg of Ru (233.52 pg/mL ± 14.69) in comparison to the group fed with 100 mg/kg (272.02 pg/mL ± 15.00).
COX-2 is a protein that is overexpressed at the intestinal level in inflammatory conditions, determining the production of PGE2 [54]. The inhibition of COX-2 expression through the diet can help attenuate the undesirable effects of high levels of PGE2 [54]. Thus, we further investigated whether the effects of Ru and Q on PGE2 production were mediated by modulating COX-2 expression. Since the role of Q as COX-2 inhibitor has been previously described [28], we used a concentration of 50 μM as positive control. Thus, Q at 50 μM down-regulated the expression of COX-2 in IL-1β-stimulated cells. Ru was also able to reduce the IL-1β-induce expression at the concentrations investigated. Again, the lowest concentration of 1 μM was the most effective reducing the COX-2 expression (Figure 4). The inhibition of COX-2 expression by Ru (163.8 μM) has been previously reported in macrophages [49]. Therefore, the reduction in the concentration of PGE2 was correlated with a down-regulation in the expression of COX-2. However, other mechanisms such as the inhibition of COX-2 activity by Ru may also be involved [47].
Chemokines (IL-8 and MCP-1), cytokines (IL-6) as well as adhesion proteins (ICAM-1) are important molecules released by IL-1β-exposed intestinal myofibroblasts during intestinal inflammation [56]. Cells co-treated with Ru (1 – 50 μM) and IL-1β showed lower concentrations of IL-8 than the inflamed cells. Ru did not show dose-dependent effect. This lack of dose-dependent response has been previously observed for other flavonoids such as flavanones [57]. Q at 50 μM (but not at 10 μM) reduced the expression of the chemokines IL-8 and MCP-1, but exerted no effect on the expression of IL-6 and ICAM-1 (Figure 5). These results are in agreement with previous in vitro and in vivo studies describing that Ru, Q and/or extracts rich in both polyphenols may exert their anti-inflammatory effects by modulation of chemokine production [58-60].
The microbial phenolic metabolites of Ru and Q (HVA, 3-HPAA and 3,4-DHPAA) had no effect on the expression of the molecules investigated under the conditions of our study (data not shown). The lack of activity of these compounds in IL-1β-exposed myofibroblasts of colon CCD-18Co has also been observed in previous studies, where rather high concentrations (100 μM) were unable to reduce the production of PGE2 [20].
5. Concluding remarks
Ru (quercetin–rutinoside), the main BW flavonoid, is hydrolyzed by the gut microbiota leading to the formation of its aglycone Q or its phenol derivatives, including 3,4-DHPAA, 3-HPAA and HVA. Ru and Q showed the highest antioxidant, reducing and chelating activity, which could contribute to inhibit the AGEs formation. Besides, these compounds showed the highest anti-inflammatory activity by modulation of PGE2, IL-8, and MCP-1. 3,4-DHPAA, 3-HPAA and HVA showed differential antioxidative, reducing and chelating activity. The 3,4-DHPAA was the most significant metabolite due to the highest antioxidative and reducing activity. Its possible antioxidant mechanism via metal chelation and restriction of the accessibility of the metal ion for participation in Fenton-type reactions seems to be negligible due to the very low chelating activity. Among Ru metabolites, the only 3,4-DHPAA can be considered as a nontoxic, potent glycation inhibitor compared with AG.
Figure 1.
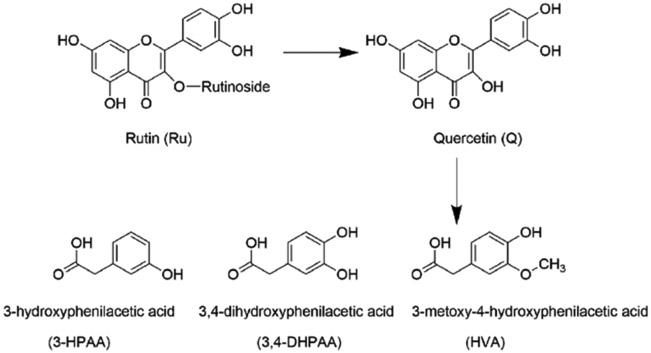
Structures of rutin (Ru), quercetin (Q), 3,4-dihydroxyphenylacetic acid (3,4-DHPAA), 3-hydroxyphenylacetic acid (3-HPAA) and homovanillic acid (HVA).
Acknowledgment
We gratefully acknowledge research grant No. 5056/B/P01/2011/40 from the National Science Center, Poland and project REFRESH (FP7-REGPOT-2010–1-264105) – Unlocking the potential of the Institute of Animal Reproduction and Food Research for strengthening integration with the European Research Area and region development. Project financed in the area of “Research Potential” of the 7th Framework Programme. J.A.G.-B. is supported by a postdoctoral award from the American Heart Association (16POST30690001).
Abbreviations:
- BW
buckwheat
- CV
cyclic voltammetry
- 3,4-DHPAA
3,4-dihydroxyphenylacetic acid
- DPPH RSA
DPPH Radical Scavenging Activity
- 3-HPAA
3-hydroxyphenylacetic acid
- FZ
ferrozine
- FBS
fetal bovine serum
- FRAP
ferric reducing/antioxidant power
- HVA
homovanillic acid (4-hydroxy-3-methoxyphenylacetic acid)
- MGO
methylglyoxal
- PDL
population doubling level
- Q
quercetin
- RCS
reactive carbonyl species
- Ru
rutin
Footnotes
Conflict of interest
The authors declare no competing financial interest.
References
- [1].Espin JC, Garcia-Conesa MT, Tomas-Barberan FA, Nutraceuticals: facts and fiction. Phytochemistry 2007, 68, 2986–3008. [DOI] [PubMed] [Google Scholar]
- [2].Zhang ZL, Zhou ML, Tang Y, Li FL et al. , Bioactive compounds in functional buckwheat food. Food Res. Int. 2012, 49, 389–395. [Google Scholar]
- [3].Krkoskova B, Mrazova Z, Prophylactic components of buckwheat. Food Res. Int. 2005, 38, 561–568. [Google Scholar]
- [4].Zielinska D, Zielinski H, Low molecular weight antioxidants and other biologically active components of buckwheat seeds. EJPSB 2009, 3, 29–38. [Google Scholar]
- [5].Caillet S, Yu HL, Lessard S, Lamoureux G et al. , Fenton reaction applied for screening natural antioxidants. Food Chem. 2007, 100, 542–552. [Google Scholar]
- [6].Jiang P, Burczynski F, Campbell C, Pierce G et al. , Rutin and flavonoid contents in three buckwheat species Fagopyrum esculentum, F-tataricum, and F-homotropicum and their protective effects against lipid peroxidation. Food Res. Int. 2007, 40, 356–364. [Google Scholar]
- [7].Jacobs DM, Gaudier E, van Duynhoven J, Vaughan EE, Non-digestible food ingredients, colonic microbiota and the impact on gut health and immunity: a role for metabolomics. Curr. Drug Metab. 2009, 10, 41–54. [DOI] [PubMed] [Google Scholar]
- [8].Aura AM, Microbial metabolism of dietary phenolic compounds in the colon. Phytochem Rev. 2008, 7, 407–429. [Google Scholar]
- [9].Aura AM, O’Leary KA, Williamson G, Ojala M et al. , Quercetin derivatives are deconjugated and converted to hydroxyphenylacetic acids but not methylated by human fecal flora in vitro. J. Agric. Food Chem. 2002, 50, 1725–1730. [DOI] [PubMed] [Google Scholar]
- [10].Olthof MR, Hollman PCH, Buijsman MNCP et al. , Chlorogenic acid, quercetin-3-rutinoside and black tea phenols are extensively metabolized in humans. J. Nutr. 2003, 133, 2692–2692. [DOI] [PubMed] [Google Scholar]
- [11].Serra A, Macia A, Romero MP, Reguant J et al. , Metabolic pathways of the colonicmetabolism of flavonoids (flavonols, flavones and flavanones) and phenolic acids. Food Chem. 2012, 130, 383–393. [Google Scholar]
- [12].Cervantes-Laurean D, Schramm DD, Jacobson EL, Halaweish I et al. , Inhibition of advanced glycation end product formation on collagen by rutin and its metabolites. J. Nutr. Biochem. 2006, 17, 531–540. [DOI] [PubMed] [Google Scholar]
- [13].Hopia A, Heinonen M, Antioxidant activity of flavonol aglycones and their glycosides in methyl linoleate. J. Am. Oil Chem. Soc. 1999, 76, 139–144. [Google Scholar]
- [14].Kwon KH, Murakami A, Tanaka T, Ohigashi H, Dietary rutin, but not its aglycone quercetin, ameliorates dextran sulfate sodium-induced experimental colitis in mice: attenuation of pro-inflammatory gene expression. Biochem. Pharmacol. 2005, 69, 395–406. [DOI] [PubMed] [Google Scholar]
- [15].Comalada M, Camuesco D, Sierra S, Ballester I et al. , In vivo quercitrin anti-inflammatory effect involves release of quercetin, which inhibits inflammation through downregulation of the NF-kappaB pathway. Eur. J. Immunol. 2005, 35, 584–592. [DOI] [PubMed] [Google Scholar]
- [16].Russell W, Duthie G, Plant secondary metabolites and gut health: the case for phenolic acids. P. Nutr. Soc. 2011, 70, 389–396. [DOI] [PubMed] [Google Scholar]
- [17].Wiczkowski W, Nemeth K, Bucinski A, Piskula M, Bioavailability of quercetin from flesh scales and dry skin in rats. P. J. Food Nutr. Sci. 2003, 12, 95–99. [Google Scholar]
- [18].Franke AA, Custer LJ, Arakaki C, Murphy SP, Vitamin C and flavonoid levels of fruits and vegetables consumed in Hawaii. J. Food Compos. Anal. 2004, 17, 1–35. [Google Scholar]
- [19].Brand Williams W, Cuvelier ME, Berset C, Use of a Free-Radical Method to Evaluate Antioxidant Activity. Food Sci. Technol-Leb. 1995, 28, 25–30. [Google Scholar]
- [20].Zielinska D, Zielinski H, Antioxidant activity of flavone C-glucosides determined by updated analytical strategies. Food Chem. 2011, 124, 672–678. [Google Scholar]
- [21].Benzie IFF, Strain JJ, Ferric reducing antioxidant power assay: Direct measure of total antioxidant activity of biological fluids and modified version for simultaneous measurement of total antioxidant power and ascorbic acid concentration. Method Enzymol. 1999, 299, 15–27. [DOI] [PubMed] [Google Scholar]
- [22].Mladenka P, Zatloukalova L, Filipsky T, Hrdina R, Cardiovascular effects of flavonoids are not caused only by direct antioxidant activity. Free Radical Bio. Med. 2010, 49, 963–975. [DOI] [PubMed] [Google Scholar]
- [23].Szawara-Nowak R, Koutsidis G, Wiczkowski W, Zielinski H, Evaluation of the in vitro inhibitory effects of buckwheat enhanced wheat bread extracts on the formation of advanced glycation end-products (AGEs). LWT-Food Sci. Tech 2014, 58, 327–334. [Google Scholar]
- [24].Kim EC, Zhu Y, Andersen V, Sciaky D et al. , Cytokinemediated PGE2 expression in human colonic fibroblasts. Am. J. Physiol. 1998, 275, C988–C994. [DOI] [PubMed] [Google Scholar]
- [25].Larrosa M, Luceri C, Vivoli E, Pagliuca C et al. , Polyphenol metabolites from colonic microbiota exert anti-inflammatory activity on different inflammation models. Mol. Nutr. Food Res. 2009, 53, 1044–1054. [DOI] [PubMed] [Google Scholar]
- [26].Antolovich M, Prenzler PD, Patsalides E, McDonald S et al. , Methods for testing antioxidant activity. Analyst 2002, 127, 183–198. [DOI] [PubMed] [Google Scholar]
- [27].Thornalley PJ, Use of aminoguanidine (Pimagedine) to prevent the formation of advanced glycation end products. Arch. Biochem. Biophys. 2003, 419, 31–40. [DOI] [PubMed] [Google Scholar]
- [28].Mutoh M, Takahashi M, Fukuda K, Matsushima-Hibiya Y et al. , Suppression of cyclooxygenase-2 promoter dependent transcriptional activity in colon cancer cells by chemopreventive agents with a resorcin-type structure. Carcinogenesis 2000, 21, 959–963. [DOI] [PubMed] [Google Scholar]
- [29].Sargent JM, The use of the MTT assay to study drug resistance in fresh tumour samples. Recent Results Cancer. Res. 2003, 161, 13–25. [DOI] [PubMed] [Google Scholar]
- [30].Zielinska D, Pierozynski B, Electrooxidation of quercetin at glassy carbon electrode studied by a.c. impedance spectroscopy. J. Electroanal. Chem. 2009, 625, 149–155. [Google Scholar]
- [31].Zielinska D, Szawara-Nowak D, Zielinski H, Determination of the antioxidant activity of rutin and its contribution to the antioxidant capacity of diversified buckwheat origin material by updated analytical strategies. Pol. J. Food Nutr. Sci. 2010, 60, 315–321. [Google Scholar]
- [32].Balasundram N, Sundram K, Samman S, Phenolic compounds in plants and agri-industrial by-products: Antioxidant activity, occurrence, and potential uses. Food Chem. 2006, 99, 191–203. [Google Scholar]
- [33].Dueñas M, Surco-Laos F, Gonzalez-Manzano S, Gonzalez-Paramas AM, Santos-Buelga C, Antioxidant properties of major metabolites of quercetin. Eur. Food Res. Technol. 2011, 232, 103–111. [Google Scholar]
- [34].Kehrer JP, The Haber-Weiss reaction and mechanisms of toxicity. Toxicology 2000, 149, 43–50. [DOI] [PubMed] [Google Scholar]
- [35].Mapanga RF, Essop MF, Damaging effects of hyperglycemia on cardiovascular function: spotlight on glucose metabolic pathways. Am. J. Physiol. Heart Circ. Physiol. 2016, 310, H153–H173. [DOI] [PubMed] [Google Scholar]
- [36].Yamagishi SI, Nakamura N, Matsui T, Glycation and cardiovascular disease in diabetes: a perspective on the concept of metabolic memory. J. Diabetes 2016. doi: 10.1111/1753-0407.12475. [DOI] [PubMed] [Google Scholar]
- [37].Sampath C, Zhu Y, Sang S, Ahmedna M, Bioactive compounds isolated from apple, tea, and ginger protect against dicarbonyl induced stress in cultured human retinal epithelial cells. Phytomedicine 2016, 23, 200–213. [DOI] [PubMed] [Google Scholar]
- [38].Peng X, Ma J, Chen F, Wang M, Naturally occurring inhibitors against the formation of advanced glycation endproducts. Food Funct. 2011, 2, 289–301. [DOI] [PubMed] [Google Scholar]
- [39].Pashikanti S, de Alba DR, Boissonneault GA, Cervantes-Laurean D, Rutinmetabolites: novel inhibitors of nonoxidative advanced glycation end products. Free Radic. Biol. Med. 2010, 48, 656–663. [DOI] [PubMed] [Google Scholar]
- [40].Agalou S, Ahmed N, Dawnay A, Thornalley PJ, Removal of advanced glycation end products in clinical renal failure by peritoneal dialysis and haemodialysis. Biochem. Soc. Trans. 2003, 31, 1394–1396. [DOI] [PubMed] [Google Scholar]
- [41].Akhand AA, Hossain K, Kato M, Miyata T et al. , Glyoxal and methylglyoxal induce lyoxal and methyglyoxal induce aggregation and inactivation of ERK in human endothelial cells. Free Radic. Biol. Med. 2001, 31, 1228–1235. [DOI] [PubMed] [Google Scholar]
- [42].Lapolla A, Flamini R, Dalla Vedova A, Senesi A et al. , Glyoxal and methylglyoxal levels in diabetic patients: quantitative determination by a new GC/MS method. Clin. Chem. Lab. Med. 2003, 41, 1166–1173. [DOI] [PubMed] [Google Scholar]
- [43].Graefe EU, Wittig J, Mueller S, Riethling AK et al. , Pharmacokinetics and bioavailability of quercetin glycosides in humans. J. Clin. Pharmacol. 2001, 41, 492–499. [DOI] [PubMed] [Google Scholar]
- [44].Zhao G, Zou L, Wang Z, Hu H et al. , Pharmacokinetic profile of total quercetin after single oral dose of tartary buckwheat extracts in rats. J. Agric. Food Chem. 2011, 59, 4435–4441. [DOI] [PubMed] [Google Scholar]
- [45].Sawai Y, Kohsaka K, Nishiyama Y, Ando K, Serum concentrations of rutoside metabolites after oral administration of a rutoside formulation to humans. Arzneimittel-Forschung. 1987, 37, 729–732. [PubMed] [Google Scholar]
- [46].Liu L, Cai X, Yan J, Luo Y et al. , In vivo and in vitro antinociceptive effect of fagopyrum cymosum (trev.) meisn extracts: a possible action by recovering intestinal barrier dysfunction. Evid. Based Complement. Alternat. Med 2012, 983801. [DOI] [PMC free article] [PubMed] [Google Scholar]
- [47].Andoh A, Bamba S, Brittan M, Fujiyama Y, Wright NA, Role of intestinal subepithelial myofibroblasts in inflammation and regenerative response in the gut. Pharmacol Therapeut. 2007, 114, 94–106. [DOI] [PubMed] [Google Scholar]
- [48].Rieder F, Georgieva M, Schirbel A, Artinger M et al. , Prostaglandin E2 inhibits migration of colonic lamina propria fibroblasts. Inflamm. Bowel Dis. 2010, 16, 1505–1513. [DOI] [PubMed] [Google Scholar]
- [49].Gonzalez-Sarrias A, Larrosa M, Tomas-Barberan FA, Dolara P et al. , NF-kappaB-dependent anti-inflammatory activity of urolithins, gut microbiota ellagic acid-derived metabolites, in human colonic fibroblasts. Br. J. Nutr. 2010, 104, 503–512. [DOI] [PubMed] [Google Scholar]
- [50].Manach C, Morand C, Demigne C, Texier O et al. , Bioavailability of rutin and quercetin in rats. FEBS Lett. 1997, 409, 12–16. [DOI] [PubMed] [Google Scholar]
- [51].Calabrese EJ, Baldwin LA, Holland CD, Hormesis: a highly generalizable and reproducible phenomenon with important implications for risk assessment. Risk Anal. 1999, 19, 261–281. [DOI] [PubMed] [Google Scholar]
- [52].Calabrese EJ, Mattson MP, Calabrese V, Resveratrol commonly displays hormesis: occurrence and biomedical significance. Hum. Exp. Toxicol. 2010, 29, 980–1015. [DOI] [PubMed] [Google Scholar]
- [53].Gautam R, Singh M, Gautam S, Rawat JK, et al. , Rutin attenuates intestinal toxicity induced by Methotrexate linked with anti-oxidative and anti-inflammatory effects. BMCComplement Altern. Med. 2016, 16, 99. [DOI] [PMC free article] [PubMed] [Google Scholar]
- [54].Chell S, Kaidi A, Williams AC, Paraskeva C, Mediators of PGE2 synthesis and signalling downstream of COX-2 represent potential targets for the prevention/treatment of colorectal cancer. Biochim. Biophys. Acta 2006, 1766, 104–119. [DOI] [PubMed] [Google Scholar]
- [55].Karki R, Park CH, Kim DW, Extract of buckwheat sprouts scavenges oxidation and inhibits pro-inflammatory mediators in lipopolysaccharide-stimulated macrophages (RAW264.7). J. Integr. Med. 2013, 11, 246–252. [DOI] [PubMed] [Google Scholar]
- [56].Gimenez-Bastida JA, Larrosa M, Gonzalez-Sarrias A, Tomas-Barberan F et al. , Intestinal ellagitannin metabolites ameliorate cytokine-induced inflammation and associated molecular markers in human colon fibroblasts. J. Agric. Food Chem. 2012, 60, 8866–8876. [DOI] [PubMed] [Google Scholar]
- [57].Chanet A, Milenkovic D, Claude S, Maier JA et al. , Flavanone metabolites decreasemonocyte adhesion to TNFalpha-activated endothelial cells by modulating expression of atherosclerosis-related genes. Br. J. Nutr. 2013, 110, 587–598. [DOI] [PubMed] [Google Scholar]
- [58].Das T, Mukherjee S, Chaudhuri K, Effect of quercetin on Vibrio cholerae induced nuclear factor-kappaB activation and interleukin-8 expression in intestinal epithelial cells. Microbes Infect. 2012, 14, 690–695. [DOI] [PubMed] [Google Scholar]
- [59].Sangiovanni E, Di Lorenzo C, Colombo E, Colombo F et al. , The effect of in vitro gastrointestinal digestion on the anti-inflammatory activity of Vitis vinifera L. leaves. Food Func. 2015, 6, 2453–2463. [DOI] [PubMed] [Google Scholar]
- [60].Vezza T, Rodriguez-Nogales A, Algieri F, Utrilla MP et al. , Flavonoids in inflammatory bowel disease: a review. Nutrients 2016, 8. [DOI] [PMC free article] [PubMed] [Google Scholar]