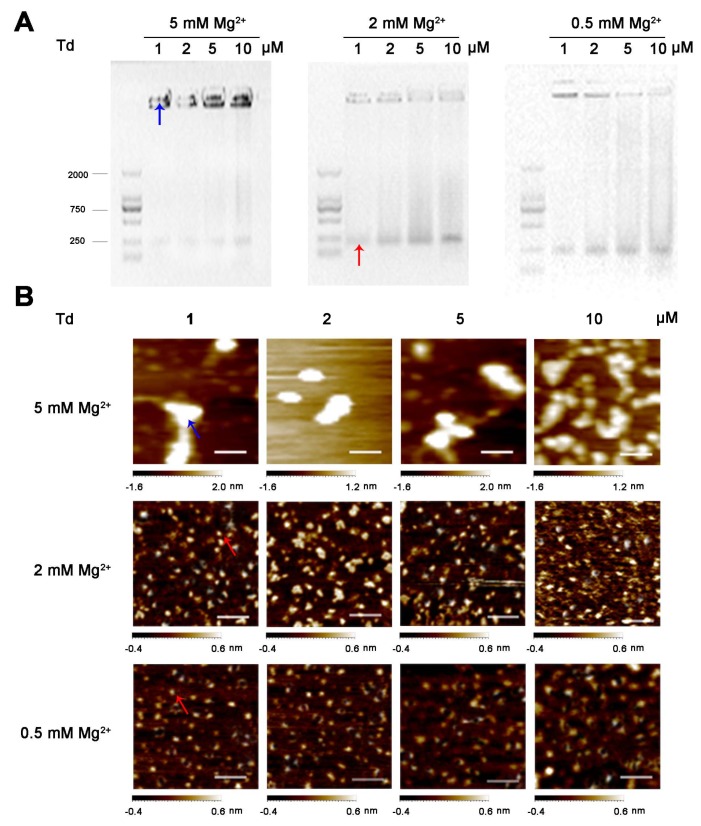
Figure 5.
The influence of the lyophilization process on the stability of the Td structure. (A) Agarose gel and (B) AFM images of re-dissolved freeze-drying powders of 1, 2, 5 or 10 μM Td, prepared in buffers containing 5, 2 or 0.5 mM Mg2+. Scale bars: 100 nm. Red and blue arrows represented Td and aggregated DNA, respectively.

