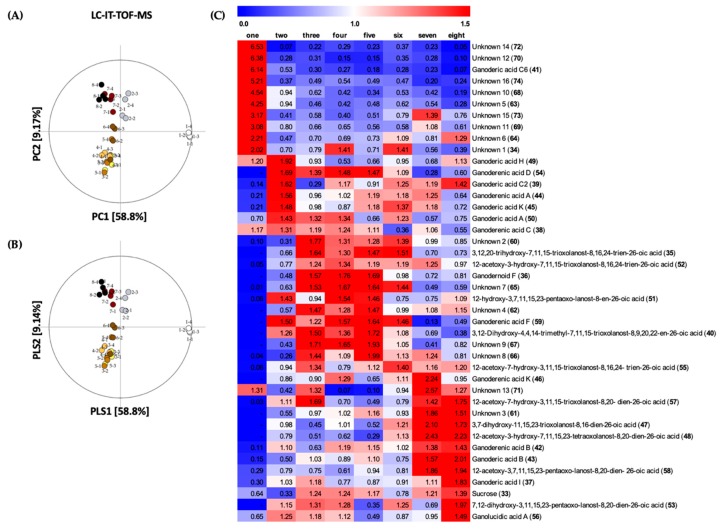
Figure 3.
(A) PCA and (B) PLS-DA score plot of each G. lingzhi samples at the eight developmental stages analyzed by LC/IT-TOF-MS; (C) Heat maps of significantly different metabolites at the eight developmental stages of G. lingzhi from LC/IT-TOF-MS analysis. Each column represents the developmental stage, and the fold change of average peak area denoted by the number and color of heat scale.

