

Abstract
Detection of frequency modulation (FM) with rate = 10 Hz may depend on conversion of FM to amplitude modulation (AM) in the cochlea, while detection of 2-Hz FM may depend on the use of temporal fine structure (TFS) information. TFS processing may worsen with greater age and hearing loss while AM processing probably does not. A two-stage experiment was conducted to test these ideas while controlling for the effects of detection efficiency. Stage 1 measured psychometric functions for the detection of AM alone and FM alone imposed on a 1-kHz carrier, using 2- and 10-Hz rates. Stage 2 assessed the discrimination of AM from FM at the same modulation rate when the detectability of the AM alone and FM alone was equated. Discrimination was better for the 2-Hz than for the 10-Hz rate for all young normal-hearing subjects and for some older subjects with normal hearing at 1 kHz. Other older subjects with normal hearing showed no clear difference in AM-FM discrimination for the 2- and 10-Hz rates, as was the case for most older hearing-impaired subjects. The results suggest that the ability to use TFS cues is reduced for some older people and most hearing-impaired people.
Keywords: modulation-type discrimination, hearing loss, aging, frequency modulation, amplitude modulation
Introduction
The detection of frequency modulation (FM) of a sinusoidal carrier may be mediated by two mechanisms: (a) The FM is converted into amplitude modulation (AM) via the filtering that occurs in the cochlea and the AM is then detected as a fluctuation in neural firing rate over time or via phase locking to the envelope (Paraouty, Stasiak, Lorenzi, Varnet, & Winter, 2018; Zwicker, 1956); (b) The FM leads to changes over time in the temporal fine structure (TFS) of the waveform evoked on the basilar membrane and the corresponding pattern of action potentials in the auditory nerve (Rose, Brugge, Anderson, & Hind, 1967) and ventral cochlear nucleus (Paraouty et al., 2018), and detection of FM depends on detection of these changes over time. For brevity, these mechanisms are referred to here as “FM-to-AM” and “FM-to-TFS.” The mechanism that decodes TFS information may be sluggish and unable to track rapid changes in frequency (Moore & Sek, 1995, 1996; Sek & Moore, 1995). Hence, FM at rates above about 10 Hz may be detected mainly via FM-to-AM, while FM at lower rates may be determined partly by FM-to-TFS (Moore & Sek, 1995, 1996; Sek & Moore, 1995). This is consistent with recent modeling work, which shows that the popular modulation filterbank model (Dau, Kollmeier, & Kohlrausch, 1997a, 1997b) accounts well for a range of data on AM and FM detection and interference effects between AM and FM for modulation rates of 10 Hz and above but does not account well for FM detection at low rates or for interference effects between AM and FM at low rates (Ewert, Paraouty, & Lorenzi, 2018; King, Varnet, & Lorenzi, 2019; Paraouty, Ewert, Wallaert, & Lorenzi, 2016; Wallaert, Varnet, Moore, & Lorenzi, 2018).
There is also evidence that sensitivity to TFS declines with increasing age (Füllgrabe, Moore, & Stone, 2015; Grose & Mamo, 2010; Moore, 2014; Moore, Vickers, & Mehta, 2012; Ross, Fujioka, Tremblay, & Picton, 2007; Wallaert, Moore, & Lorenzi, 2016) and with increasing hearing loss (Hopkins & Moore, 2007, 2011; Hopkins, Moore, & Stone, 2008). However, it is difficult to separate the effects of a reduction in sensitivity to TFS and a more general reduction in proficiency or “processing efficiency,” which refers to the ability to make use of a given amount of sensory information. Processing efficiency may reflect a general auditory ability that affects performance on many tasks. For example, musicians tend to be better than nonmusicians on a wide range of auditory tasks (Micheyl, Delhommeau, Perrot, & Oxenham, 2006; Oxenham, Fligor, Mason, & Kidd, 2003). However, processing efficiency may also vary somewhat from task to task. The main aim of this study was to assess the effects of age and hearing loss on the processing of TFS information using a design that controlled for the general effects of processing efficiency.
Three groups of subjects were tested: young with normal hearing (YNH), older with normal hearing (ONH) at the test carrier frequency of 1000 Hz and older with impaired hearing (OHI) at 1000 Hz. Mean results for the first two groups only were presented in Moore, Mariathasan, and Sek (2018). This article presents individual results for all three groups and compares the results across groups. The design was similar to that used by Demany and Semal (1986), Edwards and Viemeister (1994), and Moore and Sęk (1994b, 1995). The experiment had two stages. Stage 1 measured psychometric functions for the detection of AM alone and FM alone, using 2- and 10-Hz rates. The results were used to select pairs of values of AM and FM (at the same rate) that were equally detectable. Stage 2 assessed the discrimination of AM from FM at the same modulation rate when the AM alone and FM alone were equated in detectability.
If FM is detected solely via FM-to-AM, then in Stage 2, the ability to discriminate AM from FM should be poor. Performance would presumably depend on comparing the phase of the excitation fluctuations on the upper and lower skirts of the excitation pattern; these are in phase for AM and 180° out of phase for FM (Moore & Sek, 1994a; Zwicker, 1956). Discrimination of differences in AM phase in different frequency regions is poor when the modulation depth is small (Green, Richards, & Onsan, 1990), so discrimination of AM from FM should also be poor, especially for modulation depths close to the detection threshold. However, if FM is partly coded via FM-to-TFS, FM should give rise to detectable fluctuations in TFS while AM should not, making it easier to discriminate AM from FM. Since previous evidence suggests that TFS information is used to detect 2-Hz FM but not 10-Hz FM, this leads to the prediction that discrimination of FM from AM should be better for a 2-Hz rate than for a 10-Hz rate, as found by Demany and Semal (1986) and Moore and Sęk (1995) for young subjects with normal hearing. Furthermore, and critically here, if sensitivity to TFS declines with increasing age and with increasing hearing loss, then the difference in AM-FM discrimination between the 2-Hz and 10-Hz rates should be smaller for the ONH than for the YNH subjects and even smaller for the OHI subjects. These predictions were tested here.
Method
Subjects
Three groups of subjects were tested. The 12 YNH subjects, aged 22 to 29 years (mean = 22.5 years, standard deviation [SD] = 3.1 years), all had audiometric thresholds ≤20 dB hearing level (HL) for frequencies from 0.125 to 8 kHz. The 13 ONH subjects, aged 58 to 75 years (mean = 66.7 years, SD = 5.1 dB) all had audiometric thresholds ≤20 dB HL at the test frequency of 1 kHz and below, but some had hearing loss at higher frequencies; audiometric thresholds were above 20 dB HL for four subjects at 3 kHz. Hearing status at high frequencies does not seem to affect sensitivity to TFS at lower frequencies (Füllgrabe & Moore, 2017; Moore, Glasberg, Stoev, Füllgrabe, & Hopkins, 2012), so any difference between the YNH and ONH groups should mainly reflect the effects of age rather than hearing loss. The nine OHI subjects, aged 48 to 68 years (mean = 60.1 years, SD = 5.4 years), had audiometric thresholds between 30 and 48 dB HL at the test frequency of 1 kHz. Their audiograms are shown in Figure 1. The test ear for the YNH subjects was selected randomly; six were tested using the right ear and six using the left. The test ear for the ONH and OHI subjects was selected as the ear with the lower absolute threshold at the test frequency of 1 kHz. Subjects were paid to participate.
Figure 1.

The thin lines show individual audiograms of the test ears of the OHI subjects. The thick continuous line shows the mean audiogram and the thick dashed lines show ±1 SD around the mean.
Stimuli and Procedure
The stimuli and procedure were the same as described by Moore et al. (2018), so only a brief description is given here; the reader is referred to the earlier paper for details. Initially, absolute thresholds at 1 kHz for a 1,000-ms signal were estimated using a two-interval two-alternative forced-choice adaptive procedure. The mean absolute thresholds at 1 kHz were 0.2 dB SPL for the YNH group, 7.6 dB SPL for the ONH group, and 38.3 dB SPL for the OHI group. Based on nonmatched samples t tests, the mean threshold for the ONH group was significantly higher than that for the YNH group (p < .02) and the mean threshold for the OHI group was significantly higher than those for the YNH and ONH groups (both p < .001). The stimuli in the main experiment had a level 30 dB above the measured absolute threshold, that is, 30 dB sensation level (SL). For the ONH group, this relatively low SL limited the spread of excitation of the stimuli to the frequency region where absolute thresholds were within the normal range (frequencies up to 2 kHz). For the OHI group, the use of a low SL ensured that the stimuli would not be uncomfortably loud.
A two-alternative forced-choice task was used for both stages of the main experiment. Feedback indicating the correct answer was given after each trial. Each stimulus had a duration of 1,000 ms, including 20-ms rise/fall ramps. The silent gap between the intervals was 300 ms. The modulator was “quasi-trapezoidal” (Moore & Sek, 1995; Shailer & Moore, 1993), which meant that the time spent at the extremes of amplitude or frequency was longer than for sinusoidal modulation of the same rate. This was intended to promote the use of TFS information, since the mechanism that “decodes” TFS information may be most effective when the TFS is stable over many tens of milliseconds (Moore & Sek, 1995, 1996; Sek & Moore, 1995). For the 2-Hz rate, the time spent at each extreme was 240 ms and the transition between extremes lasted 10 ms. For the 10-Hz rate, the time spent at each extreme was 40 ms and the transition between extremes lasted 10 ms.
Stage 1 measured psychometric functions for the detection of AM alone and FM alone. Five modulation depths were used for each type of modulation and each modulation rate. They were chosen to span the range from poor to very good detectability. At least 50 trials were obtained for each modulation depth. The percent correct score for each modulation depth was converted to the detectability index, d′ (Hacker & Ratcliff, 1979). A straight line, constrained to pass through the origin, was fitted to the d′ values as a function of the square of the modulation index (Moore & Sek, 1995). This line was used to estimate the modulation depths that would be required to give d′ = 1, 1.5, 2, 2.5, and 3, for each subject and type of modulation. These were used as the “input” modulation depths in Stage 2.
Stage 2 assessed the discrimination of equally detectable amounts of AM and FM. In each trial, one interval contained AM and the other contained FM. The subject was instructed to indicate the interval containing the FM (“in which interval does the pitch wobble”). Five input d′ values (1, 1.5, 2, 2.5, and 3) were used for each modulation rate. At least 50 trials were obtained for each input d′.
Results and Discussion
Figure 2 shows the AM and FM depths required for d′ = 1 (“thresholds”), as measured in Stage 1 for each participant and each group. Table 1 shows the mean AM detection thresholds and geometric mean FM detection thresholds for each group.
Figure 2.

The small squares show individual detection thresholds for AM (left) and FM (right) for rates of 2 Hz (filled symbols) and 10 Hz (open symbols). Large symbols at the right of each panel show the mean thresholds (AV). Each row shows results for one group: YNH (top), ONH (middle), and OHI (bottom). FM = frequency modulation; AM = amplitude modulation; YNH = young with normal hearing; ONH = older with normal hearing; OHI = older with impaired hearing.
Table 1.
AM and FM Detection Thresholds (Corresponding to d′ = 1) for Each Group and Each Modulation Rate.
| Group | Modulation type | 2-Hz rate | 10-Hz rate |
|---|---|---|---|
| YNH | AM | −20.9 (3.3) | −22.2 (3.3) |
| ONH | AM | −20.2 (2.9) | −22.8 (3.1) |
| OHI | AM | −24.1 (2.8) | −23.3 (3.2) |
| YNH | FM | 2.3 (0.15) | 2.8 (0.20) |
| ONH | FM | 3.0 (0.10) | 3.3 (0.10) |
| OHI | FM | 4.6 (0.12) | 6.9 (0.11) |
Note. For AM, thresholds are expressed as the arithmetic mean of values of 20log10(m) and numbers in parentheses are SDs. For FM, thresholds are expressed as geometric means of the frequency deviations in Hz, and numbers in brackets are the SD of the log values. FM = frequency modulation; AM = amplitude modulation; YNH = young with normal hearing; ONH = older with normal hearing; OHI = older with impaired hearing.
An analysis of variance (ANOVA) was conducted on the AM thresholds with modulation rate as a within-subject factor and group as a between-subject factor. There was no significant effect of group, but the effect of AM rate was significant, F(1, 31) = 6.39, p = .017, and the interaction of group with AM rate was significant, F(2, 31) = 3.49, p = .043. Post hoc tests using Fisher’s protected least significant difference test (which are also used in the rest of this article) showed that the AM thresholds were significantly lower (better) for the 10- than for the 2-Hz rate for the YNH and ONH groups (both p < .05), but AM thresholds did not differ significantly for the two rates for the OHI group. For the 2-Hz rate, AM thresholds were significantly lower for the OHI group than for the YNH or ONH groups (both p < .05). This is consistent with the idea that loss of cochlear compression has the effect of amplifying the internal representation of AM (Jennings, Chen, Fultz, Ahlstrom, & Dubno, 2018; Moore, Wojtczak, & Vickers, 1996). For the 10-Hz rate, AM thresholds did not differ significantly across groups. It is not clear why the OHI group did not benefit from loss of cochlear compression for the 10-Hz rate.
An ANOVA was conducted on the logarithms of the FM thresholds with modulation rate as a within-subject factor and group as a between-subject factor. The effect of group was significant, F(2, 31) = 19.61, p < .001. Post hoc comparisons showed that the OHI group had higher thresholds than the ONH and YNH groups (both p < .05) and the ONH group had higher thresholds than the YNH group (p < .05). There was a significant effect of FM rate, thresholds being lower for the 2-Hz rate, F(1, 31) = 34.05, p < .001. The interaction of group and FM rate was not significant. The finding that FM thresholds were higher for the OHI group than for the other two groups might reflect reduced sensitivity to TFS for the former (perhaps especially for the 2-Hz rate) and broadening of the auditory filters and a corresponding reduction in the amount of FM-to-AM (perhaps especially for the 10-Hz rate).
For the YNH and ONH groups, AM detection was better at 10 Hz than at 2 Hz, while FM detection was slightly worse for the 10-Hz than for the 2-Hz rate. The better AM detection at 10 Hz probably reflects the greater number of modulation cycles occurring within the 1-s stimulus duration (Dau et al., 1997a; Sheft & Yost, 1990; Wallaert, Moore, Ewert, & Lorenzi, 2017). The finding that FM detection was not better for the 10-Hz than for the 2-Hz rate is consistent with the idea of distinct mechanisms for AM and FM detection. The sharpness of the excitation pattern should be the same for the two modulation rates, so if FM detection was solely based on FM-to-AM, better AM detection at 10 Hz should lead to better FM detection at 10 Hz. This was not the case, suggesting involvement of a mechanism other than AM-to-FM. For the OHI group, both AM detection and FM detection tended to be worse for the 10- than for the 2-Hz rate (although the effect of modulation rate was not significant for AM detection). This is consistent with a reliance on AM-to-FM for detection of FM for this group.
Figure 3 shows the mean results of Stage 2 for each group. The percent correct discrimination of AM from FM is plotted as a function of the input d′ value. An ANOVA was conducted on the arcsine-transformed scores with input d′ value and modulation rate as within-subject factors and group as a between-subject factor. There was no significant main effect of group, F(2, 31) = 0.32, p > .05, but there were significant effects of input d′, F(4, 124) = 59.2, p < .001, and of modulation rate, F(1, 31) = 50.3, p < .001. There were significant interactions of group and modulation rate, F(2, 31) = 3.7, p = .038, and of input d′ and modulation rate, F(4, 124) = 6.7, p = <.001. Post hoc least significant difference tests showed that the difference between the 2- and 10-Hz modulation rates was significant for groups YNH and ONH (both p < .01) but not for group OHI (p > .05).
Figure 3.
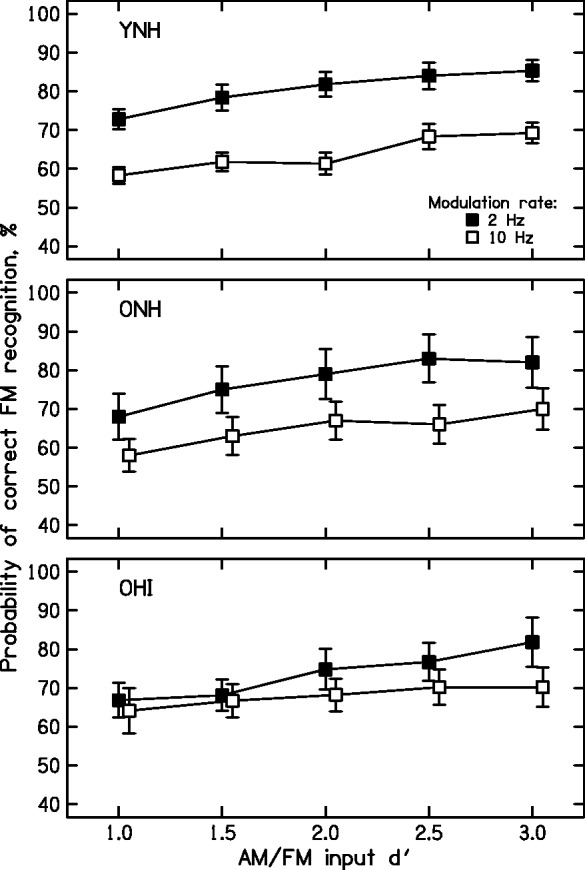
Mean AM-FM discrimination scores for each group as a function of input d′. Error bars indicate ±1 SD. FM = frequency modulation; AM = amplitude modulation; YNH = young with normal hearing; ONH = older with normal hearing; OHI = older with impaired hearing.
Figure 4 shows the individual results of Stage 2 for the YNH group. All subjects showed better performance for the 2-Hz modulation rate than for the 10-Hz rate, although the magnitude of the difference varied across subjects. For example, YNH12 showed a rather small difference, while YNH5 and YNH8 showed large differences. The magnitude of the difference, averaged across input d′ values, varied across subjects from 9 to 32 percentage points. The individual differences may reflect differences in the ability to use TFS cues.
Figure 4.

Individual AM-FM discrimination scores for the YNH subjects. FM = frequency modulation; AM = amplitude modulation; YNH = young with normal hearing.
Figure 5 shows the individual results of Stage 2 for the ONH group. The difference in scores for the 2- and 10-Hz modulation rates varied markedly across subjects. Some subjects showed large differences, comparable to those for the YNH subjects (e.g., ONH1, ONH2, ONH6, ONH7). Other subjects showed little or no effect of modulation rate (ONH5, ONH10, ONH13). The magnitude of the difference, averaged across input d′ values, varied across subjects from −4 to 42 percentage points. Six subjects showed differences of 6 percentage points or less. This is consistent with previous work showing marked individual differences among older people in the performance of tasks depending on the processing of TFS (Füllgrabe & Moore, 2017, 2018; Füllgrabe, Sek, & Moore, 2018; King, Hopkins, & Plack, 2014; Moore, Glasberg, et al., 2012; Moore, Vickers, et al., 2012; Ross et al., 2007; Wallaert et al., 2016).
Figure 5.

Individual AM-FM discrimination scores for the ONH subjects. FM = frequency modulation; AM = amplitude modulation; ONH = older with normal hearing.
Figure 6 shows the individual results of Stage 2 for the OHI group. OHI2 and OHI6 showed somewhat better performance for the 2- than for the 10-Hz rate for all input d′ values. OHI4 and OHI7 showed an effect of modulation rate only for the two largest input d′ values. OHI3, OHI5, and OHI9 showed little or no effect of modulation rate. The magnitude of the difference in scores for the two modulation rates, averaged across input d′ values, varied across subjects from −3 to 11 percentage points. Eight out of nine subjects showed differences of 5 percentage points or less, consistent with the idea that they had little or no sensitivity to TFS.
Figure 6.

Individual AM-FM discrimination scores for the OHI subjects. FM = frequency modulation; AM = amplitude modulation; OHI = older with impaired hearing.
For input d′ = 1, the smallest value used, mean scores for the 2-Hz rate (73% for the YNH group, 68% for the ONH group, and 67% for the OHI group) were well above the chance value of 50%. However, for the 10-Hz rate, the mean scores were only a little above chance, at 58% for the YNH and ONH groups and 64% for the OHI group. This is consistent with previous results showing that, for low modulation rates, AM can be discriminated from FM even when the detectability of the AM and FM is low, while for higher modulation rates, this is not the case (Demany & Semal, 1986; Moore & Sek, 1995).
General Discussion
This experiment was designed to assess the effect of age and hearing loss on sensitivity to TFS while controlling for possible effects of age and hearing loss on processing efficiency (Wallaert et al., 2016, 2018; Whiteford, Kreft, & Oxenham, 2017). Differences in processing efficiency in the detection of AM alone and FM alone were compensated for by determining for each subject the AM and FM depths required to achieve d′ values of 1, 1.5, 2, 2.5, and 3. In Stage 2, it was reasoned that poorer processing efficiency might affect overall performance, but it should have only a minimal effect on differences in AM-FM discrimination between the two modulation rates.
The detection of AM alone was very similar for the YNH and ONH groups, consistent with the idea that age has at most a small effect on the detection of AM (Füllgrabe et al., 2015; Paraouty et al., 2016; Schoof & Rosen, 2014). The OHI group showed better AM detection than the YNH and ONH groups for the 2-Hz modulation rate but not for the 10-Hz rate. Previous results have often shown better AM detection for hearing-impaired than for normal-hearing subjects for a range of AM rates, including both 2 and 10 Hz, when stimuli were presented at a low SL (Ernst & Moore, 2012; Schlittenlacher & Moore, 2016; Wallaert et al., 2017). Also, for hearing-impaired subjects, AM detection was better for a 10-Hz rate than for a 2-Hz rate (Ernst & Moore, 2012), which was not found here. However, these previous studies used sinusoidal AM, whereas this study used quasi-trapezoidal AM. The better AM detection at 10 Hz than at 2 Hz found by Ernst and Moore (2012) for hearing-impaired subjects may reflect greater sensitivity to rapid amplitude transitions than to slow amplitude transitions. In this study, the amplitude transitions had the same duration of 10 ms for the 10- and 2-Hz rates, which could explain the similarity of AM detection thresholds for the two rates for the OHI subjects.
Our use of quasi-trapezoidal modulation was intended to improve the use of TFS information for the 2-Hz rate, by increasing the duration of the time periods when the instantaneous frequency (IF) of the FM stimuli was stable. However, this may have had the additional effect of allowing some use of TFS information even for the 10-Hz rate (Paraouty et al., 2018). This would have reduced the differences in AM-FM discrimination for the 2- and 10-Hz rates. It would be desirable in future studies to study AM-FM discrimination using higher modulation rates, such as 20 Hz.
If FM detection is dominated by FM-to-AM, AM and FM detection thresholds should be correlated, provided that the bandwidths of the auditory filters do not vary greatly across subjects. Auditory filters do not broaden with increasing age when audiometric thresholds remain normal (Lutman, Gatehouse, & Worthington, 1991; Peters & Moore, 1992), so the data for the YNH and ONH groups were combined to assess this prediction. For the 10-Hz rate, the correlation between AM detection thresholds and (logarithms of the) FM detection thresholds was 0.63 (n = 25, p < .01), consistent with a dominant role for FM-to-AM at this rate. The size of the correlation was probably limited by measurement errors and individual differences in the sharpness of the auditory filters (Moore, 1987). The correlation between AM detection thresholds and (logarithms of the) FM detection thresholds was smaller but still significant for the 2-Hz rate (r = .45, p < .05). This might indicate some role of AM-to-FM at this rate. Alternatively, both correlations might partly arise from variations in processing efficiency across subjects. For the OHI group, the correlation between AM and (logarithms of) FM detection thresholds was 0.51 for the 10-Hz rate and −0.05 for the 2-Hz rate (n = 9, both p > .05). The lack of significant correlations for this group may reflect large individual differences in the sharpness of the auditory filters.
AM-FM discrimination was better for the 2-Hz than for the 10-Hz rate for the YNH and ONH groups, as found previously for YNH subjects (Demany & Semal, 1986; Moore & Sek, 1995). This is consistent with the idea that FM detection for a 2-Hz rate depends partly on the use of TFS cues. Some subjects in the ONH group showed substantial differences in AM-FM discrimination for the 2- and 10-Hz rates, while others showed negligible differences, consistent with large variations in sensitivity to TFS within the ONH group. These differences may reflect loss of synapses between inner hair cells and primary auditory neurons and consequent loss of neurons (Makary, Shin, Kujawa, Liberman, & Merchant, 2011; Sergeyenko, Lall, Liberman, & Kujawa, 2013; Wu, Liberman, Bennett, de Gruttola, O'Malley, & Liberman, 2018), loss of central inhibition (Caspary, Raza, Lawhorn Armour, Pippin, & Arneric, 1990; Salvi, Wang, & Ding, 2000), and loss of myelin in central pathways (Bartzokis, 2004).
For group OHI, AM-FM discrimination was not significantly better for the 2-Hz than for the 10-Hz rate, although a few subjects (e.g., OHI6) did show consistently better discrimination for the 2-Hz than for the 10-Hz rate. These results are consistent with the idea that hearing loss usually adversely affects the ability to use TFS information (Hopkins & Moore, 2007; Moore, 2014).
So far, the difference in AM-FM discrimination for the two modulation rates has been interpreted in terms of the use of TFS information for the lower rate but not (or less so) for the higher rate. However, there is another possible explanation for the results, based on FM-to-AM. For FM stimuli, the fluctuations in excitation level produced by the FM are 180° out of phase for center frequencies below and above the carrier frequency (Moore & Sek, 1994a; Zwicker, 1956). In contrast, for AM stimuli, the fluctuations in excitation level are in phase for center frequencies below and above the carrier frequency. AM-FM discrimination might depend on the ability to compare the phase of the excitation-level fluctuations on the two sides of the excitation pattern. This is referred to as the “AM-phase hypothesis.” The pattern of the present results could be explained if AM phase discrimination was better for 2-Hz modulation than for 10-Hz modulation and if AM-phase discrimination became more similar for the two rates with increasing hearing loss and (for some subjects) with increasing age.
There are few published data that can be used to assess the AM-phase hypothesis. Green et al. (1990) measured the AM depth required to discriminate in-phase AM from antiphase AM for carriers separated by 2/3 or 4/3 octave, but they tested only three normal-hearing students (presumably young), and they did not report any results for AM rates below 4 Hz. Thus, their results cannot be used to assess whether the pattern of AM-FM discrimination results found in this study can be explained in terms of the AM-phase hypothesis.
A potential problem in using stimuli like those of Green et al. (1990) to test the AM-phase hypothesis is that the outputs of auditory filters centered between the two carriers may provide a cue related to changes in IF, that is, a cue similar to TFS. For example, if the AM is applied to carriers with frequencies of 700 Hz and 1300 Hz, the output of an auditory filter centered at 1000 Hz will have an almost constant IF when the AM is in phase for the two carriers but will have an IF that varies when the AM is out of phase; the IF will be higher when the upper carrier has a short-term amplitude higher than that of the lower carrier, and vice versa. The use of this cue can be avoided by presenting a narrowband noise masker centered at a frequency between the two AM carrier frequencies.
We are conducting an experiment to test the AM-phase hypothesis using patterns of quasi-trapezoidal AM the same as used in this study. Detectability (d′) is being measured for discriminating in-phase AM from antiphase AM imposed on carriers centered below and above 1000 Hz, as a function of AM depth. A narrow band noise centered at 1000 Hz is being added to prevent the use of changes in IF at the outputs of auditory filters centered near 1000 Hz. The results obtained so far for YNH and ONH subjects indicate similar performance for 2-Hz and 10-Hz AM rates. Also, the AM depth required for above-chance performance is well above the threshold for detection of the AM. In contrast, the YNH and ONH subjects tested in this study showed AM-FM discrimination well above chance for the 2-Hz modulation rate when the AM and FM were only just detectable. These preliminary results suggest that the AM-phase hypothesis does not account for the data reported in this article. However, further work is clearly needed.
In conclusion, the results reported in this article suggest that discrimination of AM from FM at a 2-Hz rate by YNH subjects depends on the use of TFS information. Increasing age adversely affects the ability to use TFS information, and hence the ability to discriminate 2-Hz AM from 2-Hz FM, for some but not all people, while the combination of age and hearing loss adversely affects the ability to use TFS information for most people.
Acknowledgments
The authors thank Hedwig Gockel, Chris Plack, and two reviewers for helpful comments on an earlier version of this article.
Declaration of Conflicting Interests
The authors declared no potential conflicts of interest with respect to the research, authorship, and/or publication of this article.
Funding
The authors disclosed receipt of the following financial support for the research, authorship, and/or publication of this article: This work was supported by the Engineering and Physical Sciences Research Council (UK, grant number RG78536).
References
- Bartzokis G. (2004) Age-related myelin breakdown: A developmental model of cognitive decline and Alzheimer’s disease. Neurobiology of Aging 25: 5–18. doi:10.1016/j.neurobiolaging.2003.03.001. [DOI] [PubMed] [Google Scholar]
- Caspary D. M., Raza A., Lawhorn Armour B. A., Pippin J., Arneric S. P. (1990) Immunocytochemical and neurochemical evidence for age-related loss of GABA in the inferior colliculus: Implications for neural presbycusis. Journal of Neuroscience 10: 2363–2372. doi:10.1523/JNEUROSCI.10-07-02363.1990. [DOI] [PMC free article] [PubMed] [Google Scholar]
- Dau T., Kollmeier B., Kohlrausch A. (1997. a) Modeling auditory processing of amplitude modulation. I. Detection and masking with narrowband carriers. Journal of the Acoustical Society of America 102: 2892–2905. doi:10.1121/1.420344. [DOI] [PubMed] [Google Scholar]
- Dau T., Kollmeier B., Kohlrausch A. (1997. b) Modeling auditory processing of amplitude modulation. II. Spectral and temporal integration. Journal of the Acoustical Society of America 102: 2906–2919. doi:10.1121/1.420345. [DOI] [PubMed] [Google Scholar]
- Demany L., Semal C. (1986) On the detection of amplitude modulation and frequency modulation at low modulation frequencies. Acta Acustica United With Acustica 61: 243–255. [Google Scholar]
- Edwards B. W., Viemeister N. F. (1994) Frequency modulation versus amplitude modulation discrimination: Evidence for a second frequency modulation encoding mechanism. Journal of the Acoustical Society of America 96: 733–739. doi:10.1121/1.411440. [DOI] [PubMed] [Google Scholar]
- Ernst S. M., Moore B. C. J. (2012) The role of time and place cues in the detection of frequency modulation by hearing-impaired listeners. Journal of the Acoustical Society of America 131: 4722–4731. doi:10.1121/1.3699233. [DOI] [PubMed] [Google Scholar]
- Ewert, S. D., Paraouty, N., & Lorenzi, C. (2018). A two-path model of auditory modulation detection using temporal fine structure and envelope cues. European Journal of Neuroscience. Advance online publication. doi:10.1111/ejn.13846. [DOI] [PubMed]
- Füllgrabe C., Moore B. C. J. (2017) Evaluation of a method for determining binaural sensitivity to temporal fine structure (TFS-AF test) for older listeners with normal and impaired low-frequency hearing. Trends in Hearing 21: 1–14. doi:10.1177/2331216517737230. [DOI] [PMC free article] [PubMed] [Google Scholar]
- Füllgrabe C., Moore B. C. J. (2018) Association between the processing of binaural temporal-fine-structure information and audiometric threshold and age: A meta-analysis. Trends in Hearing 22: 1–14. doi:10.1177/2331216518797259. [DOI] [PMC free article] [PubMed] [Google Scholar]
- Füllgrabe C., Moore B. C. J., Stone M. A. (2015) Age-group differences in speech identification despite matched audiometrically normal hearing: Contributions from auditory temporal processing and cognition. Frontiers in Aging Neuroscience 6(article 347): 1–25. doi:10.3389/fnagi.2014.00347. [DOI] [PMC free article] [PubMed] [Google Scholar]
- Füllgrabe C., Sek A., Moore B. C. J. (2018) Senescent changes in sensitivity to binaural temporal fine structure. Trends in Hearing 22: 1–16. doi:10.1177/2331216518788224. [DOI] [PMC free article] [PubMed] [Google Scholar]
- Green D. M., Richards V. M., Onsan Z. A. (1990) Sensitivity to envelope coherence. Journal of the Acoustical Society of America 87: 323–329. doi:10.1121/1.399299. [DOI] [PubMed] [Google Scholar]
- Grose J. H., Mamo S. K. (2010) Processing of temporal fine structure as a function of age. Ear and Hearing 31: 755–760. doi:10.1097/AUD.0b013e3181e627e7. [DOI] [PMC free article] [PubMed] [Google Scholar]
- Hacker M. J., Ratcliff R. (1979) A revised table of d' for M-alternative forced choice. Perception and Psychophysics 26: 168–170. doi:10.3758/BF03208311. [Google Scholar]
- Hopkins K., Moore B. C. J. (2007) Moderate cochlear hearing loss leads to a reduced ability to use temporal fine structure information. Journal of the Acoustical Society of America 122: 1055–1068. doi:10.1121/1.2749457. [DOI] [PubMed] [Google Scholar]
- Hopkins K., Moore B. C. J. (2011) The effects of age and cochlear hearing loss on temporal fine structure sensitivity, frequency selectivity, and speech reception in noise. Journal of the Acoustical Society of America 130: 334–349. doi:10.1121/1.3585848. [DOI] [PubMed] [Google Scholar]
- Hopkins K., Moore B. C. J., Stone M. A. (2008) Effects of moderate cochlear hearing loss on the ability to benefit from temporal fine structure information in speech. Journal of the Acoustical Society of America 123: 1140–1153. doi:10.1121/1.2824018. [DOI] [PMC free article] [PubMed] [Google Scholar]
- Jennings S. G., Chen J., Fultz S. E., Ahlstrom J. B., Dubno J. R. (2018) Amplitude modulation detection with a short-duration carrier: Effects of a precursor and hearing loss. Journal of the Acoustical Society of America 143: 2232–2243. doi:10.1121/1.5031122. [DOI] [PMC free article] [PubMed] [Google Scholar]
- King A., Hopkins K., Plack C. J. (2014) The effects of age and hearing loss on interaural phase discrimination. Journal of the Acoustical Society of America 135: 342–351. doi:10.1121/1.4838995. [DOI] [PubMed] [Google Scholar]
- King A., Varnet L. O., Lorenzi C. (2019) Accounting for masking of frequency modulation by amplitude modulation with the modulation filter-bank concept. Journal of the Acoustical Society of America 145: 2277–2293. doi:10.1121/1.5094344. [DOI] [PubMed] [Google Scholar]
- Lutman M. E., Gatehouse S., Worthington A. G. (1991) Frequency resolution as a function of hearing threshold level and age. Journal of the Acoustical Society of America 89: 320–328. doi:10.1121/1.400513. [DOI] [PubMed] [Google Scholar]
- Makary C. A., Shin J., Kujawa S. G., Liberman M. C., Merchant S. N. (2011) Age-related primary cochlear neuronal degeneration in human temporal bones. Journal of the Association for Research in Otolaryngology 12: 711–717. doi:10.1007/s10162-011-0283-2. [DOI] [PMC free article] [PubMed] [Google Scholar]
- Micheyl C., Delhommeau K., Perrot X., Oxenham A. J. (2006) Influence of musical and psychoacoustical training on pitch discrimination. Hearing Research 219: 36–47. doi:10.1016/j.heares.2006.05.004. [DOI] [PubMed] [Google Scholar]
- Moore B. C. J. (1987) Distribution of auditory-filter bandwidths at 2 kHz in young normal listeners. Journal of the Acoustical Society of America 81: 1633–1635. doi:10.1121/1.394518. [DOI] [PubMed] [Google Scholar]
- Moore B. C. J. (2014) Auditory processing of temporal fine structure: Effects of age and hearing loss, Singapore: World Scientific. [DOI] [PubMed] [Google Scholar]
- Moore B. C. J., Glasberg B. R., Stoev M., Füllgrabe C., Hopkins K. (2012) The influence of age and high-frequency hearing loss on sensitivity to temporal fine structure at low frequencies. Journal of the Acoustical Society of America 131: 1003–1006. doi:10.1121/1.3672808. [DOI] [PubMed] [Google Scholar]
- Moore B. C. J., Mariathasan S., Sek A. P. (2018) Effects of age on the discrimination of amplitude and frequency modulation for 2- and 10-Hz rates. Acta Acustica United with Acustica 104: 778–782. doi:10.3813/AAA.919222. [Google Scholar]
- Moore B. C. J., Sek A. (1994. a) Effects of carrier frequency and background noise on the detection of mixed modulation. Journal of the Acoustical Society of America 96: 741–751. doi:10.1121/1.410312. [DOI] [PubMed] [Google Scholar]
- Moore B. C. J., Sek A. (1994. b) Discrimination of modulation type (AM or FM) with and without background noise. Journal of the Acoustical Society of America 96: 726–732. doi:10.1121/1.410311. [DOI] [PubMed] [Google Scholar]
- Moore B. C. J., Sek A. (1995) Effects of carrier frequency, modulation rate and modulation waveform on the detection of modulation and the discrimination of modulation type (AM vs FM). Journal of the Acoustical Society of America 97: 2468–2478. doi:10.1121/1.411967. [DOI] [PubMed] [Google Scholar]
- Moore B. C. J., Sek A. (1996) Detection of frequency modulation at low modulation rates: Evidence for a mechanism based on phase locking. Journal of the Acoustical Society of America 100: 2320–2331. doi:10.1121/1.417941. [DOI] [PubMed] [Google Scholar]
- Moore B. C. J., Vickers D. A., Mehta A. (2012) The effects of age on temporal fine structure sensitivity in monaural and binaural conditions. International Journal of Audiology 51: 715–721. doi:10.3109/14992027.2012.690079. [DOI] [PubMed] [Google Scholar]
- Moore B. C. J., Wojtczak M., Vickers D. A. (1996) Effect of loudness recruitment on the perception of amplitude modulation. Journal of the Acoustical Society of America 100: 481–489. doi:10.1121/1.415861. [Google Scholar]
- Oxenham A. J., Fligor B. J., Mason C. R., Kidd G., Jr. (2003) Informational masking and musical training. Journal of the Acoustical Society of America 114: 1543–1549. doi:10.1121/1.1598197. [DOI] [PubMed] [Google Scholar]
- Paraouty N., Ewert S. D., Wallaert N., Lorenzi C. (2016) Interactions between amplitude modulation and frequency modulation processing: Effects of age and hearing loss. Journal of the Acoustical Society of America 140: 121–131. doi:10.1121/1.4955078. [DOI] [PubMed] [Google Scholar]
- Paraouty N., Stasiak A., Lorenzi C., Varnet L., Winter I. M. (2018) Dual coding of frequency modulation in the ventral cochlear nucleus. Journal of Neuroscience 38: 4123–4137. doi:10.1523/JNEUROSCI.2107-17.2018. [DOI] [PMC free article] [PubMed] [Google Scholar]
- Peters R. W., Moore B. C. J. (1992) Auditory filters and aging: Filters when auditory thresholds are normal. In: Cazals Y., Demany L., Horner K. (eds) Auditory physiology and perception, Oxford, England: Pergamon, pp. 179–185. [Google Scholar]
- Rose J. E., Brugge J. F., Anderson D. J., Hind J. E. (1967) Phase-locked response to low-frequency tones in single auditory nerve fibers of the squirrel monkey. Journal of Neurophysiology 30: 769–793. doi:10.1152/jn.1967.30.4.769. [DOI] [PubMed] [Google Scholar]
- Ross B., Fujioka T., Tremblay K. L., Picton T. W. (2007) Aging in binaural hearing begins in mid-life: Evidence from cortical auditory-evoked responses to changes in interaural phase. Journal of Neuroscience 27: 11172–11178. doi:10.1523/JNEUROSCI.1813-07.2007. [DOI] [PMC free article] [PubMed] [Google Scholar]
- Salvi R. J., Wang J., Ding D. (2000) Auditory plasticity and hyperactivity following cochlear damage. Hearing Research 147: 261–274. doi:10.1016/S0378-5955(00)00136-2. [DOI] [PubMed] [Google Scholar]
- Schlittenlacher J., Moore B. C. J. (2016) Discrimination of amplitude-modulation depth by subjects with normal and impaired hearing. Journal of the Acoustical Society of America 140: 3487–3495. doi:10.1121/1.4966117. [DOI] [PubMed] [Google Scholar]
- Schoof T., Rosen S. (2014) The role of auditory and cognitive factors in understanding speech in noise by normal-hearing older listeners. Frontiers in Aging Neuroscience 6(article 307): 1–14. doi:10.3389/fnagi.2014.00307. [DOI] [PMC free article] [PubMed] [Google Scholar]
- Sek A., Moore B. C. J. (1995) Frequency discrimination as a function of frequency, measured in several ways. Journal of the Acoustical Society of America 97: 2479–2486. doi:10.1121/1.411968. [DOI] [PubMed] [Google Scholar]
- Sergeyenko Y., Lall K., Liberman M. C., Kujawa S. G. (2013) Age-related cochlear synaptopathy: An early-onset contributor to auditory functional decline. Journal of Neuroscience 33: 13686–13694. doi:10.1523/JNEUROSCI.1783-13.2013. [DOI] [PMC free article] [PubMed] [Google Scholar]
- Shailer M. J., Moore B. C. J. (1993) Effects of modulation rate and rate of envelope change on modulation discrimination interference. Journal of the Acoustical Society of America 94: 3138–3143. doi:10.1121/1.407219. [Google Scholar]
- Sheft S., Yost W. A. (1990) Temporal integration in amplitude modulation detection. Journal of the Acoustical Society of America 88: 796–805. doi:10.1121/1.399729. [DOI] [PubMed] [Google Scholar]
- Wallaert N., Moore B. C. J., Lorenzi C. (2016) Comparing the effects of age on amplitude modulation and frequency modulation detection. Journal of the Acoustical Society of America 139: 3088–3096. doi:10.1121/1.4953019. [DOI] [PubMed] [Google Scholar]
- Wallaert N., Moore B. C. J., Ewert S. D., Lorenzi C. (2017) Sensorineural hearing loss enhances auditory sensitivity and temporal integration for amplitude modulation. Journal of the Acoustical Society of America 141: 971–980. doi:10.1121/1.4976080. [DOI] [PubMed] [Google Scholar]
- Wallaert N., Varnet L., Moore B. C. J., Lorenzi C. (2018) Sensorineural hearing loss impairs sensitivity but spares temporal integration for detection of frequency modulation. Journal of the Acoustical Society of America 144: 720–733. doi:10.1121/1.5049364. [DOI] [PubMed] [Google Scholar]
- Whiteford K. L., Kreft H. A., Oxenham A. J. (2017) Assessing the role of place and timing cues in coding frequency and amplitude modulation as a function of age. Journal of the Association for Research in Otolaryngology 18: 619–633. doi:10.1007/s10162-017-0624-x. [DOI] [PMC free article] [PubMed] [Google Scholar]
- Wu, P. Z., Liberman, L. D., Bennett, K., de Gruttola, V., O'Malley, J. T., & Liberman, M. C. (2018). Primary neural degeneration in the human cochlea: Evidence for hidden hearing loss in the aging ear. Neuroscience. Advance online publication. doi:10.1016/j.neuroscience.2018.07.053. [DOI] [PMC free article] [PubMed]
- Zwicker E. (1956) Die elementaren Grundlagen zur Bestimmung der Informationskapazität des Gehörs [The foundations for determining the information capacity of the auditory system]. Acustica 6: 356–381. [Google Scholar]