

Abstract
The main aim of the study was to establish the acetylation status of local population of Pakistan by N-acetyltransferase 2 (NAT2) enzyme and to find out the concordance between phenotypic and genotypic methods for the determination of NAT2 acetylation. Gender-wise comparison of selected healthy male and female volunteers aged greater than 18 years was also conducted to see the effect of sex on NAT2 acetylation. Phenotypically, the rate of acetylation was determined by high-pressure liquid chromatography with dapsone (DDS) probe drug, while genotypically, NAT2 acetylation was determined by using specific primers for NAT2 variant alleles (M1, M2, and M3) amplified in separate polymerase chain reactions. High-pressure liquid chromatography results indicated 64% of the male volunteers to be fast acetylators while 36% were slow acetylators, while ratio of fast and slow acetylators for female was found to be 66% and 34%, respectively. Genotypically, the ratio of fast and slow for male was 60% and 40% and for female was 66% and 34%, respectively. The distribution of 3 NAT2 variant alleles was found in invariable number. For male volunteers, the highest frequency distribution showed by M2 allele was 56%, while for M1 and M3 the frequency was 32% and 12%, respectively, and for female volunteers highest frequency (51%) was shown by the M2 variant allele while lowest frequency (18%) was shown by M3 allele. There was the 94% concordance between the DDS phenotype and genotype. Gender effect on the acetylation was found to be nonsignificant (P > .05). Therefore, it is concluded that NAT2 acetylation rate can be used to check in vivo acetylation status with dapsone as probe drug. It is concluded that NAT2 acetylation rate was unaffected by gender and can be used to check in vivo acetylation status with dapsone as probe drug, which is inexpensive and less time-consuming.
Keywords: aryl amines N-acetyltransferase 2, dapsone, phenotyping, genotyping, HPLC assay, PCR amplification
Introduction
Phase II enzymes are renowned drug metabolic enzymes that catalyze the reactions of activation and inactivation or detoxification of large number of drugs as well as xenobiotics.1 Several toxic drug reactions along with susceptibilities to various cancers have been accredited to interindividual variations in phase II enzymes.2,3 The N-acetyltransferase 2 (NAT2) is a phase II enzyme that catalyzes the acetylation of hydrazines, which include commonly used therapeutic drugs such as dapsone (DDS), isoniazid, sulphamethazine (SMZ), and procainamide4 and carcinogenic compounds such as benzidine, 4-aminobiphenyl, 2-aminofluorene, and 2-naphythylamine.5-7 There are large number of interindividual variability in relative and absolute activities of NAT2, so they respond differently to drugs and xenobiotics.8 Therefore, polymorphism in acetylation affects the toxicity and therapeutic efficacy.9
Both slow and fast N-acetylation genotypes and phenotypes have been linked with the risk of various cancers. The slow N-acetylation phenotype has been linked with a higher risk of bladder cancer in people those with highly exposed to arylamine,10 while the fast acetylators have been coupled with higher risk of lung cancer.11 Generally, the relationship of diseases with NAT2 acetylation is stronger for smokers as compared to nonsmokers.12
These studies, in concert with racial difference in the ratio of fast and slow acetylators, proposed that the NAT2 acetylation and environmental exposure may partly explain patterns for the risk of cancer in diverse populations.13 Categorization of NAT2 phenotypes and genotypes in healthy individuals helps for assessment of cancer associations with NAT2 acetylation.14 N-acetylation 2 phenotyping and/or genotyping guided the regimen of therapeutic drugs-induced toxicity or cure failure with the standard doses.
So far, no large study of NAT2 phenotype and genotype distribution along with their concordance has been reported for Pakistani population. Three major NAT2 genotypes were characterized while the metabolic phenotyping was determined by DDS assay. Our primary aim was to determine the acetylation status of arylamine NAT2 both by phenotypically and genotypically and then to find the concordance between these 2 acetylation methods. We suggested that both methods can be used alternatively for the determination of NAT2 acetylation status of the individuals for clinical studies with the drugs that are metabolized by polymorphic arylamine NAT2 enzyme. A good concordance between NAT2 phenotype and genotype has been reported for a number of populations. There are few reports that study the NAT2 acetylation status for the local population in Pakistan and to find the association between NAT2 acetylation phenotype and genotype.
Materials and Methods
Study Volunteers
A total of 200 healthy volunteers participated in the study. All volunteers belong to diverse areas of Pakistan. Hundred healthy male volunteers (mean age, 24.5 years and mean body weight 59.24 kg) and hundred healthy female volunteers (mean age, 22.5 years; mean body weight, 57.41 kg) participated to conduct the study. The ethical committee of the institution approved this study and written consent forms were signed by all the volunteers. Each volunteer was interviewed personally with a self-developed structured questionnaire to compile necessary information. The questionnaire included the history, background information; demographic data; history of usual diet plan including intake of soft drinks, tea, coffee, medical history, and any medication that was known to interact with this enzyme; history of smoking or passive smoking; and occupational history.
Only the healthy individuals with laboratory investigation including demographic data (Table 1), plasma biochemistry (Figure 1) as well as complete blood count (Table 2) were included in the study, all volunteers were nonsmokers and nonalcoholics and were inadmissible to take any type of caffeinated drinks. Volunteers with history of any liver abnormality or already taking medicines were excluded from the study.
Table 1.
Mean (SD) Values for the Demographic Data of Healthy Male and Female Volunteers.
| Volunteers | Age (Years) | Weight (kg) | Height (cm) | Body Temperature (°F) | Blood Pressure (mm Hg) | |
|---|---|---|---|---|---|---|
| Systolic | Diastolic | |||||
| Mean | ||||||
| Male | 24.5 | 59.24 | 5.8 | 98.65 | 116.4 | 78.6 |
| Female | 22.5 | 57.41 | 5.3 | 96.5 | 112.4 | 78.16 |
| SD | ||||||
| Male | 1.89 | 8.65 | 0.22 | 0.76 | 4.9 | 8.1 |
| Female | 1.69 | 8.88 | 0.21 | 0.77 | 6.8 | 8.4 |
| Maximum | ||||||
| Male | 30 | 94 | 6.0 | 100 | 122 | 100 |
| Female | 29 | 78 | 5.5 | 98 | 126 | 101 |
| Minimum: | ||||||
| Male | 20 | 52 | 5.4 | 98 | 92 | 88 |
| Female | 19 | 49 | 5.4 | 96 | 92 | 92 |
Abbreviation: SD, standard deviation.
Figure 1.

Mean (standard deviation) biochemical parameters for healthy male volunteers.
Table 2.
Mean (SD) for Complete Blood Count of Male and Female Volunteers.
| Male | Female | |||||
|---|---|---|---|---|---|---|
| Mean (SD) | Maximum | Minimum | Mean (SD) | Maximum | Minimum | |
| Hb (g %) | 15.2 (0.35) | 17.2 | 13.5 | 14.33 (1.45) | 16.4 | 10.5 |
| ESR (mm/1 hour) | 7.92 (3.20) | 18 | 3 | 14.44 (9.57) | 43 | 4 |
| TLC (cc) | 7836 (2198.5) | 14,900 | 4200 | 6414 (1388.9) | 9400 | 4000 |
| Neutrophils (%) | 63.26 (8.8) | 78 | 39 | 56.4 (10.78) | 73 | 19 |
| Lymphocytes (%) | 33.64 (8.5) | 54 | 18 | 39.12 (10.13) | 74 | 24 |
| Monocytes (%) | 2.04 (1.08) | 5 | 0 | 2.94 (1.31) | 6 | 1 |
| Eosiniphils (%) | 1.46 (1.09) | 5 | 0 | 1.68 (0.94) | 4 | 0 |
Abbreviations: ESR, erythrocyte sedimentation rate; Hb, hemoglobin; SD, standard deviation; TLC, total lung capacity.
Chemicals and Reagents
All reference standards for the probe drug and monoacetyldapsone (MADS) were purchased from trustworthy sources like Sigma-Aldrich (St. Louis, MO). Dapsone, MADS, SMZ, sodium dihydrogen phosphate, and monohydrogen phosphate were purchased from Sigma and Sigma-Aldrich (St. Louis, MO), double distilled water was obtained from High Tech Lab of the Institute, Adventec Japan (CPW 200, GS 590, distillery), University of Agriculture, Faisalabad, Pakistan.
Acetone, acetonitrile, and methanol and all other solvents and chemicals having high purity were of high-pressure liquid chromatography (HPLC) grade and purchased from Sigma/Sigma-Aldrich, PanReac AppliChem ITW Reagents, and RCI Labscan Limited. Drug-free plasma was obtained from District Headquarter Hospital, Faisalabad, Pakistan.
Drug Dosing and Blood Collection
All selected volunteers were asked to donate the blank blood sample at the end of the interview. Single blank blood sample of 10 mL was collected from each study volunteer in a heparin-coated blood-collecting tube to determine the biochemical parameters and also for the isolation of DNA for the determination of NAT2 genotype. All the blood samples were stored at −80°C till analysis. Participants were given 200 mg DDS orally with water, after a fasting of about 8 to 12 hours. Volunteers were renounced from the consumption of caffeinated beverages and food before 12 hours of dosing until the complete sampling. Then, 2 mL of blood sample from all participants were collected after predetermined time interval (3 hours) for phenotype determination by HPLC and stored at −80°C for later analysis.
Instrumentation and Chromatographic Conditions
SHIMADZU HPLC with a controller system (SCL-10A), LC-10AT pump, velocity and pressure controller flow valve (FCU-10AL), and ultraviolet–visible detector (SPD-10 AV) by SHIMADZU Scientific Int. Japan were used. All separations were attained at an ambient temperature with a CLC-ODS column having 4.6 mm × 15 mm diameter and 5 µm pore size. Both DDS and MADSS were determined using the isocratic mode of HPLC with 1 mL/min flow rate. Both DDS and MADS were detected at 295 nm with a run time of 9 and 11.9 minutes, respectively. Data obtained were analyzed with CSW software.
Standards
Standard curve was constructed using 5 standards of different concentrations run in triplicate for both DDS and MADS. All standards and quality controls for DDS and MADS were prepared in blank plasma with the concentration range of 0.5, 1, 2.5, 7.5, 15, and 20 µg/mL, and quality control 1.5, 10, and 17.5 µg/mL concentrations from the stock solutions of 1.0 and 0.5 mg/mL were prepared. Internal standard (SMZ) was prepared in 50 µg/mL concentration. Intra- and interday standards deviations, means, and coefficient of variation (CV) were computed using standard methods (ICH guidelines, 2005) and shown in Table 3.The intra- and interday precision and accuracy was less than 10% for DDS and the CV% was ≤6.5% for all test conditions.
Table 3.
Intra- and Interday Precision and Accuracy for Dapsone (DDS) and Monoacetyldapsone (MADS).
| Reproducibility | Concentration (μg/mL) | DDS | MADS | ||||
|---|---|---|---|---|---|---|---|
| Added | Found (Mean [SD]) | CV (%) | Difference (Found Vs Added) | Found (Mean [SD]) | CV (%) | Difference (Found Vs Added) | |
| Intra-assaya | |||||||
| Quality controls | 1.5 | 1.61 (0.049) | 3.04 | 7.33 | 1.54 (0.06) | 3.90 | 2.67 |
| 10 | 9.433 (0.555) | 5.88 | 5.67 | 9.6 (0.433) | 4.51 | 4.0 | |
| 17.5 | 18.7 (1.1) | 5.87 | 6.86 | 19.1 (0.98) | 5.13 | 9.14 | |
| Inter-assayb | |||||||
| Quality controls | 1.5 | 1.59 (0.08) | 5.03 | 6 | 1.47 (0.023) | 1.56 | 2 |
| 10 | 10.7 (0.67) | 6.26 | 7 | 10.7 (0.87) | 8.13 | 7 | |
| 17.5 | 17.9 (1.45) | 8.10 | 2.29 | 18.6 (1.33) | 7.15 | 6.29 | |
| Standards | 0.5 | 0.533 (0.03) | 5.63 | −6.6 | 0.48 (0.047) | 9.79 | 4 |
| 1 | 1.087 (0.09) | 8.28 | −8.7 | 0.987 (0.06) | 6.08 | 1.3 | |
| 2.5 | 2.45 (0.84) | 3.43 | 2 | 2.53 (0.211) | 8.34 | −1.2 | |
| 7.5 | 8.2 (0.5) | 6.1 | 9.33 | 8.15 (0.44) | 5.4 | −8.67 | |
| 15 | 16.0 (1.05) | 6.56 | 6.67 | 14.8 (1.1) | 7.43 | 1.33 | |
| 20 | 21.0 (1.30) | 6.19 | −5 | 21.7 (1.4) | 6.45 | −8.5 | |
Abbreviations: CV, coefficient of variation; SD, standard deviation.
aFive quality control samples per concentration.
bFifteen quality control samples, per day per concentration for 3 days.
Phenotyping Assay for Determination of DDS and MADS
Plasma sample of DDS and MADS were thawed and processed according to Irshaid et al.15 A 300 µL internal standard (SMZ) plasma sample was added to the 300 µL DDS and MADS plasma samples, was mixed, vortexed (1 minute), and centrifuged (10 minutes at 13 000 rpm). Supernatant was taken, filter through 0.45 μm syringe filter, and injected (20 µL) directly into the HPLC column. Samples were eluted through the mobile phase consisting of methanol, acetonitrile, and phosphate buffer (pH 5.9, 0.067 mol) in a ratio of 3:7:20 with 1 mL/min of flow rate and 27°C ambient temperature. For intra- and interday assay, the CV was found to be less than 10% and the drug concentration was reported as the peak to height ratio of DDS and MADS to the internal standard (SMZ). Participants having MADS-to-DDS acetylation ratio less than 0.35 were assigned as slow acetylators and greater than 0.35 as fast acetylators for DDS. Representative chromatograms for DDS, MADS, and internal standards (SMZ) are shown in Figure 2.
Figure 2.

Representative chromatogram of 20 µg/mL SMZ (IS), DDS, and MADS in plasma. DDS indicates dapsone; MADS, monoacetyldapsone; SMZ, ulphamethazine.
N-Acetyltransferase 2 Genotyping
Isolation and quantification of DNA
DNA was isolated from heparinized blank blood samples (2 mL) from all volunteers. DNA was isolated using a kit, following the Qiagen DNA isolation kit protocol. Isolation of DNA was confirmed by running agarose gel electrophoresis (Figure 3). All isolated DNA samples were quantified and used for the polymerase chain reaction (PCR) in 600 to 800 ng concentration to find the wild (wt) and variant alleles to genotype the NAT2 enzyme.
Figure 3.

Representative gel for DNA isolation. 1, 2, 3, 4, 5, 6, and 7 represent the volunteer’s number.
Polymerase chain reaction–based allele-specific amplification assay was used to amplify the NAT2 gene for M1, M2, and M3 alleles of both wt type and variant type. For genotyping, all primer pairs of required sequences were synthesized from the Gene Link. Primer sequences for the “wt” and “mut” (mutant) NAT2 M1, M2, and M3 alleles were of the followings:
M1 wt “CTGATTTGGTCCAG”
M1 mut “CTGATTTGGTCCAA”
M2 wt “TTTACGCTTGAACCTCG”
M2 mut “TTTACGCTTGAACCTCA”
M3 wt “AATAGTAAGGGATC”
M3 mut “AATAGTAAGGGATT”
Primer1 “AATTAGTCACACGAGGA”
Primer 2 “TCTAGCATGAATCACTCTGC”
For M1 and M3 (wt and mut) alleles, primer 1 was used as a common primer while for M2 (wt and mut) alleles, primer 2 was used. All these primers were used to genotype the NAT2 gene for M1, M2, and M3 alleles.
Optimization
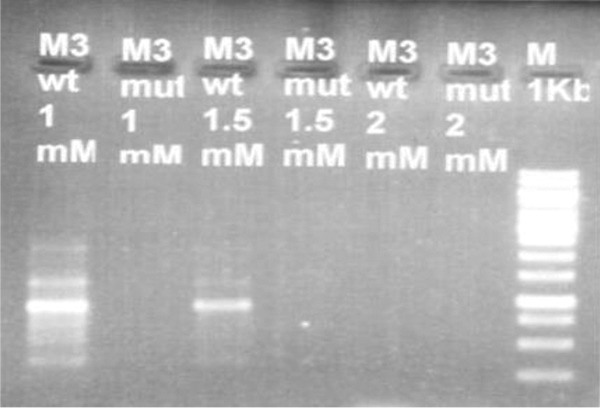
Different MgCl2 concentrations were used to optimize PCRs for all 3 alleles (wt and mut). It was found that 0.75 mM (1.5 µL) for M1, 1 mM (2 µL) and 1.5 (3 µL) for M2, and 0.75 mM (1.5 µL) for M3 were the MgCl2 concentrations at which clear band of DNA on gel of both wt and mut alleles obtained and theses concentrations were considered optimized concentration of MgCl2 for PCR (Figures 4 –6).
Figure 4.

Representative gel for optimization of M1 wild-type and mutant allele (568 bp).
Figure 5.

Representative gel for optimization of M3 wild-type and mutant allele (565 bp).
Figure 6.
Representative gel for optimization of M2 wild-type and mutant allele (944 bp).
Polymerase chain reactions for all 3 alleles (wt and mut) were conducted with a total volume of 50 µL in PCR tubes. Genomic DNA was used in a concentration range of 500 to 800 ng with 10 µM (2.5 µL) each primer concentration, each deoxyribonucleotide triphosphates at 5 µL concentration, Taq DNA polymerase 0.5 µL, 5 µL of 10× Taq buffer with KCl, and respective optimized MgCl2 concentration for M1, M2, and M3 alleles. A total of 30 cycles (60 seconds at 94°C, 90 seconds at 48°C for M1, for M2 55°C, for M3 35°C at 72°C for 180 seconds) were conducted and were followed by the ultimate extension at 72oC for 7 minutes.
Identification
All PCR results for M1, M2, and M3 wt and mut alleles were identified by the agarose (0.8%) gel electrophoresis.
Statistical Analysis
Mean (standard deviation) values for biochemical parameters, complete blood count, and demographic data were estimated using Minitab 2002 version 13.2 and represented in the form of graphs and tables. The concordance between the phenotype and genotype was determined using κ test values. The level of significance was considered to exist at 5% and 95% confidence intervals were calculated, so the measured P < .05 was found to be statistically significant.
Results and Discussion
Phenotype
NAT2 acetylation phenotype was determined by the measurement of metabolic ratio of MADS to DDS through HPLC assay.15 Dapsone was used to phenotype the NAT2 acetylation as it has no severe side effects that were likely to happen all through the phenotyping assessment; furthermore, a single spot of blood (3 hours after single oral dose) is adequate to estimate the NAT2 phenotype by DDS.15,16 The ratio of MADS to DDS in plasma sample gives more perfect estimation for NAT2 acetylation as compared to caffeine metabolites ratio in urine as caffeine metabolites are influenced by other factors. In many trials for NAT2 phenotyping, the DDS has been used broadly as probe drug of choice in humans as this has been recognized as a convenient and harmless method for the NAT2 acetylator phenotype determination.17 The urinary MADS-to-DDS ratio to test the acetylation phenotype was not considered as the distinctive index for systemic determination of acetylation polymorphism as evaluated in the Mainland Chinese residents. Monoacetyldapsone has high ability of protein binding and low excretory value than DDS; and this was reconfirmed in a big figure in Japanese individuals. Thus, the MADS-to-DDS ratio in 3-hour plasma sample after single oral dose of DDS by itself found to be the discriminative and most acceptable index. Therefore, at 3 hours the MADS-to-DDS plasma ratio after the single oral DDS dose by itself is the discriminative and most acceptable phenotyping index and found to be the superior as compared to urinary sample-derived parameters. High-pressure liquid chromatography assay was used to determine the plasma concentration of DDS and MADS. Subsequently, these concentrations were employed to find the MADS-to-DDS molar ratios to establish the bimodal distribution of NAT2 acetylation as fast and slow acetylators. The ratio of MADS to DDS was used to find the NAT2 acetylation status of all the individuals. Individuals with molar ratio <0.35 were classified as slow acetylators, whereas individuals with molar ratio >0.35 were categorized as the fast acetylators. The representative histograms of the molar ratio for male and female are shown in Figures 7 and 8, respectively. Distribution of DDS phenotype for fast and slow individuals was 65% and 34%, respectively, and is shown in Table 3. Frequency distribution histogram for the MADS-to-DDS molar ratio for male and female individuals is shown in Figures 7 and 8. Highest number of male individuals was found in a range of 0.01 to 0.25 MADS-to-DDS ratio and minimum number was found in 3.3 to 3.5.
Figure 7.

Frequency histogram for molar ratio of MADS/DDS for male participants. DDS indicates dapsone; MADS, monoacetyldapsone.
Figure 8.

Frequency histogram for molar ratio of MADS/DDS for female participants. DDS indicates dapsone; MADS, monoacetyldapsone.
In our study, irrespective of gender, the frequency of fast acetylators was 65% (130/200) and 35% (70/200) for slow acetylators. The trend headed for the given observation of higher incidence of fast acetylators in our study seems straight to reveal the variations in NAT2 acetylation frequency due to ethnicity.18 Different studies showed wide variations in the relative ratios for slow and the fast acetylators in different ethnic groups.19 In most Asian populations, the relative proportions for the fast and slow acetylators found invariably as determined by both phenotypically and genotypically.18,20 In Japanese, the slow acetylators’ ratio was found to be 67.5% as measured by the plasma molar ratio of MADS to DDS in healthy population.21
In our study, the participants showed the bimodal distribution (fast and slow acetylation) of the data. Different rates for NAT2 acetylation were studied for different NAT2 acetylating probe drugs like isoniazid in bimodal or trimodal distribution. A dominant trimodal allocation as slow (51%), intermediate (12%), and fast (37%) acetylators as measured in 6 hours SMZ plasma sample by Singh et al22 was observed in south Indian participants. The intermediate phenotype both by SMZ and with DDS plasma was not apparent. Bimodal distribution by DDS plasma is more acceptable as it is clear, simple, safe, and single blood sample collection. Bimodal allocations as fast and slow acetylators were explored by DDS in our study in disparity to trimodal allocation by other researchers. In this regard according to our understanding, a bimodal distribution of slow and fast acetylators may be a good categorization of the participants either as fast or slow acetylators.19,21 Nevertheless, explaining the difference in the NAT2 distribution either as in bimodal or trimodal frequency is complicated and remains speculative.23,24 Though the NAT2 acetylation in 108 Chinese by DDS did not prove any authentication of trimodality, the distribution histogram obtained from 182 healthy participants demonstrates dual mode in selected populations whereas the histogram for the female subject confirms trimodal and that for the male participants was not the trimodal.21 There are few records that represent the trimodal distribution with the probe drugs such as DDS, SMZ, and isoniazid.25,26 In addition, the trimodal distribution pattern of MADS-to-DDS ratios in plasma with 2 antimode one at 0.35 and other at 0.85 cutoff points is inclined to sustain this observation.27
Overall, our 34% of local healthy population is slow acetylator for NAT2 enzyme and in humans the slow acetylation phenotype is a widespread heritable characteristic. As reported, the slow acetylation genotype exists in higher frequency in Asian population with 43% in Turkish population28 and varies from non-Asians, like 50% to 60% in Caucasians29,30 and 90% in Northern Africans.31,32 Numerous reports showed significant variability in the incidence of slow acetylation phenotype as well as genotype in different ethnic populations, mostly in Asian populations as 10% to 20% in Chinese and Japanese with highest ratio 80% in Arabian population.29,33 The reason for this high variability in different ethnic groups is the presence of multiple alleles at the respective locus for the variation in acetylation phenotype between ethnic participants.34
In our findings for NAT2 phenotype, the ratio of fast acetylators is more (63%) as compared to the slow acetylators, which are in accordance with other investigation for Asian’s populations as Japanese population found to be 90% fast acetylators, with only 25% approximation in African population. This distribution of fast and slow acetylators vary broadly in different ethnic populations and supports the distribution acetylation phenotype variations among the population of dissimilar geographic origins. Distribution of slow acetylation phenotype in Asians differs greatly with only 4.9% in healthy individuals of Saudi Arabians, 13.1% in Japanese patients with tuberculosis, while 67.5% in Jordanian healthy individuals.29,33 On average, the frequency for slow acetylation phenotype differs widely from 40% to 70% in Caucasian and African populations while in Asian populations including Thai, Korean, Chinese, and Japanese the frequency ranged from 10% to 30%.35 These investigations showed the vast interindividual differences in NAT2 acetylation activity is due to the widespread NAT2 polymorphism.
Genotypic Assay
In 200 healthy participants (100 males and 100 females), the NAT2 genotype frequency was assessed by finding 3 mut alleles M1, M2, and M3 (Figures 9 –11), which represent the point mutation in the NAT2 gene and are responsible for the slow acetylation rate. Polymerase chain reaction amplification assay for each allele was optimized separately by varying the concentration of MgCl2 and the 0.75, 1.5, and 1.5 were the optimized concentration for each of the M1, M2, and M3 alleles, as shown in Figures 4, 5, and 6, respectively. These PCR-based method and RFLP method in comparison with other methods for NAT2 genotyping are considered good ones because these methods are inexpensive, more steady and feasible for large-scale genotyping, reproducible, and less invasive. Furthermore, the external variables and/or patient’s disease status did not influence the results of these methods.
Figure 9.

Representative gel for M1 wt and mut alleles. 1, 2, 3, and 4 represent volunteer’s number. M indicates marker; mut, mutant; wt, wild.
Figure 10.

Representative gel for M2 wt and mut alleles. 4, 5, 7, 13, and 9 represent volunteer’s number. M indicates marker; mut, mutant; wt, wild.
Figure 11.

Representative gel for M2 wt and mut alleles. 4, 5, 7, 13, and 9 represent volunteer’s number. M indicates marker; mut, mutant; wt, wild,
These 3 NAT2-specific alleles M1, M2, and M3, also known as NAT2*5, NAT2*6, and NAT2*7, respectively, were determined as these alleles are responsible for 90% to 98% slow acetylators phenotype. The molecular weight for these 3 alleles was 565 bp for M1, 568 bp for M2, and 944 bp for M3.There are number of mutation at the NAT2 gene, but the detection of mutations located at 481, 590, 803, and 857 positions believed to be sufficient enough (98%) for the NAT2 genotyping. A few other common alleles were also used to find the acetylation phenotype and lead incomplete misclassification for slow phenotype. Our genotyping data segregate the participants in a clear bimodal distribution for slow and fast acetylators. This distribution is in accordance with bimodal distribution investigated and report by various studies for large number of Asian and Caucasian populations.
As a result, the DNA testing to find the frequent NAT2 mutations is considered to be the potentially powerful way for the accurate phenotyping. So, we used the PCR-based amplification assay using the specific primers for each M1, M2, and M3 wt and mut alleles to determine the NAT2 acetylation genotypically. The most frequent mut alleles M1, M2, and M3 are linked with slow acetylation phenotype and among these the presence of 2 of the mut alleles usually defines the slow acetylation phenotype whereas the presence of single copy of NAT2 fast allele is sufficient to confer the fast acetylator phenotype. In the present study, 40% of the male participants genotyped as slow acetylators while others 60% found to be the fast acetylators of the NAT2 gene (Table 4). In females, the ratio of the slow and the fast acetylators genotypes was found to be as 34% and 66%, respectively (Table 5). Irrespective of gender, 37% was found to be slow and 63% as fast acetylators (Table 6).
Table 4.
Cross-table for Phenotype (DDS)/Genotype of Male Participants.a
| Genotype (Male) | Total | |||
|---|---|---|---|---|
| DDS phenotype (male) | Fast | Slow | ||
| Fast | 60 | 4 | 64 | |
| Slow | 0 | 36 | 36 | |
| Total | 60 | 40 | 100 | |
Abbreviation: DDS, dapsone.
aκ value for male is 0.962.
Table 5.
Cross-Table for Phenotype (DDS)/Genotype of Female Participants.a
| Genotype (Female) | Total | |||
|---|---|---|---|---|
| DDS phenotype (female) | Fast | Slow | ||
| Fast | 62 | 4 | 66 | |
| Slow | 4 | 30 | 34 | |
| Total | 66 | 34 | 100 | |
Abbreviation: DDS, dapsone.
aκ value for female is 0.931.
Table 6.
Cross-Table for Phenotype (DDS)/Genotype Irrespective of Gender.
| Genotype | Total | |||
|---|---|---|---|---|
| DDS phenotype | Fast | Slow | ||
| Fast | 122 | 8 | 130 | |
| Slow | 4 | 66 | 70 | |
| Total | 126 | 74 | 200 | |
Abbreviation: DDS, dapsone.
These male and female genotyping data are used to find the percentage of concordance of genotyping method with the phenotyping methods for NAT2 enzyme. Slow acetylation phenotype for NAT2 in our present investigation was found to be 34% and is analogous to the findings for other Asian population’s research.36 The present findings are in contrast to the findings for the Europeans, and the reason for this discrepancy in Asians and Europeans is due the distribution difference of NAT2*5B mut allele, which is invariably found in Europeans and Asians for the NAT2 slow acetylation.24 Three-point mutations in NAT2 gene at 481C>T, 590G>A, and 857G>A positions on an average account for about all of the slow acetylation alleles in Asian and also of Caucasian populations, but not for African populations. Depending on the presence of allele type of NAT2 gene, these variations in gene locus classify the participants as slow or fast acetylators in bimodal distribution.37,38 There are also a chance for impaired slow acetylation phenotype, which is caused by a variety of variant or mutated alleles such as NAT2*5, NAT2*6, and NAT2*7. In many NAT2 genotyping, investigations demonstrated the existence of 3 mutated alleles (M1: C481T; M2: G590A; M3: G857A) and rarely the fourth allele (M4: G191A), all of these were associated with slow acetylation phenotype and also showed the possibility of misclassification of NAT2 genotype and its deduced phenotypes.
Distribution Frequency of NAT2 Variant Alleles
The results to determine the distribution frequency of NAT2 alleles as fast and slow acetylation rate in all male and female are shown in Tables 7 and 8, respectively. Distribution of frequency get from healthy participants did not vary significantly for male and female for all 3 NAT2 variant alleles having distribution ratio as in male 32%, 56%, and 12% while in female the ratio was 31%, 51%, and 18% for M1 (NAT2*5), M2 (NAT2*6), and M3 (NAT2*7), respectively. In our present study, the highest frequency was obtained for M2 while M3 allele found to have the lowest frequency (Tables 3 and 7), and this distribution of variant alleles frequency was also in accordance with other investigations in Asian population. In Iranian population, the NAT2*7 was found to be in the highest ratio as compared to the Caucasian population. In Korean population, the G857A single-nucleotide polymorphism present in NAT2*7 cluster is found to be much more common as compared to the other populations, including South India. The presence of 2 mut alleles considers being enough to depict low acetylation genotype. Acetylation polymorphism of the NAT2 has been documented to several allelic discrepancies.39
Table 7.
NAT2 Frequency for M1, M2, and M3 Alleles of Male Participants.
| NAT2 Allele | n | Frequency | Percentage |
|---|---|---|---|
| M1 | 26 | 0.32 | 32 |
| M2 | 45 | 0.56 | 56 |
| M3 | 10 | 0.12 | 12 |
| Total | 81 | 1.0 | 100 |
Abbreviation: NAT2, N-acetylation 2.
Table 8.
NAT2 Frequency for M1, M2, and M3 Alleles of Female Participants.
| NAT2 Allele | n | Frequency | Percentage |
|---|---|---|---|
| M1 | 25 | 0.31 | 31 |
| M2 | 41 | 0.51 | 51 |
| M3 | 14 | 0.18 | 18 |
| Total | 80 | 1.0 | 100 |
Abbreviation: NAT2, N-acetylation 2.
N-acetylation 2 acetylation polymorphism has been mostly recognized to numerous allelic discrepancies originally associated with single nucleotide substitutions at positions 481 C>T generates NAT2*5, 590 G>A generates NAT2*6, and 857 G>A generates NAT2*7 are the most common alleles associated with slow acetylation phenotype40 and were previously recognized as M1, M2, and M3, respectively. In human populations, NAT2*5, NAT2*6, NAT2*7, and NAT2*14 as well as their subtypes are recognized as the most familiar slow acetylator alleles of NAT2 polymorphisms. The NAT2*5 (M1) and NAT2*6A (M2) are the most familiar alleles in most Asian individuals. NAT2*5 and its subtypes were most common Caucasians (44%), Gabonese (41%), and among the individuals of African descent (25%-27%)41,42 whereas NAT2*6 was found to be quite evenly distributed across the different ethnic groups and NAT2*7 was more prevalent among Asians.43 The study showed no significant (P > .05) variation of alleles frequency due to gender because NAT2 acetylation is independent of gender.
Dapsone Phenotype/Genotype
The cross for phenotype and genotype with their κ concordance values is shown in Tables 4 to 6, respectively, for male, female, and both irrespective of gender. In male, genotype and DDS phenotype classified 62% individuals as fast acetylators, and discordant results obtained from 4 individuals who were categorized fast acetylators by DDS phenotype while slow by genotypically. It revealed that genotype and phenotype results may be discordant. The variation is possibly due to difference in methodology employed, imperfect relationship between reported acetylator phenotypes, and subsequent NAT2 genotypes along with discrepancies in ethnicity of studied groups.29 As well, the 36% of individuals were established as slow acetylators by both methods and no individuals deviate from both these distribution. A good relationship is established between NAT2 genotype and DDS phenotype.
Using the principle that both alleles in a person must be mutated to make the slow phenotypes, we found the overall 94% concordance between genotype and phenotype,36 subsequent to 100% sensitivity and 93.2% specificity for the genotype in correctly classifying slow acetylators. Between phenotyping and genotyping methods, an excellent concordance has been revealed by numerous reports used in classifying the slow and fast acetylators.36 This concordance has been 90% to 98% in Caucasians,30,44-46 Japanese,47 and Chinese.48 Although it has been publicized to be dependent on the incidence of at-risk genotype, yet a minute rate of genotyping misclassification could result in a significant reduction of the risk estimation.36,48 The concordance and/or discordance of NAT2 genotypes and phenotypes have been a subject of discussion and conversation and a prospective for misclassification has been renowned. However, it was emphasized the requirement of additional investigations of the rationality of NAT2 genotype and phenotype and assignments. Clearly, diverse mechanisms for slow acetylators phenotypes must be considered and measured and there is a potential of misclassification of genotypes and deduced genotypes. Depending on the use of probe drug and determination method, NAT2 phenotype commonly show overlap because of various genetic as well as environmental vibrant such as vast number and wide range of NAT2 genotypes present in the different populations.
Conclusion
The results suggested that Pakistani population could be divided as slow and fast NAT2 acetylators with high variation in the frequencies of NAT2 alleles and genotypes within Pakistani population, which could influence the drug level in plasma. Further, studies of the relationship between NAT2 genotypes and adverse drug events are required to make genotyping a helpful tool for optimizing the DDS therapeutic response and minimizing adverse drug reactions, particularly in countries with a high burden of therapeutic drugs. It could be concluded that our local population was found to be the slow as well as fast acetylator of NAT2 enzyme, both by phenotypically and genotypically. This result was in accordance to other studies conducted in the Asian populations and ratio of the male and female volunteers for slow and fast was found to be nonsignificant. Our present data will make available the basics for the therapeutic implementation in future to eradicate or minimize the drugs-related side effects.
Footnotes
Declaration of Conflicting Interests: The author(s) declared no potential conflicts of interest with respect to the research, authorship, and/or publication of this article.
Funding: The author(s) received no financial support for the research, authorship, and/or publication of this article.
ORCID iD: Muhammad Akram  https://orcid.org/0000-0002-7457-8572
References
- 1. Kawamura A, Graham J, Mushtaq A, et al. Eukaryotic arylamine N-acetyltransferase: investigation of substrate specificity by high-throughput screening. Biochem Pharmacol. 2005;69(2):347–359. [DOI] [PubMed] [Google Scholar]
- 2. Ambrosone CB, Kropp S, Yang J, Yao S, Shields PG, Chang-Claude J. Cigarette smoking, N-acetyltransferase 2 genotypes, and breast cancer risk: pooled analysis and meta-analysis. Cancer Epidemiol Biomarkers Prev. 2008;17(1):15–26. [DOI] [PubMed] [Google Scholar]
- 3. Hein DW. Acetylator genotype and arylamine-induced carcinogenesis. Biochim Biophys Acta. 1988;94(8):37–66. [DOI] [PubMed] [Google Scholar]
- 4. Akhter N, Iqbal T, Amil A. A gender wise study of arylamine N-acetyltransferase 2 (NAT2) acetylation phenotyping using sulphamethazine by high-pressure liquid chromatography (HPLC) assay. Afr J Pharm Pharmaco 2011;5(15):1739–1747. [Google Scholar]
- 5. Grant DM, Blum M, Beer M, et al. Monomorphic and polymorphic human arylamine N-acetyltransferases: a comparison of liver isozymes and expressed products of two cloned genes. Mol Pharmacol. 1991;39(2):184–191. [PubMed] [Google Scholar]
- 6. Grant DM, Hughes NC, Janezic SA, et al. Human acetyltransferase polymorphisms. Mutat Res. 1997;376(1-2):61–70. [DOI] [PubMed] [Google Scholar]
- 7. Hein DW. N-acetyltransferase SNPs: emerging concepts serve as a paradigm for understanding complexities of personalized medicine. Expert Opin Drug Met. 2009;5(4):353–366. [DOI] [PMC free article] [PubMed] [Google Scholar]
- 8. Gross M, Kruisselbrink T, Anderson K, et al. Distribution and concordance of N-acetyltransferase genotype and phenotype in an American population. Cancer Epidemiol Biomarkers Prev. 1999;8(8):683–692. [PubMed] [Google Scholar]
- 9. Hein DW. N-acetyltransferase 2 genetic polymorphism: effects of carcinogen and haplotype on urinary bladder cancer risk. Oncogene. 2006;25(2):1649. [DOI] [PMC free article] [PubMed] [Google Scholar]
- 10. Abzalov R, Nigmatullina R, Khairullina G, Garmonov SY, Shakirova LS, Evgen’ev MI. Effect of physical training on sulfamethazine acetylation rate. Bull Exp Biol Med. 2000;130(12):1141–1143. [PubMed] [Google Scholar]
- 11. Bendaly J, Doll MA, Millner LM, et al. Differences between human slow N-acetyltransferase 2 alleles in levels of 4-aminobiphenyl-induced DNA adducts and mutations. Mutat Res. 2009;671(1-2):13–19. [DOI] [PMC free article] [PubMed] [Google Scholar]
- 12. Boukouvala S, Westwood IM, Butcher NJ, Fakis G. Current trends in N-acetyltransferase research arising from the 2007 International NAT Workshop. Pharmacogenomics. 2008;9(6):765–771. [DOI] [PubMed] [Google Scholar]
- 13. Blum M, Grant DM, Demierre A, Meyer UA. N-acetylation pharmacogenetics: a gene deletion causes absence of arylamine N-acetyltransferase in liver of slow acetylator rabbits. Proc Natl Acad Sci U S A. 1989;86(23):9554–9557. [DOI] [PMC free article] [PubMed] [Google Scholar]
- 14. Ayaz L, Ercan B, Dirlik M, Atik U, Tamer L. The association between N-acetyltransferase 2 gene polymorphisms and pancreatic cancer. Cell Biochem Funct. 2008;26(3):329–333. [DOI] [PubMed] [Google Scholar]
- 15. Irshaid Y, Al-Hadidi H, Abuirjeie M, et al. N-acetylation phenotyping using dapsone in a Jordanian population. Br J Clin Pharmacol.1991;32(3):289–293. [DOI] [PMC free article] [PubMed] [Google Scholar]
- 16. Reidenberg MM, Drayer DE, Levy M, et al. Polymorphic acetylation of procainamide in man. Clin Pharmacol Ther. 1975;17(6):722–730. [DOI] [PubMed] [Google Scholar]
- 17. Khalili H, Dashti-Khavidaki S, Amini M, Mahjub R, Hajiabdolbaghi M. Is there any difference between acetylator phenotypes in tuberculosis patients and healthy subjects? Eur J Clin Pharmacol. 2010;66(3): 261–267. [DOI] [PubMed] [Google Scholar]
- 18. Lakkakula S, Pathapati RM, Chaubey G, et al. NAT2 genetic variations among South Indian populations. Human Genome Variation. 2014;1:14014. [DOI] [PMC free article] [PubMed] [Google Scholar]
- 19. Philip P, Gayed S, Rogers H, Crome P. Influence of age, sex and body weight on the dapsone acetylation phenotype. Br J Clin Pharmacol. 1987;23(6):709–713. [DOI] [PMC free article] [PubMed] [Google Scholar]
- 20. Adole PS, Kharbanda PS, Sharma S. N-acetyltransferase 2 (NAT2) gene polymorphism as a predisposing factor for phenytoin intoxication in tuberculous meningitis or tuberculoma patients having seizures – a pilot study. Indian J Med Res. 2016;143(5):581. [DOI] [PMC free article] [PubMed] [Google Scholar]
- 21. Horai Y, Ishizaki T. N-acetylation polymorphism of dapsone in a Japanese population. Br J Clin Pharmaco. 1988;25(4):487–494. [DOI] [PMC free article] [PubMed] [Google Scholar]
- 22. Singh N, Dubey S, Chinnaraj S, Golani A, Maitra A. Study of NAT2 gene polymorphisms in an Indian population. Mol Diagn Ther. 2009;13(1):49–58. [DOI] [PubMed] [Google Scholar]
- 23. Grant D, Tang B, Kalow W. A simple test for acetylator phenotype using caffeine. Br J Clin Pharmacol. 1984;17(4):459–464. [DOI] [PMC free article] [PubMed] [Google Scholar]
- 24. Sabbagh A, Langaney A, Darlu P, Gérard N, Krishnamoorthy R, Poloni ES. Worldwide distribution of NAT2 diversity: implications for NAT2 evolutionary history. BMC Genet. 2008;9:21. [DOI] [PMC free article] [PubMed] [Google Scholar]
- 25. Chapron DJ, Kramer PA, Mercik SA. Kinetic discrimination of three sulfamethazine acetylation phenotypes. Clin Pharmacol Ther. 1980;27(1):104–113. [DOI] [PubMed] [Google Scholar]
- 26. Lee E, Lee L. A simple pharmacokinetic method for separating the three acetylation phenotypes: a preliminary report. Br J Clin Pharmacol. 1982;13(3):375–378. [DOI] [PMC free article] [PubMed] [Google Scholar]
- 27. Clark DW. Genetically determined variability in acetylation and oxidation. Drugs.1985;29(4):342–375. [DOI] [PubMed] [Google Scholar]
- 28. Ng CS, Hasnat A, Al Maruf A, et al. N-acetyltransferase 2 (NAT2) genotype as a risk factor for development of drug-induced liver injury relating to antituberculosis drug treatment in a mixed-ethnicity patient group. Eur J Clin Pharmacol. 2014;70(9):1079–1086. [DOI] [PubMed] [Google Scholar]
- 29. Bakayev VV, Mohammadi F, Bahadori M, et al. Arylamine N-acetyltransferase 2 slow acetylator polymorphisms in unrelated Iranian individuals. Eur J Clin Pharmacol. 2004;60(7):467–471. [DOI] [PubMed] [Google Scholar]
- 30. Bell D, Taylor J, Butler M, et al. Genotype/phenotype discordance for human arylamine N-acetyltransferase (NAT2) reveals a new slow-acetylator allele common in African-Americans. Carcinogenesis 1993;14(8):1689–1692. [DOI] [PubMed] [Google Scholar]
- 31. Ellard G. Variations between individuals and populations in the acetylation of isoniazid and its significance for the treatment of pulmonary tuberculosis. Clin Pharmacol Ther. 1976;19(5 pt 2):610–625. [DOI] [PubMed] [Google Scholar]
- 32. Ellard G, Gammon PT, Savin J, Tan RS. Dapsone acetylation in dermatitis herpetiformis. Br J Dermatol. 1974;90(4):441–444. [DOI] [PubMed] [Google Scholar]
- 33. Lin HJ, Han C, Lin B, Hardy S. Slow acetylator mutations in the human polymorphic N-acetyltransferase gene in 786 Asians, blacks, Hispanics, and whites: application to metabolic epidemiology. Am J Hum Genet. 1993;52(4):827. [PMC free article] [PubMed] [Google Scholar]
- 34. Johns L, Houlston R. N-acetyl transferase-2 and bladder cancer risk: a meta-analysis. Environ Mol Mutagen. 2000;36(3):221–227. [DOI] [PubMed] [Google Scholar]
- 35. Meyer UA, Zanger UM. Molecular mechanisms of genetic polymorphisms of drug metabolism. Annu Rev Pharmacol Toxicol. 1997;37:269–296. [DOI] [PubMed] [Google Scholar]
- 36. Le Marchand L, Sivaraman L, Franke AA, et al. Predictors of N-acetyltransferase activity: should caffeine phenotyping and NAT2 genotyping be used interchangeably in epidemiological studies? Cancer Epidemiol Biomarkers Prev. 1996;5(6):449–455. [PubMed] [Google Scholar]
- 37. Grant DM. Molecular genetics of the N-acetyltransferases. Pharmacogenetics. 1993;3(1):45–50. [DOI] [PubMed] [Google Scholar]
- 38. Vatsis KP, Weber WW, Bell DA, et al. Nomenclature for N-acetyltransferases. Pharmacogenetics. 1995;5(1):1–17. [DOI] [PubMed] [Google Scholar]
- 39. Huang YS, Chern HD, Su WJ, et al. Polymorphism of the N-acetyltransferase 2 gene as a susceptibility risk factor for antituberculosis drug–induced hepatitis. Hepatology. 2002;35(4):883–889. [DOI] [PubMed] [Google Scholar]
- 40. Walraven JM, Zang Y, Trent JO, Hein DW. Structure/function evaluations of single nucleotide polymorphisms in human N-acetyltransferase 2. Curr Drug Metab. 2008;9(6):471–486. [DOI] [PMC free article] [PubMed] [Google Scholar]
- 41. Agundez JA. Polymorphisms of human N-acetyltransferases and cancer risk. Curr Drug Metab. 2008;9(6):520–531. [DOI] [PubMed] [Google Scholar]
- 42. Agúndez JA, Olivera M, Martínez C, Ladero JM, Benítez J. Identification and prevalence study of 17 allelic variants of the human NAT2 gene in a white population. Pharmacogenetics. 1996;6(5):423–428. [PubMed] [Google Scholar]
- 43. Walker K, Ginsberg G, Hattis D, Johns DO, Guyton KZ, Sonawane B. Genetic polymorphism in N-acetyltransferase (NAT): population distribution of NAT1 and NAT2 activity. J Toxicol Environ Health B Crit Rev. 2009;12(5-6):440–472. [DOI] [PubMed] [Google Scholar]
- 44. Blum M, Demierre A, Grant DM, et al. Molecular mechanism of slow acetylation of drugs and carcinogens in humans. Proc Natl Acad Sci U S A. 1991;88(12):5237–5241. [DOI] [PMC free article] [PubMed] [Google Scholar]
- 45. Graf T, Broly F, Hoffmann F, Probst M, Meyer UA, Howald H. Prediction of phenotype for acetylation and for debrisoquine hydroxylation by DNA-tests in healthy human volunteers. Eur J Clin Pharmacol. 1992;43(4):399–403. [DOI] [PubMed] [Google Scholar]
- 46. Hickman D, Palamanda JR, Unadkat JD, Sim E. Enzyme kinetic properties of human recombinant arylamine N-acetyltransferase 2 allotypic variants expressed in Escherichia coli. Biochem Pharmacol. 1995;50(5):697–703. [DOI] [PubMed] [Google Scholar]
- 47. Deguchi T, Mashimo M, Suzuki T. Correlation between acetylator phenotypes and genotypes of polymorphic arylamine N-acetyltransferase in human liver. J Biol Chem. 1990;265(22):12757–12760. [PubMed] [Google Scholar]
- 48. Rothman N, Hayes RB, Bi W, et al. Correlation between N-acetyltransferase activity and NAT2 genotype in Chinese males. Pharmacogenetics. 1993;3(5):250–255. [DOI] [PubMed] [Google Scholar]