

Abstract
Tau is a scaffolding protein that serves multiple cellular functions that are perturbed in neurodegenerative diseases, including Alzheimer's disease (AD) and frontotemporal dementia (FTD). We have recently shown that amyloid‐β, the second hallmark of AD, induces de novo protein synthesis of tau. Importantly, this activation was found to be tau‐dependent, raising the question of whether FTD‐tau by itself affects protein synthesis. We therefore applied non‐canonical amino acid labelling to visualise and identify newly synthesised proteins in the K369I tau transgenic K3 mouse model of FTD. This revealed massively decreased protein synthesis in neurons containing pathologically phosphorylated tau, a finding confirmed in P301L mutant tau transgenic rTg4510 mice. Using quantitative SWATH‐MS proteomics, we identified changes in 247 proteins of the de novo proteome of K3 mice. These included decreased synthesis of the ribosomal proteins RPL23, RPLP0, RPL19 and RPS16, a finding that was validated in both K3 and rTg4510 mice. Together, our findings present a potential pathomechanism by which pathological tau interferes with cellular functions through the dysregulation of ribosomal protein synthesis.
Keywords: neurodegenerative disease, non‐canonical amino acid labelling, protein synthesis, ribosomal proteins, tauopathy
Subject Categories: Neuroscience, Protein Biosynthesis & Quality Control
Introduction
Pathological accumulation of the microtubule‐associated protein tau characterises many neurodegenerative diseases collectively termed tauopathies (Goedert & Spillantini, 2011). The autosomal dominant inheritance pattern in familial tauopathies, together with the lack of an obvious phenotype in tau knockout animal models, is suggestive of a dominant gain‐of‐function pathogenic mechanism of tau (Reed et al, 1997; Ke et al, 2012). In support of this, transgenic animals that express tau in its human wild‐type (WT) form or carry pathological mutations found in familial cases of frontotemporal dementia (FTD) reproduce many pathological aspects of tauopathy (Götz et al, 2018). These include the pattern of post‐translational modifications, the subcellular localisation, accumulation and filament formation of tau, the progressive loss of synapses and neurons and the ensuing functional and cognitive impairment, that is observed in both sporadic and familial tauopathies.
We have previously shown that oligomeric preparations of amyloid‐β, a peptide that, like tau, forms insoluble aggregates in Alzheimer's disease (AD) brains, induce the de novo protein synthesis of tau via a tau‐dependent mechanism (Li & Götz, 2017). This raised the question of whether FTD‐tau itself, in the absence of amyloid‐β, affects protein translation and the de novo proteome.
To investigate this, we used a novel technique known as non‐canonical amino acid (NCAA) labelling. The underlying principle of NCAA labelling is that the newly synthesised proteins can be tagged during a defined period of time with surrogates of natural amino acids (Fig 1A; Dieterich et al, 2006). We used the methionine surrogate azidohomoalanine (AHA) that has been shown to incorporate into proteins in a variety of species and cell types (Liang et al, 2014; Ullrich et al, 2014; Erdmann et al, 2015; McClatchy et al, 2015). AHA contains an azide group as a unique bio‐orthogonal motif, which can form covalent bonds with a variety of alkyne‐bearing molecular tags in a process known as strain‐promoted azide‐alkyne cycloaddition (SPAAC; Beatty et al, 2010). Thus, newly synthesised AHA‐containing proteins can be labelled using fluorescent non‐canonical amino acid tagging (FUNCAT) and visualised using microscopy, or purified through the addition of an alkyne‐bearing affinity tag such as dibenzocyclooctyne (DBCO)‐biotin, in a method referred to as bio‐orthogonal non‐canonical amino acid tagging (BONCAT; Dieterich et al, 2006; Hinz et al, 2012; Fig 1B).
Figure 1. Establishing conditions of azidohomoalanine (AHA) labelling to examine protein synthesis in mice following intraperitoneal administration.
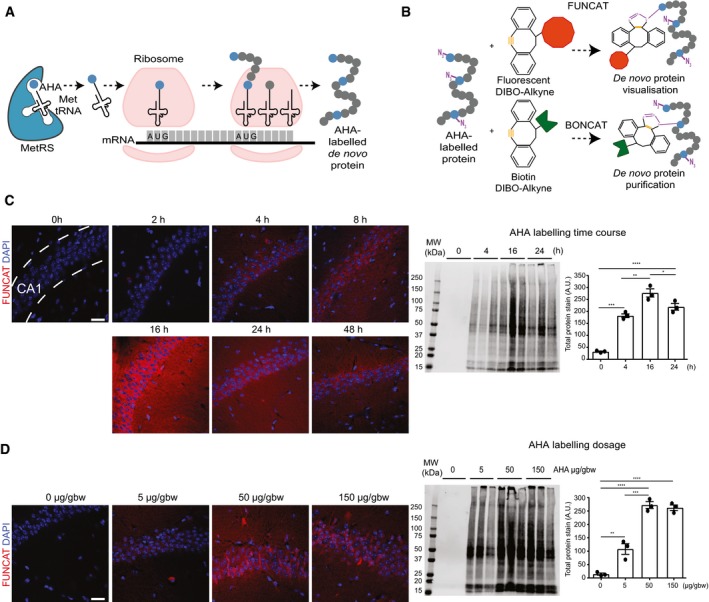
- Schematic representation of AHA labelling as a tool to identify newly synthesised proteins. De novo synthesised proteins are labelled with AHA at the amino‐terminal and internal methionine residues using the endogenous translational machinery.
- AHA‐labelled proteins can be covalently bonded through reaction of the azide group (purple) of AHA with the alkyne group (orange) of tags and either visualised using fluorescent non‐canonical amino acid tagging (FUNCAT) or purified using bio‐orthogonal non‐canonical amino acid tagging (BONCAT) for further analysis.
- FUNCAT visualisation in wild‐type (WT) mice treated for varying time periods with 50 μg AHA per gram body weight (gbw). AHA incorporation can be observed as early as 4‐h post‐injection in the CA1 region of the hippocampus and is still observed 48‐h post‐injection. Western blot analysis of AHA‐labelled proteins purified from whole hemisphere (without the cerebellum) with BONCAT reveals that maximal AHA labelling occurs approximately 16‐h post‐injection (n = 3 mice, one‐way ANOVA, Tukey's multiple comparison test).
- AHA‐labelled proteins in WT mice treated with ascending concentrations of AHA were visualised using FUNCAT. Scale bar: 40 μm. Western blot of AHA‐labelled proteins purified from whole hemisphere (without the cerebellum) using BONCAT reveals that maximal AHA labelling occurs when mice are administered 50 μg AHA/gbw (n = 3 mice, one‐way ANOVA, Tukey's multiple comparison test).
Although this novel protein labelling technique has many advantages compared with other labelling methods, such as puromycin labelling and stable isotype labelling with amino acids in cell culture (SILAC), it has not been previously used in a mouse model of neurodegeneration. Here, we detail the use of NCAA labelling in combination with FUNCAT, BONCAT and quantitative mass spectrometry to examine the de novo proteome of the K3 transgenic mouse model of tauopathy. K3 mice neuronally express K369I mutant human tau and present with a robust early‐onset tau pathology, with aggregated hyperphosphorylated tau being present throughout large parts of the brain, in association with memory and motor deficits (Ittner et al, 2008).
Our analysis demonstrated that protein synthesis was significantly decreased in neurons with high levels of pathological tau. Quantitative proteomics revealed a decrease in the synthesis of particular ribosomal protein subunits in the K3 mice compared with WT animals. These findings were also validated in a second mouse model of tauopathy, the rTg4510 mouse strain that expresses P301L mutant tau at high levels. Further to this, we also demonstrated the total levels of one of these ribosomal subunits, ribosomal protein L23 (RPL23) was decreased in K3 and rTg4510 mice, as well as in human FTD brain tissue, and that this decrease was correlated with pathological tau. Together, our data identify a mechanism by which pathological tau interferes with protein synthesis through the dysregulation of ribosomal proteins.
Results
De novo protein synthesis is decreased in neurons presenting with pathological tau phosphorylation in mouse models of tauopathy
To address the role of pathological tau in de novo protein synthesis, we first established the optimal dosing of the non‐canonical amino acid AHA in WT mice. AHA was delivered by intraperitoneal injection as this has been demonstrated to result in faster labelling rates compared to an administration through the diet (Calve et al, 2016). Using a dose range of 5–150 μg NCAA per gram body weight (gbw) and labelling times ranging from 2 to 48 h, we established that a 16‐h period with 50 μg AHA/gbw achieved maximal labelling (Fig 1C and D). These parameters were therefore used in subsequent experiments.
We next treated 5‐month‐old K3 mice and age‐matched WT littermate controls with AHA and visualised the AHA‐labelled proteins in brain slices through a FUNCAT reaction with Alexa555‐DBCO. The brain slices were counterstained with the AT8 antibody that detects tau phosphorylated at Ser202/Thr205, a marker of tau pathology (Götz et al, 2018). Our results revealed that areas in K3 mice with pronounced AT8 immunoreactivity (such as the cortex, hippocampus and amygdala) exhibited a significant decrease in FUNCAT signal intensity compared with the equivalent brain regions in WT mice, indicative of decreased de novo protein synthesis in all of these AT8‐positive regions (Fig 2A). In the striatum, a brain area with sparse tau pathology, no difference was found in new protein synthesis between the K3 and WT mice, as expected (Fig 2A).
Figure 2. Protein synthesis is decreased in neurons with AT8 tau pathology.
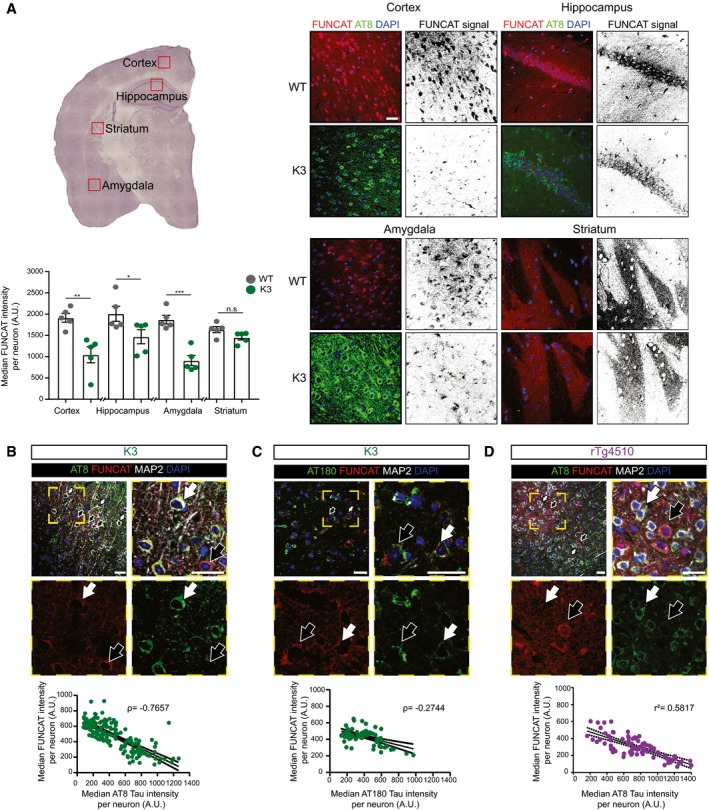
- In 5‐month‐old K3 mice, brain regions analysed by microscopy corresponding to layer 2/3 of the cortex, the CA1 region of the hippocampus and the amygdala, which contain neurons with high levels of AT8‐positivity, show significantly less FUNCAT signal compared with WT brains. In the striatum, where no AT8 immunoreactivity is observed, there is no difference in FUNCAT signal between the two genotypes (two‐way ANOVA, Sidak's multiple comparison test, n = 5 animals, three sections per animal).
- In layer 2/3 of the cortex of 5‐month‐old K3 mice, the FUNCAT signal negatively correlates with AT8 tau. Neurons with strong AT8 tau pathology and a low FUNCAT signal are indicated by white filled arrows, whereas neurons with low AT8 tau pathology and a high FUNCAT signal are indicated by black filled arrows (Spearman's correlation, ρ = −0.7657, standard error of correlation shown by black dotted line, n = 5 animals, 30 neurons per animal).
- FUNCAT signal is negatively correlated with AT180 signal in layer 2/3 of the cortex of 5‐month‐old K3 mice. Neurons with high AT180 tau pathology and a low FUNCAT signal are indicated by white filled arrows, whereas neurons with low AT8 tau pathology and a high FUNCAT signal are indicated by black filled arrows (Spearman's correlation, ρ = −0.2744, p standard error of correlation shown by a black dotted line, n = 5 animals, 15 ≤ neurons per animal).
- FUNCAT and AT8 tau signal are negatively correlated in layer 2/3 cortical neurons of 3‐month‐old rTg4510 mice. Neurons with strong AT8 tau pathology and a low FUNCAT signal are indicated by white filled arrows, whereas neurons with low AT8 tau pathology and a high FUNCAT signal are indicated by black filled arrows (Pearson's correlation, r 2 = 0.5817, standard error of correlation shown by a black dotted line, n = 3 animals, 30 neurons per animal).
To examine the potential correlation between pathological tau and de novo protein synthesis in more detail, we next performed a per neuron correlative analysis between the FUNCAT and AT8 signal in K3 cortical neurons. Using the microtubule‐associated protein 2 (MAP2) as a neuronal marker, we observed an inverse correlation between FUNCAT and the AT8 signal (ρ = −0.7657; Fig 2B). We also observed a similar inverse correlation between FUNCAT and phosphorylated tau when probing with the AT180 antibody which detects tau phosphorylated at Thr231 (Spearman's correlation ρ = −0.2744) (Fig 2C; Götz et al, 2018). To rule out the possibility that the impaired protein synthesis was a unique feature of the K3 mice, we also analysed the rTg4510 tauopathy mouse model that expresses human P301L mutant tau and presents with a more pronounced and faster progressing tau pathology (Santacruz et al, 2005). We also found that AT8 immunoreactivity and the FUNCAT signal were inversely correlated in 3‐month‐old rTg4510 mice, confirming our findings in K3 mice (Pearson's correlation r 2 = 0.5817; Fig 2D). These results were recapitulated in vitro, with human embryonic kidney (HEK293) cells overexpressing K369I human tau showing significantly less FUNCAT signal compared with those overexpressing human wild‐type tau (Fig EV1). Together, these results demonstrate that the presence of FTD‐tau results in reduced protein synthesis in three complementary tauopathy models.
Figure EV1. HEK293 cells transfected with K369I‐hTau‐EGFP have significantly decreased protein synthesis compared with EGFP or hTau‐EGFP expressing cells.
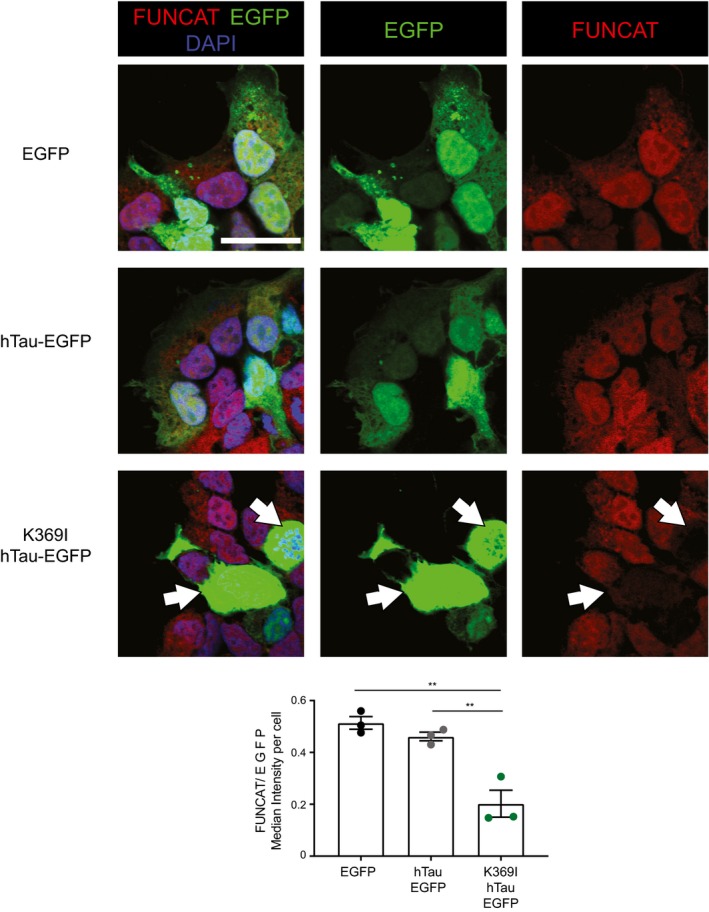
After treatment with AHA for 4 h, HEK293 cells transfected with K369I‐hTau (1N4R)‐EGFP showed a significantly lower FUNCAT signal normalised to the EGFP signal than cells transfected with hTau (1N4R)‐EGFP or the EGFP vector alone, suggesting that protein synthesis is decreased in the mutant cells (one‐way ANOVA, Tukey's multiple comparison test, n = 3 replicates). Cells with K369I‐hTau‐EGFP and low FUNCAT signal are indicated by white filled arrows.
Data information: Mean ± SEM. **P ≤ 0.01, ***P ≤ 0.001. Scale bar: 40 μm.
Quantitative de novo proteomic analysis in K3 mice reveals alterations of several cellular pathways, including ribosomal biogenesis
Although the FUNCAT analysis of K3 and rTg4510 mice revealed that protein synthesis was reduced in AT8‐positive neurons, this analysis did not determine whether tau affects protein synthesis globally or whether only particular molecular pathways and processes are altered. To address this question, we purified de novo synthesised proteins using BONCAT, a method by which biotinylated AHA‐labelled proteins are pulled down using streptavidin‐coupled beads. The de novo proteome was then identified using sequential window acquisition of all theoretical fragment ion mass spectrometry (SWATH‐MS), a quantitative mass spectrometry technique that enables the robust and reproducible proteomic profiling of complex samples (Anjo et al, 2017).
Amongst the 762 newly synthesised proteins commonly identified in 5 K3 and 5 WT samples, we found significant changes in abundance between genotype (P ≤ 0.05) for 247 proteins, with 110 presenting a fold‐change (FC) ≥ ± 1.5 (Fig 3A). Of the 247 significantly altered proteins, 190 were decreased in K3 mice compared with WT littermates, whereas only 57 were more abundant in the K3 mice (Fig 3A). Gene ontology (GO) analysis revealed that the proteins decreased in synthesis in K3 mice were associated with the biological processes of cellular component organisation and biogenesis, cytoskeleton organisation and establishment of organelle localisation and organisation (Fig 3B). Proteins that were increased in synthesis were associated with the biological processes of cellular monovalent inorganic cation homeostasis, ATP metabolic processes, organophosphate metabolic processes, substantia nigra development and the regulation of intracellular pH (Fig 3B).
Figure 3. Alteration of specific cellular pathways revealed by quantitative de novo proteomics analysis of K3 mice.
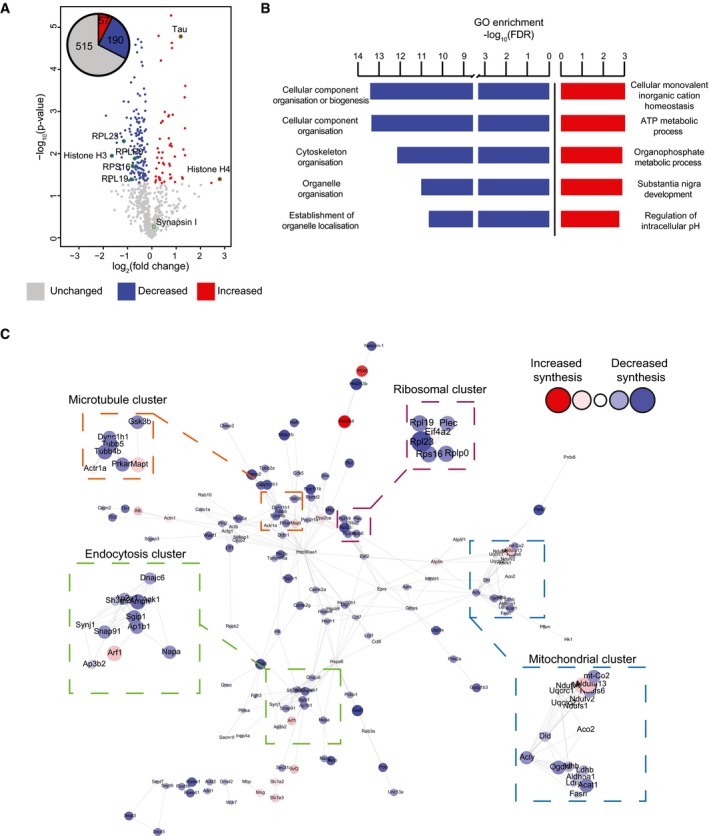
- Relative abundance of de novo synthesised proteins in 5‐month‐old K3 and WT mice. 762 proteins were quantified using SWATH‐MS across 5 K3 and 5 WT samples. The fold‐change was calculated for individual proteins by comparing the relative protein abundance in K3 vs. WT mice. Proteins displaying significantly increased synthesis in K3 mice (fold‐change > 1, P ≤ 0.05) are shown in red, whereas those exhibiting significantly decreased synthesis (fold‐change < 1, P ≤ 0.05) are shown in blue. Candidate proteins are encircled in green.
- Gene ontology (GO) analysis of proteins which were significantly altered in synthesis in K3 mice. GO analyses were performed separately for proteins exhibiting significantly increased or decreased synthesis in K3 mice using the STRING database. The 5 biological functions identified with the lowest false discovery rates (FDR) are displayed.
- STRING network analysis of proteins with significantly altered synthesis in K3 mice. Only interactions with a STRING score ≥ 0.7 are shown. Evidence of interaction is represented by the distance between nodes, with more tightly packed nodes having a higher STRING score. Proteins that did not display interactions are not shown. Node size and colour are linearly related to fold‐change. The microtubule, endocytosis, mitochondrial and ribosomal clusters contain tightly packed nodes and are depicted magnified in the inserts.
To further characterise the de novo proteomic changes observed in K3 mice, we performed a network analysis using STRING on the 247 proteins that were significantly altered in synthesis in K3 mice (Fig 3C). Our analysis revealed clusters formed by proteins associated with mitochondrial dysfunction, tau interactions, endocytosis and ribosomes (Fig 3C). Interestingly, all ribosomal proteins identified as being significantly altered in K3 mice showed a decrease in synthesis. In fact, of the 17 ribosomal protein subunits identified by SWATH‐MS, 15 showed an average decrease in synthesis in K3 mice, with 4 of these proteins, RPL23, ribosomal protein lateral stalk subunit P0 (RPLP0), ribosomal protein L19 (RPL19) and ribosomal protein S16 (RPS16) presenting with significantly decreased levels (Fig EV2B). This suggested that ribosomal protein synthesis is decreased in K3 mice.
Figure EV2. Heatmap and STRING analysis of the de novo proteome reveals alterations in protein synthesis between K3 and WT mice.
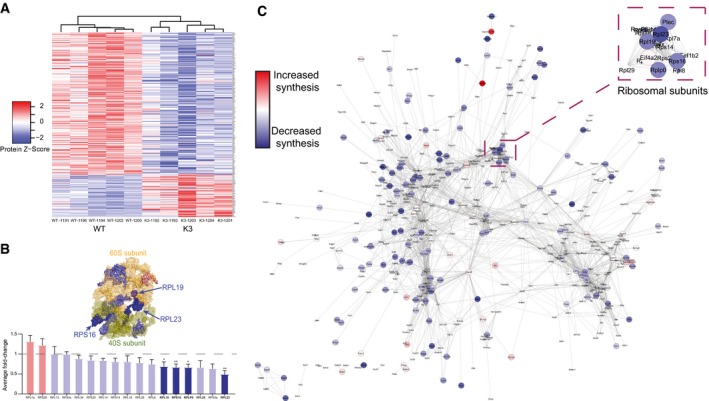
- Heatmap of the relative abundance in individual samples of 247 proteins that are significantly altered in synthesis in K3 mice compared with WT controls. Clustering analysis using average linkage shows that K3 and WT samples cluster separately.
- The average fold‐change in the synthesis of ribosomal proteins in K3 mice compared with WT mapped onto a surface representation of the structure of the ribosome complex (PDB: 3J7R). Proteins showing significantly decreased synthesis (fold‐change < 1, P ≤ 0.05) in K3 mice (RPL23, RPLP0, RPL19 & RPS16) are represented in dark blue (Student's t‐test, n = 5 animals).
- Network analysis of all de novo synthesised proteins identified in SWATH‐MS analysis. Interactions between proteins (nodes) were examined using the STRING database, with only interactions with a STRING score ≥ 0.7 being shown. Evidence of interaction is represented by the distance between nodes, with more tightly packed nodes having a higher STRING score. Proteins not displaying interactions are not shown. Proteins that showed significantly altered synthesis in K3 mice compared with WT controls (P ≤ 0.05) are shown by large nodes. The node colour is linearly related to the fold‐change. The ribosomal node is detailed in the magnification.
Ribosomal protein synthesis is decreased in K3 mice in an age‐dependent manner
Given that our de novo proteomic analysis revealed altered synthesis of distinct proteins in K3 mice, we sought to use complementary methods to validate our proteomic results by examining a set of candidate proteins. These included ribosomal proteins RPL23, RPLP0, RPL19 and RPS16, as well as histone H3, which were all shown to be decreased in synthesis in K3 mice, synapsin I, a protein that showed no significant difference in synthesis in our proteomics analysis, and histone H4, a protein shown to be significantly increased in synthesis in K3 mice (Fig 3A). Additionally, we sought to determine whether the aberrant effect of FTD‐tau on both ribosomal and overall protein synthesis varied with the progression of tau pathology. We therefore treated K3 and WT mice at either 2 or 5 months of age with AHA, because 2‐month‐old K3 mice exhibit significantly lower levels of human (K369I) tau and AT8 phosphorylation compared with their 5‐month‐old counterparts (Figs 4A and 5A, and EV4A). We next used BONCAT to purify AHA‐labelled proteins followed by Western blotting to examine the levels of newly synthesised proteins of interest. We observed that protein synthesis, on average, was decreased in K3 mice compared with WT controls, further confirming our FUNCAT analysis (Fig 4A). We also validated the hits identified in our proteomic analysis, with K3 mice showing significantly lower levels of newly synthesised RPLP0, RPL19, RPS16 and histone H3, increased synthesis of histone H4 and unaltered levels of newly synthesised synapsin I, confirming that the expression of FTD‐tau results in altered synthesis of specific proteins (Fig 4A).
Figure 4. The synthesis of select ribosomal subunits is decreased in an age‐dependent manner in K3 mice.
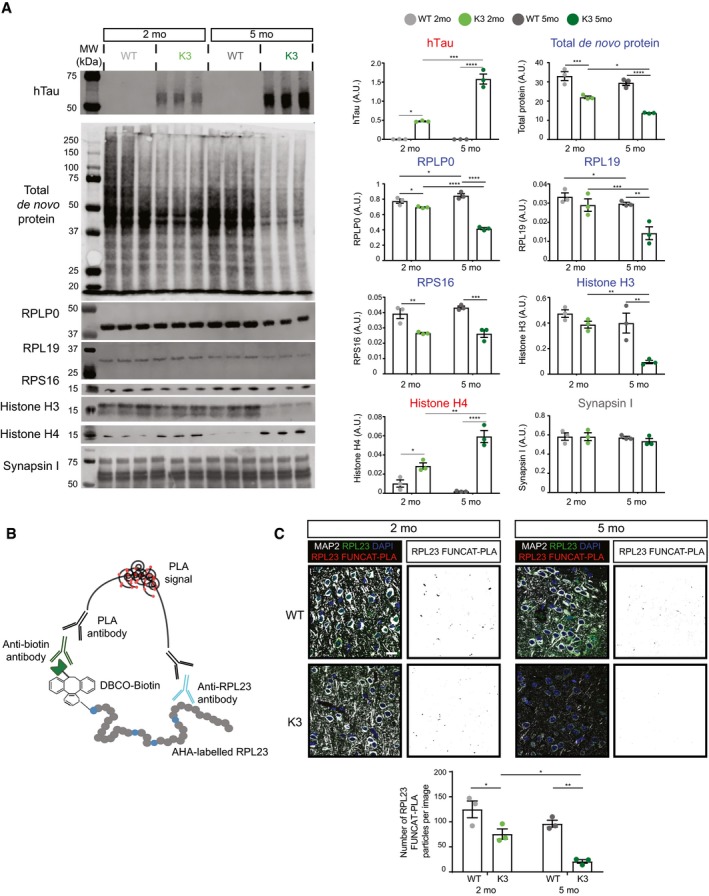
- Western blot analysis of de novo synthesised proteins demonstrates age‐dependent alterations in protein synthesis in K3 mice compared with WT controls. AHA‐labelled proteins from 2‐ and 5‐month‐old K3 and WT mice were purified using BONCAT and probed by Western blotting (BONCAT‐WB). The synthesis of ribosomal proteins RPLP0, RPL19 and RPS16, as well as histone H3, was found to be significantly decreased in K3 mice, whereas that of histone H4 was increased and that of synapsin I was unaltered (two‐way ANOVA, Sidak's multiple comparison test, n = 3 animals).
- Schematic representation of the FUNCAT‐PLA (proximity ligation assay) technique, showing that newly synthesised, AHA‐labelled RPL23 is biotinylated using DIBO‐biotin and subsequently co‐labelled with anti‐biotin and anti‐RPL23 primary antibodies. Co‐labelling is then detected using PLA antibodies, which results in a fluorescent signal when the two targets are in close proximity (i.e. < 40 nm apart).
- Synthesis of RPL23 in K3 mice is decreased in an age‐dependent manner. Compared to WT mice, significantly lower numbers of RPL23 FUNCAT‐PLA punctae are detected in layer 2/3 cortical neurons of K3 mice at both 2 and 5 months of age (two‐way ANOVA, Sidak's multiple comparison test, n = 3 animals).
Figure 5. The total abundance of RPL23 and histone H4 is altered in K3 mice and human FTD brains.
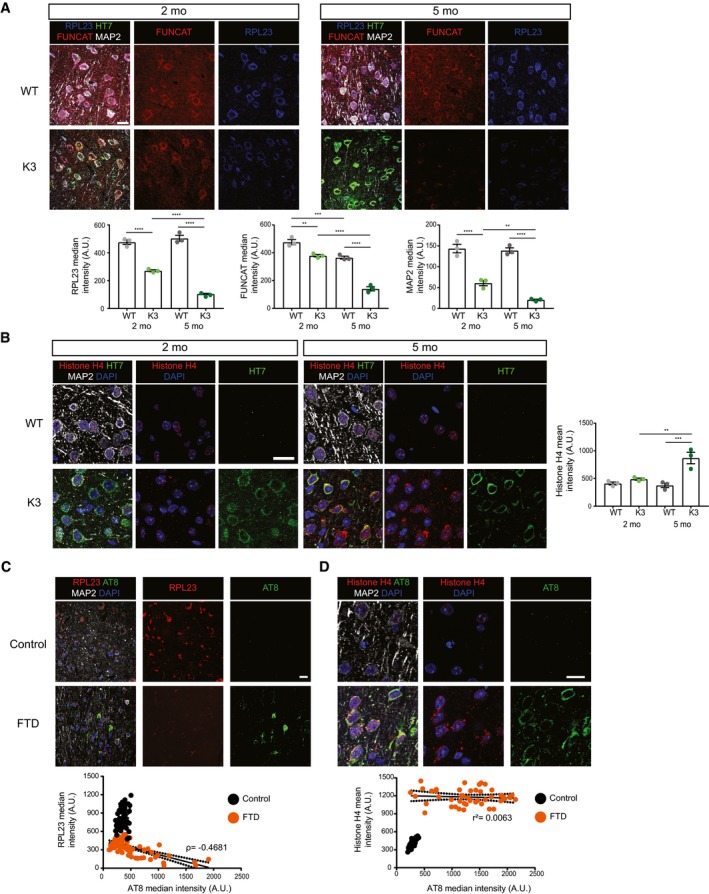
- The total abundance of RPL23 is decreased in K3 mice compared with WT controls at both 2 and 5 months of age. RPL23, FUNCAT and MAP2 signal intensities are decreased in layer 2/3 cortical neurons of K3 mice in an age‐dependent manner (two‐way ANOVA, Sidak's multiple comparison test, n = 3 animals).
- Histone H4 levels are increased in layer 2/3 of the cortex of K3 compared with WT mice at 5 months of age. This difference is not observed at 2 months of age (two‐way ANOVA, Sidak's multiple comparison test, n = 3 animals).
- Levels of RPL23 are significantly decreased in neurons from the superior frontal cortex of human FTD brains compared with healthy controls. This decrease correlates with AT8 tau (Spearman's correlation, ρ = −0.4681, standard error of correlation represented by black dots, Student's t‐test, n > 3, ≥ 15 neurons per sample).
- Histone H4 levels are significantly increased in neurons from the superior frontal cortex of human FTD brains compared with healthy controls (Student's t‐test, n = 3, ≥ 15 neurons per sample). This increase is not correlated with AT8 (Pearson's correlation r 2 = 0.0063, standard error of correlation represented by black dots).
Figure EV4. Total abundance of RPL23 and histone H4 is altered in K3 and rTg4510 mice.
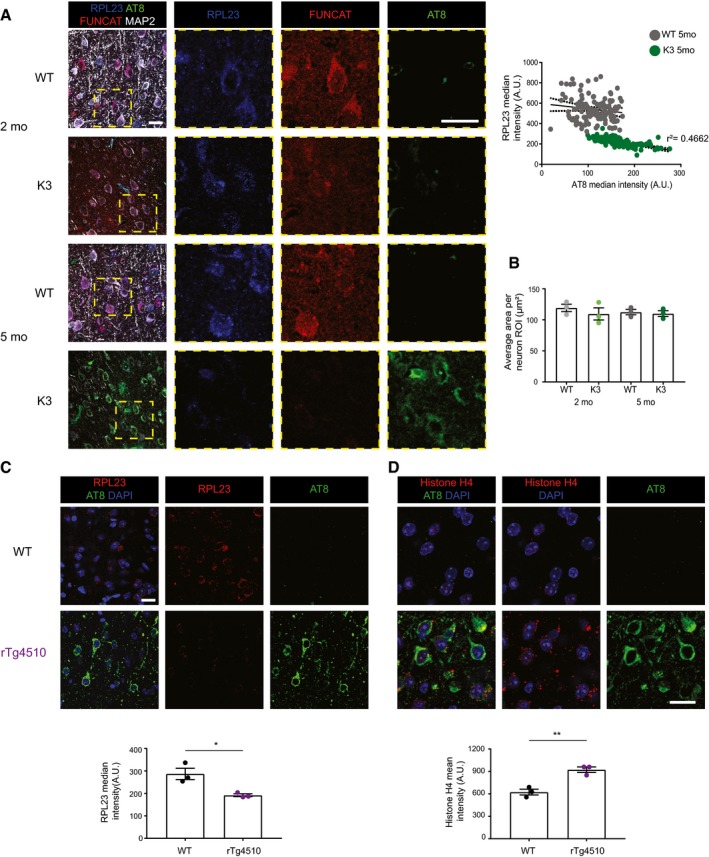
- RPL23 levels are negatively correlated with AT8 phospho‐tau in the cortex of 5‐month‐old K3 mice (Pearson's correlation, r 2 = 0.4662, standard error of correlation represented by dotted black lines, n = 3 animals, ≥ 30 neurons per animal). AT8‐positive neurons were not detected in 2‐month‐old K3 mice.
- The average area of regions of interest drawn around individual neurons using MAP2 labelling does not differ between K3 and WT mice (two‐way ANOVA, Sidak's multiple comparison test, n = 3 animals, ≥ 30 neurons per animal).
- The total abundance of RPL23 is decreased in rTg4510 mice compared with WT controls (Student's t‐test, n = 3 animals).
- Histone H4 levels are increased in layer 2/3 of the cortex of rTg4510 mice compared with WT mice (Student's t‐test, n = 3 animals).
Interestingly, when comparing 2 with 5‐month‐old K3 mice, the alterations in synthesis observed for RPLP0, RPL19, histones H3 and H4, and global protein synthesis were significantly more pronounced in the older K3 mice (Fig 4A). In support of these findings, we observed similar alterations in the synthesis of this set of proteins in rTg4510 mice, an independent tau transgenic mouse strain (Fig EV3A).
Figure EV3. The synthesis of selected ribosomal subunits is decreased in rTg4510.
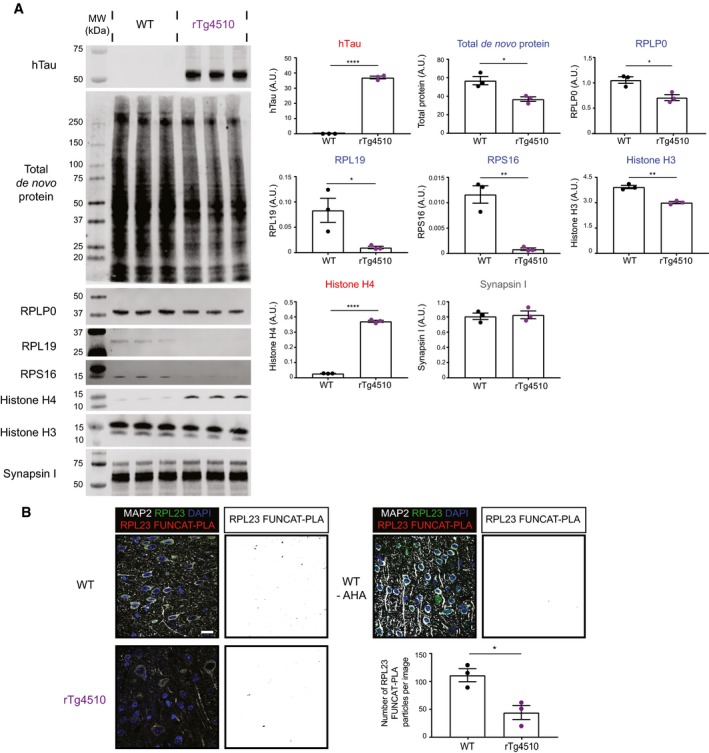
- Western blot analysis of de novo synthesised proteins reveals altered protein synthesis in rTg4510 mice compared with WT controls. AHA‐labelled proteins from rTg4510 and WT mice were purified using BONCAT and probed via Western blotting. The synthesis of the ribosomal proteins RPLP0, RPL19 and RPS16, as well as histone H3, was significantly decreased in rTg4510 mice, whereas that of histone H4 was increased, and that of synapsin I was unaltered (Student's t‐test, n = 3 animals).
- Synthesis of RPL23 is decreased in rTg4510 mice. Compared to WT mice, significantly lower numbers of RPL23 FUNCAT‐PLA punctae are detected in layer 2/3 cortical neurons of rTg4510 mice (Student's t‐test, n = 3 animals). A PBS‐treated WT control is also shown as a negative control.
As we were unable to detect RPL23 by Western blotting, we next sought to visualise de novo synthesised RPL23 by applying the FUNCAT‐proximal ligation assay (FUNCAT‐PLA) (tom Dieck et al, 2015) to brain slices. Using this technique, newly synthesised RPL23 was detected by first biotinylating AHA‐labelled proteins through reaction with DBCO‐biotin on sections, which were then incubated with anti‐biotin and anti‐RPL23 primary antibodies. In the final step, the newly synthesised RPL23 was visualised using PLA secondary antibodies (which develop a signal when the two primary antibodies are in proximity, i.e. < 40 nm apart) (Fig 4B; Zatloukal et al, 2014). This revealed a significant decrease in the RPL23‐FUNCAT‐PLA signal in cortical neurons of 2‐month‐old K3 mice compared with WT controls (Fig 4C). The decrease in RPL23 synthesis was even more pronounced at 5 months of age (Fig 4C), suggesting that the inhibiting effect of FTD‐tau on ribosomal protein synthesis increased with disease progression. In support of our findings, we were also able to demonstrate decreased RPL23 synthesis in rTg4510 mice (Fig EV3B).
The overall abundance of RPL23 and histone H4 is altered in mouse models of tauopathy as well as human FTD brains
Because our data had revealed changes in the synthesis of distinct proteins, we next sought to determine whether these changes would lead to a change in total abundance. Using immunohistochemistry, we examined the levels of two proteins: RPL23, which showed the largest decrease in synthesis of the ribosomal proteins identified in our de novo proteomic analysis (Fig EV2B), and histone H4, the protein with the largest increase in synthesis in K3 mice (Fig 3C). Using the HT7 antibody to detect human K369I tau‐expressing neurons, we were able to demonstrate that the overall abundance of RPL23 was decreased in K3 compared with WT mice even at 2 months of age, and that this effect was exacerbated at 5 months, when more human tau was present (Fig 5A). Investigating the correlation between RPL23 and tau phosphorylation levels, we observed an inverse correlation between total RPL23 and AT8 tau phosphorylation in 5‐month‐old K3 mice (Pearson's correlation r 2 = 0.4662) (Fig EV4A). Additionally, we observed an increase in total levels of histone H4 in K3 compared with WT mice at this age. Interestingly, this difference was not observed in mice at 2 months of age, further suggesting that the age‐dependent alterations in protein synthesis caused by tau had a greater effect on total protein abundance as the disease progressed (Fig 5B). In support of our findings, we observed alterations similar to K3 mice in the total levels of RPL23 and histone H4 in the rTg4510 mice (Fig EV4C and D).
Finally, we investigated whether these changes in the overall abundance of RPL23 and histone H4 were also present in human patients with FTD. By performing immunohistochemical staining of cortical sections taken from human patients with FTD and healthy controls, we found that the cortical RPL23 signal was indeed significantly decreased in patients with FTD and that this decrease correlated with AT8 tau pathology (Spearman's correlation ρ = −0.4681; Fig 5C). Although we did observe a significant increase in histone H4 abundance in FTD patients compared with controls, this was not correlated with the AT8 tau signal (Pearson's correlation r 2 = 0.0063; Fig 5D).
Together, our results demonstrate that pathological tau alters the synthesis of specific sets of proteins, including ribosomal protein subunits, leading to an overall decrease in protein synthesis as well as an alteration in the total abundance of specific proteins.
Discussion
Hyperphosphorylated tau accumulates and elicits a range of toxic effects in human and mouse brains with tauopathy. By using NCAA labelling and quantitative mass spectrometry‐based proteomic analyses, we here identified impaired ribosomal protein synthesis as a potential novel pathomechanism of tau. More specifically, we demonstrated decreased protein synthesis in neurons of two complementary transgenic mouse strains, K3 mice expressing K369I mutant tau and rTg4510 mice expressing P301L mutant tau, and two mutations identified in human patients with FTD (Hutton et al, 1998; Neumann et al, 2001). Our results revealed significant alterations to the de novo proteome, including a decreased synthesis of ribosomal proteins. Furthermore, we confirmed that specific proteins, including ribosomal protein subunits, were altered in both synthesis and abundance in K3 mice in an age‐ and mutant tau level‐dependent manner.
To identify newly synthesised proteins, we had intraperitoneally administered AHA, a surrogate of methionine. This approach has several advantages compared with more traditional protein labelling techniques such as SILAC and puromycin labelling. Unlike SILAC‐labelled proteins, de novo synthesised proteins labelled with NCAAs can be visualised and purified. In addition, unlike puromycin labelling, which truncates de novo synthesised proteins, NCAA incorporation has only minor effects on protein structure and function (Link et al, 2004; Hinz et al, 2013; Ngo et al, 2013; tom Dieck et al, 2015). Despite these advantages, NCAA labelling has not been widely used in rodents. Our study represents the first application of NCAA labelling to examine de novo protein synthesis in adult mice over a short labelling period. NCAAs have typically been delivered by supplementing diets, requiring labelling periods between 6 and 21 days (McClatchy et al, 2015; Alvarez‐Castelao et al, 2017). By delivering AHA via a single intraperitoneal injection, we achieved efficient labelling within 4 h, with maximal labelling being observed at 16‐h post‐injection. As the average half‐life of proteins in neurons is longer than 5 days, this shorter labelling period was expected to reduce the effect of protein turn over and degradation on this analysis, compared to previously established NCAA treatment paradigms (Dörrbaum et al, 2018).
In our study, by using NCAA‐based labelling and quantitative proteomics, we identified a pronounced decrease in protein synthesis in neurons containing pathologically phosphorylated tau. This is the first in vivo demonstration that human FTD‐tau decreases de novo protein synthesis. Our results further support the emerging hypothesis that tau affects components of the translational machinery and that this regulation is altered in disease (Li & Götz, 2017). Tau has been shown to interact with several components of the translational machinery, including nuclear, ribosomal and RNA‐binding proteins (Meier et al, 2016; Vanderweyde et al, 2016; Maina et al, 2018). We have previously demonstrated that amyloid‐β induces increased de novo synthesis of tau through an activation of a signalling cascade that involves the Src kinase Fyn, the serine/threonine‐directed kinase ERK and the ribosomal protein S6 (Li & Götz, 2017). Interestingly, this activation was found to be tau‐dependent, indicating that tau, which is traditionally viewed as a microtubule‐associated protein, may also play a role in regulating protein synthesis (Li & Götz, 2017). In the current study, we were able to robustly demonstrate in two tau transgenic mouse models that the expression of FTD‐tau, in the absence of amyloid β, causes a major decrease in protein synthesis, highlighting differences between AD and FTD and further supporting the notion that tau is an important protein in mediating protein translation. This decrease in protein synthesis was also shown to be dependent on the level of mutant tau. Using NCAA labelling in combination with SWATH‐MS to determine if the effect of pathological tau on protein synthesis was specific to select sets of proteins, we identified 247 proteins significantly regulated proteins, of which 190 proteins were decreased and 57 were increased in synthesis in K3 mice compared with their WT littermates. STRING network analysis of the significantly regulated proteins revealed that ≈ 69% of these proteins demonstrated strong evidence of interaction (STRING score ≥ 0.7) with at least one other significantly regulated protein. We also identified 515 proteins that were not significantly altered in synthesis between these two. Together, these results suggest that, rather than decreasing protein synthesis globally, pathological tau alters the synthesis of specific sets of proteins.
STRING network and GO analysis revealed that many of these significantly regulated proteins were associated with processes known to be affected in tauopathy, including mitochondrial function, microtubule organisation and endocytosis (David et al, 2005; Sotiropoulos et al, 2017; Polanco et al, 2018; Cummins et al, 2019), reinforcing the validity of our experimental strategy. However, given that these processes have already been the subject of intensive investigation in the context of tauopathy, we instead sought to examine in more detail the potential aberrant effect of pathological tau on ribosomal subunit synthesis, identified in our SWATH‐MS analysis.
In total, we identified 17 de novo synthesised ribosomal subunit proteins in our SWATH‐MS analysis, 4 of which were significantly reduced in synthesis in the K3 mice (Fig EV2B and C). These included three 60S ribosomal subunit proteins (RPL23, RPL19 and RPLP0) and one 40S ribosomal subunit protein (RPS16). We confirmed that the synthesis of these proteins was decreased in both K3 and rTg4510 mice using BONCAT‐WB and the FUNCAT‐PLA (Figs 4A and C, and EV3A). In addition to this, we further strengthened the validity of our findings of our de novo proteomic analysis by examining the levels of synthesis of three additional candidate proteins: histone H3 (decreased synthesis compared to WT), histone H4 (increased synthesis compared to WT) and synapsin I (unaltered synthesis compared to WT; Figs 4A and EV3A).
Together, these findings validate the findings of our de novo proteomic analysis and strengthen the hypothesis that ribosomal protein synthesis is decreased in tauopathy. Interestingly, the decrease in overall protein synthesis, as well as the decreased synthesis of RPL23, RPL19, RPLP0 and histone H3 in K3 mice, occurred in an age‐dependent manner, with significantly less synthesis observed in 5‐month‐old K3 mice compared with their younger counterparts. This age‐dependent alteration in synthesis was also observed for histone H4, with increased levels of synthesis of this protein only being observed in K3 mice at 5 months of age. Older K3 mice have a significantly higher accumulation of FTD‐tau and tau phosphorylation compared with younger mice, which provides supporting evidence for the view that the aberrant effect of FTD‐tau on the synthesis of specific proteins is dependent upon the accumulation of pathological tau. Another interesting observation was the presence of a slight reduction in protein synthesis observed between the two age groups in WT mice, suggesting that even under physiological conditions, protein synthesis may alter with age (Fig 5A).
Given the changes in the synthesis of distinct proteins between K3 and WT mice, we also expected to detect changes in their total abundance. The largest decrease in synthesis revealed by our de novo proteomics was observed for RPL23, an important subunit of the 60S ribosomal subunit, mediating binding of the 60S and 40S subunits through its interaction with eukaryotic initiation factor 6 (eIF6) (Klinge et al, 2011). Interestingly, RPL23 has recently been shown to interact with tau in human AD brains, but not healthy controls (Meier et al, 2016). Histone H4, on the other hand, revealed a 6.9‐fold increase in synthesis in K3 mice, representing the largest fold‐change in our proteomic analysis. Histone H4 plays a crucial role in regulating chromatin formation, with its total levels and extent of acetylation suggested to be altered in AD (Lu et al, 2015; Narayan et al, 2015).
As expected, for both RPL23 and histone H4, we observed alterations in total protein levels in both K3 and rTg4510 mice, and these reflected the differences observed in their synthesis. We also observed that changes in the abundance of RPL23 and histone H4 occurred in an age‐dependent manner in K3 mice, with RPL23 revealing an inverse correlation with AT8 levels. We further observed that RPL23 levels were decreased in human FTD tissue compared with healthy controls, and that this decrease correlated with AT8 reactivity. This suggests that the effect of tau on the synthesis of distinct proteins, such as ribosomal proteins, may also result in changes to the total abundance of at least some of these proteins.
Given the fundamental role ribosomes have in neurons, it is likely that the aberrant effect of tau on the synthesis and total abundance of even a small number of ribosomal protein subunits are detrimental to several complex neuronal processes (Slomnicki et al, 2016; Rangaraju et al, 2017). The reduction in total RPL23 levels in K3 and rTg4510 neurons as well as in human FTD brains would suggest that ribosomal numbers are decreased in the presence of pathological tau. Alternatively, however, tau may alter the ribosomal protein subunit composition within these neurons. Recently, it has been demonstrated that ribosomes are not homogenous in subunit composition, with some ribosomal subunits being absent in certain ribosomes (Shi et al, 2017). These different forms of ribosomes, which we term “ribotypes”, have also been shown to have different affinities for select mRNAs (Shi et al, 2017). We therefore postulate that in tauopathies, pathological tau may shift the ribotype composition of neurons through altering the synthesis of ribosomal subunits, which in turn may lead to an altered synthesis of specific set of proteins.
Another possible explanation for the changes in synthesis of specific sets of proteins that we observed in the K3 mice is the interaction between tau and RNA‐binding proteins such as TIA1, which has been reported to facilitate the formation of stress granules in tauopathy (Vanderweyde et al, 2016). These stress granules are believed to sequester specific mRNAs, altering the synthesis of particular sets of proteins and therefore potentially having a role in tau pathology (Vanderweyde et al, 2016; Apicco et al, 2018).
Our findings are consistent with the emerging hypothesis that protein synthesis is altered in neurodegenerative diseases with aggregation‐prone proteins. For example, in patients with Parkinson's disease, a correlation has been observed between α‐synuclein oligomers and altered mRNA levels for several ribosomal proteins (Garcia‐Esparcia et al, 2015). This included decreased RPS16 mRNA levels, a transcript for which we found the encoded protein to be downregulated in our proteomic screen. Similarly, in a mouse model of spinal muscular atrophy, the expression of survival of motor neuron protein (SMN) has been shown to alter translational dynamics (Bernabò et al, 2017), again pointing to the existence of a common pathomechanism of impaired protein synthesis in neurodegeneration. Our study contributes further to this idea by demonstrating that tau pathology affects ribosomal protein synthesis.
Here, by using NCAA‐labelling in vivo, SWATH proteomics and biochemical techniques, we have demonstrated that the presence of pathological tau impairs ribosomal protein synthesis and alters the synthesis of specific sets of proteins. Taken together, our results point to the possibility of a dysregulation of ribosomes in tauopathy, which may progressively impact the entire protein biosynthesis machinery and thereby drive neurodegeneration.
Materials and Methods
Animals and ethics
C57BL/6, K3 (Ittner et al, 2008) and rTg4510 mice and control WT littermates of mixed gender (Jackson Laboratories #024854) were used. Mice were maintained on a 12‐h light/dark cycle and provided access to food and water. All experiments were approved by and carried out in accordance with the guidelines of the Animal Ethics Committee of the University of Queensland.
Human samples and ethics
Human FTD and healthy controls samples were obtained from the New South Wales Brain Tissue Resource Centre at the University of Sydney and Sydney Brain Bank at Neuroscience Research Australia. All experiments were carried out with informed consent and were approved by and carried out in accordance with the guidelines of the Institutional Human Research Ethics Committee of the University of Queensland.
HEK293 cell transfection and non‐canonical amino acid treatment
The human embryonic kidney (HEK293T) cell line has been authenticated and tested for mycoplasma contamination. HEK293 cells were cultured in at 37°C, 5% CO2 saturated humidity incubator in Dulbecco's modified Eagle's medium (DMEM) (Thermo Fisher, 11965‐092) which was supplemented with 10% foetal bovine serum, 1% penicillin and l‐glutamine. Cells were grown on PDL‐treated coverslips. Cells were transfected at ≈ 70% confluency with 1 μg of either pEGFP‐N1, hTau‐pEGFP‐N1 or K369I hTau‐pEGFP‐N1 plasmids (Xia et al, 2016) using lipofectamine LTX (Thermo Fisher, 15338100) as per the manufacturer's instructions. Twenty‐four‐hour later, cells were treated with 4 mM AHA (Thermo Fisher, C10102) dissolved in phosphate‐buffered saline (PBS) for 4 h before being fixed with 4% paraformaldehyde.
Non‐canonical amino acid treatment of mice
The non‐canonical amino acid AHA was dissolved in PBS and injected intraperitoneally. Labelling times varied from 4 to 48 h in order to determine the best treatment protocol, and dosages were evaluated from 5 to 150 μg NCAA/gbw (gram body weight). After the desired treatment time, mice were deeply anesthetised with pentobarbitone sodium and then intracardially perfused with 25 ml PBS. Subsequently, the brains were dissected, with one hemisphere being processed for immunohistochemistry and FUNCAT and the other for BONCAT.
FUNCAT and immunohistochemical analysis
PBS‐perfused brain hemispheres were fixed in 4% paraformaldehyde and stored into cryoprotectant solution (30% glycerol and 30% ethylene glycol in PBS). Following this, 25‐μm‐thick free‐floating sections were cut between Bregma −1.34 and −2.06 μm using a vibratome (Leica VT1000). In order to detect protein synthesis, both HEK293 grown on coverslips, and mouse brain sections were then blocked in blocking solution (1% bovine serum albumin and 0.05% Tween in PBS) for 1 h at room temperature. To detect NCAA‐labelled proteins via FUNCAT, sections were incubated with 6.25 μM Alexa555‐DIBO (Thermo Fisher, C20021) in blocking solution overnight at 4°C under constant agitation.
Tau phosphorylated at Ser202/Thr205 was detected using the AT8 antibody (Thermo Fisher, MN1020, 1:500). Human tau was detected using the HT7 antibody (Thermo Fisher, MN1000, 1:500). MAP2 was detected using a chicken anti‐MAP2 antibody (Abcam, ab5392, 1:1,000), while RPL23 was detected using a rabbit anti‐RPL23 antibody (Proteintech, 16086‐1‐AP, 1:500). Histone H4 was detected using a rabbit anti‐histone H4 antibody (Proteintech, 16047‐1‐AP, 1:500). All primary antibody incubations were performed in blocking solution overnight at 4°C under constant agitation. Alexa405 (Thermo Fisher, 35500BID, 1:500), Alexa488 (Thermo Fisher, A‐11001, 1:1,000, Thermo Fisher, A‐11008, 1:1,000), Alexa555 (Thermo Fisher, A‐21429, 1:1,000) and Alexa647 (Thermo Fisher, A21449, 1:1,000) secondary antibodies were used for detection as appropriate. Cell nuclei were stained with DAPI. Sections were mounted in Vector Shield (Vector Laboratories H‐1,000) and imaged using a Zeiss LSM 710 laser scanning confocal microscope. Images were analysed using ImageJ.
For analysis of human samples, 7‐μm paraffin sections of the superior frontal control of patients with FTD and healthy controls were used. These were rehydrated using xylene and antigen retrieval was performed in citrate buffer (pH 5.8) as previously described, before being stained (Nisbet et al, 2017).
Visualisation of de novo synthesised RPL23 via FUNCAT‐PLA
Free‐floating sections of 25 μm thickness from K3 and WT mice were blocked 1 h at room temperature. AHA‐labelled proteins were biotinylated by incubating the sections with 250 μM DIBO‐biotin (Click Chemistry Tools, A112) in PBS for 2 h at room temperature. Following washing with 0.05% Tween in PBS, sections were stained using the Duolink® proximal ligation assay (Merck, DUO92102), as previously described, with minor modifications (Li & Götz, 2017).Briefly, sections were blocked with Duolink® blocking solution for 1 h at 37°C and then incubated with both rabbit anti‐RPL23 (1:500) and mouse anti‐biotin (Merck, B7653, 1:1,000). The sections were then washed using Duolink® wash buffer A, after which they were incubated with Duolink® PLA probes for 1 h at 37°C and washed. The Duolink® probes were then ligated for 30 min at 37°C, and following another step of washing, the PLA signal was amplified for 100 min at 37°C. Finally, sections were washed with Duolink® wash buffer B and stained with Alexa488 anti‐rabbit and DAPI before analysis via confocal microscopy using a Zeiss LSM 710 laser scanning confocal microscope. Images were analysed using ImageJ.
Biochemical analysis and BONCAT purification
One brain hemisphere from each mouse was snap‐frozen after removing the cerebellum samples were extracted in radioimmunoprecipitation assay (RIPA) buffer (Cell Signalling, 9806) as previously described (Bodea et al, 2017). Protein concentrations were determined using the bicinchoninic acid (BCA) assay (Thermo Fisher, 23225).
In order to purify NCAA‐labelled proteins for Western blot analysis, 100 μg of each sample was labelled using BONCAT. For the detection of low abundance proteins such as RPS16 and histone H4 via Western blotting, 250 μg of each samples was used. For BONCAT, cysteine residues were first alkylated with iodoacetamide (IAA) to reduce the background observed when using strain‐promoted azide‐alkyne cycloaddition (van Geel et al, 2012). Samples were then incubated with 100 μM DIBO‐biotin at room temperature for 2 h. Biotinylated proteins were purified using 40 μg of streptavidin‐coated Dynabeads (Thermo Fisher, 11205D), with the attached proteins subsequently being detached from the beads by boiling in 1× Laemmli buffer.
Equal volumes of this elution fraction were then loaded and separated on a 10% SDS–PAGE gel and transferred to a polyvinylidene difluoride (PVDF) membrane using the Turbo Transfer System (Bio‐Rad). For total protein visualisation, the REVERT total protein stain (LI‐COR, 926‐11010) was used. For the detection of specific proteins that have been newly synthesised, membranes were first blocked with Odyssey TBS blocking buffer (LI‐COR, 927‐50000). Membranes were then separately incubated overnight at room temperature with primary antibodies for RPLP0 (Proteintech, 11290‐2‐AP, 1:500), RPL19 (Proteintech, 14701‐1‐AP, 1:500), RPS16 (Abcam, ab26159. 1:200), HT7 (1:500), histone H4 (1:250) and synapsin I (Thermo Fisher, A‐6442, 1:250) made up in Odyssey TBS blocking buffer. Proteins were then detected using either IRDye800 anti‐rabbit IgG (LI‐COR, P/N 925‐32213, 1:15,000) or IRDye680 anti‐mouse IgG (LI‐COR, P/N 925‐68070, 1: 15,000) and imaged and quantified using a LI‐COR Odyssey FC scanner.
For quantitative mass spectrometry, AHA‐labelled proteins were first purified using BONCAT. 250 μg of extract from each sample was alkylated with iodoacetamide and then incubated with 100 μM DIBO‐biotin overnight at 4°C. Biotinylated proteins were purified using 100 μg of streptavidin‐coated Dynabeads, with the beads first being washed in IP wash buffer (0.1% SDS and 0.05% Tween in tris‐buffered saline (TBS)) and then in TBS.
Sample preparation information‐dependent acquisition (IDA) and nano‐liquid chromatography tandem mass spec (nano‐LC MS/MS) and SWATH‐MS analysis
BONCAT‐purified proteins bound to beads from 5 WT and 5 K3 samples were placed in triethylammonium bicarbonate (TEAB) buffer and subsequently reduced with DTT, followed by alkylation with iodoacetamide. Samples were then digested with 80 ng of trypsin overnight. Peptides were then transferred to a new tube acidified with formic acid. Peptides were then diluted in loading buffer (2% acetonitrile, 97.9% water and 0.1% formic acid) and subjected to 1D‐IDA nano‐LC MS/MS analysis (IDA‐LC–MS/MS) and SWATH‐MS.
Data acquisition via 1D IDA
Each sample was injected onto a reverse phase trap column (Halo‐C18, 160 Å, 2.7 μm, 200 μm × 2 cm) for pre‐concentration and desalted with loading buffer. The peptide trap was then switched into line with the analytical column (Halo‐C18, 160 Å, 2.7 μm, 150 μm × 10 cm). Peptides were eluted from the column using linear solvent gradients of 5–35% of mobile phase B (99.9% acetonitrile and 0.1% formic acid). After the peptide elution, the column was cleaned with 90% mobile phase B and then equilibrated with 95% mobile phase A (99.9% water and 0.1% formic acid). The reverse phase nano‐LC eluent was subject to positive ion nano‐flow electrospray analysis in an information‐dependant acquisition mode (IDA). A time of flight (TOF)‐MS survey scan was acquired (m/z 350–1,500, 0.25 s) with the 10 most intense multiply charged ions (2+ to 5+; exceeding 150 counts per second) in the survey scan being sequentially subjected to MS/MS analysis. MS/MS spectra were accumulated for 50 ms in the mass range m/z 100–1,500 with rolling collision energy.
Data acquisition via independent acquisition (SWATH‐MS)
Each sample was prepared as above with the reverse phase nano‐LC eluent being subjected to positive ion nano‐flow electrospray analysis in a data‐independent acquisition mode (SWATH). For SWATH‐MS, m/z window sizes were determined based on precursor m/z frequencies (m/z 400–1,250) in previous IDA data (SWATH variable window acquisition, 60 windows in total). In SWATH mode, first a TOF‐MS survey scan was acquired (m/z 350–1,500, 0.05 s); then, the 60 predefined m/z ranges were sequentially subjected to MS/MS analysis. MS/MS spectra were accumulated for 60 ms in the mass range m/z 350–1,500 with rolling collision energy optimised for lowed m/z in m/z window +10%. To minimise instrument condition caused bias, SWATH data were acquired in random order for the samples with one blank run between every sample injection.
Data processing of IDA data
The ten data files generated by IDA‐MS analysis were collectively searched with ProteinPilot (v5.0) (Sciex) using the ParagonTM algorithm in thorough mode. UniProt database (171218_Mouse_unipt_Reviewed.fasta, Ref: http://www.ebi.ac.uk/pride/archive/projects/PXD013341) containing 16,944 mouse proteins (Mus musculus) and microtubule‐associated protein tau (human) (UniProtKB—P10636) was used for searching the data. Carbamidomethylation of Cys residues was selected as a fixed modification.
An unused score cut‐off was set to 1.3 (95% confidence for identification) and global protein FDR to 1%. Resultant data files were used for the generation of an ion library with further modifications as described in the following section. Proteins identified from IDA data are shown in Table EV2.
Data processing for SWATH‐MS quantification
ID‐IDA result files generated in this study were converted as an ion library file using PeakView (v2.1) (Sciex). Peptides containing the carbamidomethylation (N‐term, cysteine) and oxidation (M) were manually retained to include some of the most frequently observed peptide modifications in the ion library.
The modified master ion library and the SWATH data files were imported into PeakView (v2.1). SWATH data were extracted using following parameters: the top 6 most intense fragments of each peptide were extracted from the SWATH data sets. Modified peptides (as mentioned above) were included, and shared peptides were excluded. After data processing, peptides with confidence > 99% and FDR < 1% were used for quantitation. Following the SWATH data extraction, peptides that were also identified in PBS‐treated samples (Table EV3) were manually excluded from the final list to reflect the proteins that had been exclusively quantified in AHA‐treated samples.
The extracted protein peak areas were compared between WT and K3 treated samples using APAF in‐house statistical analysis programme. The protein peak areas were log‐transformed, normalised to the total protein peak area for each run and subjected to one sample t‐test to compare relative protein peak area between the sample groups (Table EV1).
Bioinformatic analysis SWATH‐MS data
In order to access which GOs were enriched in proteins displaying altered synthesis in K3 mice, we performed separate GO analyses using the STRING database on proteins which were significantly decreased and those which were significantly increased in synthesis in K3 mice. A network analysis was carried out using Cytoscape (v3.6.0). Data from the SWATH‐MS analysis were loaded into Cytoscape and mapped to the STRING protein query database for Mus musculus using the UniProt identifier and a confidence score cut‐off of 0.7. A protein interaction network based on the STRING interaction score was then formed from the 247 proteins that were significantly altered in abundance between the K3 and WT mice (P < 0.05) using the Edge‐weighted Spring embedded Layout. A similar STRING analysis was performed on the 762 proteins identified in the SWATH‐MS screen. The ribosome complex (PDB:3J7R) was plotted using PyMOL (v2.2.2) using surface representation of the ribosomal proteins. Fold‐change was manually mapped to ribosomal proteins identified in the SWATH‐MS screen. Heatmapper was used to generate a heatmap of all significantly altered proteins and perform a clustering analysis with each sample, using average linkage (Fig EV2A; Babicki et al, 2016).
Image analysis
In all immunohistochemical image acquisition and quantification, background levels of fluorescence were normalised to negative controls. Thus, the mean fluorescence intensities of these negative controls were used in order to set contrast and minimum black values for image preparation and for quantification, and these values were subtracted from the experimental data. For antibody staining, a control was included where the primary antibody was omitted, while for FUNCAT, a PBS‐treated control was included to control for background staining.
For most stainings, median grey intensity was used. However, for a punctate staining such as for histone H4, the mean grey intensity was used as this is a better measure for punctate stains. In experiments where region of interest analysis was performed, the median intensity was recorded across whole images, with three separate sections being imaged for each animal. For the per neuron analysis, images were taken across multiple sections with one field of view per section. MAP2 was used to draw regions of interest around individual neurons. Although MAP2 intensity was decreased in the K3 mice compared with WT controls, we could consistently define regions of interest around individual neurons as the brightness and contrast of the MAP2 staining was adapted to a point where each neuron was clearly visible in each image, regardless of the genotype. The validity of this approach was confirmed by there being no significant difference between K3 and WT mice in the average areas of neuronal ROIs drawn using MAP2, indicating no alteration in MAP2 distribution between K3 and WT mice (Fig EV4B).
For FUNCAT analysis of HEK293 cells transfected with either EGFP, hTau‐EGFP or K369I hTau‐EGFP, regions of interests were first drawn around individual cells using the EGFP signal. For each individual cell, the median FUNCAT signal was then normalised to the EGFP signal, with ≥ 10 cells being analysed per experiment.
FUNCAT‐PLA particles were counted by first applying a mask over the MAP2‐positive area to ensure that the newly synthesised RPL23 was only analysed in neurons. A threshold was then applied, and the Analyse Particles ImageJ plugin was used to count particles ≥ 0.1 μm2 in area. Image analysis was performed blinded to genotype. Western blots were analysed using the LI‐COR Light Studio software.
Statistical analysis
All statistical analysis was performed in GraphPad Prism 7.0 software using one‐way ANOVA, two‐way ANOVA or Student's t‐test, with Tukey's multiple comparison test (MCT) or Sidak's multiple comparison test being used, as appropriate. Correlations were assessed using a Pearson's or Spearman's correlation as appropriate. All values are given as mean ± standard error of the mean (SEM). Significance was defined as *P ≤ 0.05, **P ≤ 0.01, ***P ≤ 0.001, ****P ≤ 0.0001.
Author contributions
HTE, L‐GB and JG conceived and designed the experiments. Experiments were performed by HTE and JB. Imaging and data analysis were performed by HTE. Funding, mice and reagents were provided by JG. MR provided human tissue samples. HTE, L‐GB and JG wrote the manuscript.
Conflict of interest
The authors declare that they have no conflict of interest.
Supporting information
Expanded View Figures PDF
Table EV1
Table EV2
Table EV3
Source Data for Expanded View
Review Process File
Source Data for Figure 4
Acknowledgements
The authors wish to thank Tishila Palliyaguru, Linda Cumner and Trish Hitchcock for their excellent technical and research support along with Rowan Tweedale for critical reading of the manuscript. We would also like to thank Xiaomin Song, Jemma Wu and the Australian Proteomic Analysis Facility for performing the SWATH‐MS and GO analysis. This research was supported by the Estate of Dr Clem Jones AO, the State Government of Queensland, the Federal Government of Australia (ACT900116), and by grants from the Australian Research Council (ARC DP160103812). LGB is supported by the Peter Hilton Fellowship. Human tissues were received from the New South Wales Brain Tissue Resource Centre at the University of Sydney and Sydney Brain Bank at Neuroscience Research Australia, which are supported by the University of New South Wales, Neuroscience Research Australia and Schizophrenia Research Institute. The research reported in this publication was supported by the National Institute of Alcohol Abuse And Alcoholism of the National Institutes of Health under Award Number R28AA012725. The content is solely the responsibility of the authors and does not necessarily represent the official views of the National Institutes of Health.
The EMBO Journal (2019) 38: e101174
Contributor Information
Liviu‐Gabriel Bodea, Email: l.bodea@uq.edu.au.
Jürgen Götz, Email: j.goetz@uq.edu.au.
Data availability
The mass spectrometry proteomics data used in this study have been deposited to the ProteomeXchange Consortium via the PRIDE partner repository (Perez‐Riverol et al, 2019) with the data set identifier PXD013341 (https://www.ebi.ac.uk/pride/archive/projects/PXD013341).
References
- Alvarez‐Castelao B, Schanzenbächer CT, Hanus C, Glock C, tom Dieck S, Dörrbaum AR, Bartnik I, Nassim‐Assir B, Ciirdaeva E, Mueller A et al (2017) Cell‐type‐specific metabolic labeling of nascent proteomes in vivo . Nat Biotechnol 35: 1196–1201 [DOI] [PubMed] [Google Scholar]
- Anjo SI, Santa C, Manadas B (2017) SWATH‐MS as a tool for biomarker discovery: from basic research to clinical applications. Proteomics 17: 1600278 [DOI] [PubMed] [Google Scholar]
- Apicco DJ, Ash PEA, Maziuk B, LeBlang C, Medalla M, Al Abdullatif A, Ferragud A, Botelho E, Ballance HI, Dhawan U et al (2018) Reducing the RNA binding protein TIA1 protects against tau‐mediated neurodegeneration in vivo . Nat Neurosci 21: 72–80 [DOI] [PMC free article] [PubMed] [Google Scholar]
- Babicki S, Arndt D, Marcu A, Liang Y, Grant JR, Maciejewski A, Wishart DS (2016) Heatmapper: web‐enabled heat mapping for all. Nucleic Acids Res 44: W147–W153 [DOI] [PMC free article] [PubMed] [Google Scholar]
- Beatty KE, Fisk JD, Smart BP, Lu YY, Szychowski J, Hangauer MJ, Baskin JM, Bertozzi CR, Tirrell DA (2010) Live‐cell imaging of cellular proteins by a strain‐promoted azide‐alkyne cycloaddition. ChemBioChem 11: 2092–2095 [DOI] [PMC free article] [PubMed] [Google Scholar]
- Bernabò P, Tebaldi T, Groen EJN, Lane FM, Perenthaler E, Mattedi F, Newbery HJ, Zhou H, Zuccotti P, Potrich V et al (2017) In vivo translatome profiling in spinal muscular atrophy reveals a role for SMN protein in ribosome biology. Cell Rep 21: 953–965 [DOI] [PMC free article] [PubMed] [Google Scholar]
- Bodea L‐G, Evans HT, Van der Jeugd A, Ittner LM, Delerue F, Kril J, Halliday G, Hodges J, Kiernan MC, Götz J (2017) Accelerated aging exacerbates a pre‐existing pathology in a tau transgenic mouse model. Aging Cell 16: 377–386 [DOI] [PMC free article] [PubMed] [Google Scholar]
- Calve S, Witten AJ, Ocken AR, Kinzer‐Ursem TL (2016) Incorporation of non‐canonical amino acids into the developing murine proteome. Sci Rep 6: 32377 [DOI] [PMC free article] [PubMed] [Google Scholar]
- Cummins N, Tweedie A, Zuryn S, Bertran‐Gonzalez J, Götz J (2019) Disease‐associated tau impairs mitophagy by inhibiting Parkin translocation to mitochondria. EMBO J 38: e99360 [DOI] [PMC free article] [PubMed] [Google Scholar]
- David DC, Hauptmann S, Scherping I, Schuessel K, Keil U, Rizzu P, Ravid R, Dröse S, Brandt U, Müller WE et al (2005) Proteomic and functional analyses reveal a mitochondrial dysfunction in P301L tau transgenic mice. J Biol Chem 280: 23802–23814 [DOI] [PubMed] [Google Scholar]
- tom Dieck S, Kochen L, Hanus C, Heumüller M, Bartnik I, Nassim‐Assir B, Merk K, Mosler T, Garg S, Bunse S et al (2015) Direct visualization of newly synthesized target proteins in situ . Nat Methods 12: 411–414 [DOI] [PMC free article] [PubMed] [Google Scholar]
- Dieterich DC, Link AJ, Graumann J, Tirrell DA, Schuman EM (2006) Selective identification of newly synthesized proteins in mammalian cells using bioorthogonal noncanonical amino acid tagging (BONCAT). Proc Natl Acad Sci 103: 9482–9487 [DOI] [PMC free article] [PubMed] [Google Scholar]
- Dörrbaum AR, Kochen L, Langer JD, Schuman EM (2018) Local and global influences on protein turnover in neurons and glia. Elife 7: 1–24 [DOI] [PMC free article] [PubMed] [Google Scholar]
- Erdmann I, Marter K, Kobler O, Niehues S, Abele J, Müller A, Bussmann J, Storkebaum E, Ziv T, Thomas U et al (2015) Cell‐selective labelling of proteomes in Drosophila melanogaster . Nat Commun 6: 7521 [DOI] [PMC free article] [PubMed] [Google Scholar]
- Garcia‐Esparcia P, Hernández‐Ortega K, Koneti A, Gil L, Delgado‐Morales R, Castaño E, Carmona M, Ferrer I (2015) Altered machinery of protein synthesis is region‐ and stage‐dependent and is associated with α‐synuclein oligomers in Parkinson's disease. Acta Neuropathol Commun 3: 76 [DOI] [PMC free article] [PubMed] [Google Scholar]
- van Geel R, Pruijn GJM, van Delft FL, Boelens WC (2012) Preventing thiol‐yne addition improves the specificity of strain‐promoted azide‐alkyne cycloaddition. Bioconjug Chem 23: 392–398 [DOI] [PubMed] [Google Scholar]
- Goedert M, Spillantini MG (2011) Pathogenesis of the tauopathies. J Mol Neurosci 45: 425–431 [DOI] [PubMed] [Google Scholar]
- Götz J, Bodea L‐G, Goedert M (2018) Rodent models for Alzheimer disease. Nat Rev Neurosci 19: 583–598 [DOI] [PubMed] [Google Scholar]
- Hinz FI, Dieterich DC, Tirrell DA, Schuman EM (2012) Noncanonical amino acid labeling in vivo to visualize and affinity purify newly synthesized proteins in larval zebrafish. ACS Chem Neurosci 3: 40–49 [DOI] [PMC free article] [PubMed] [Google Scholar]
- Hinz F, Dieterich D, Schuman E (2013) Teaching old NCATs new tricks: using non‐canonical amino acid tagging to study neuronal plasticity. Curr Opin Chem Biol 17: 738–746 [DOI] [PMC free article] [PubMed] [Google Scholar]
- Hutton M, Lendon CL, Rizzu P, Baker M, Froelich S, Houlden H, Pickering‐Brown S, Chakraverty S, Isaacs A, Grover A et al (1998) Association of missense and 5′‐splice‐site mutations in tau with the inherited dementia FTDP‐17. Nature 393: 702–705 [DOI] [PubMed] [Google Scholar]
- Ittner LM, Fath T, Ke YD, Bi M, van Eersel J, Li KM, Gunning P, Götz J (2008) Parkinsonism and impaired axonal transport in a mouse model of frontotemporal dementia. Proc Natl Acad Sci 105: 15997–16002 [DOI] [PMC free article] [PubMed] [Google Scholar]
- Ke YD, Suchowerska AK, van der Hoven J, De Silva DM, Wu CW, van Eersel J, Ittner A, Ittner LM (2012) Lessons from tau‐deficient mice. Int J Alzheimers Dis 2012: 1–8 [DOI] [PMC free article] [PubMed] [Google Scholar]
- Klinge S, Voigts‐Hoffmann F, Leibundgut M, Arpagaus S, Ban N (2011) Crystal structure of the eukaryotic 60S ribosomal subunit in complex with initiation factor 6. Science 334: 941–948 [DOI] [PubMed] [Google Scholar]
- Li C, Götz J (2017) Somatodendritic accumulation of Tau in Alzheimer's disease is promoted by Fyn‐mediated local protein translation. EMBO J 36: 3120–3138 [DOI] [PMC free article] [PubMed] [Google Scholar]
- Liang V, Ullrich M, Lam H, Chew YL, Banister S, Song X, Zaw T, Kassiou M, Götz J, Nicholas HR (2014) Altered proteostasis in aging and heat shock response in C. elegans revealed by analysis of the global and de novo synthesized proteome. Cell Mol Life Sci 71: 3339–3361 [DOI] [PMC free article] [PubMed] [Google Scholar]
- Link AJ, Vink MKS, Tirrell DA (2004) Presentation and detection of Azide functionality in bacterial cell surface proteins. J Am Chem Soc 126: 10598–10602 [DOI] [PubMed] [Google Scholar]
- Lu X, Wang L, Yu C, Yu D, Yu G (2015) Histone acetylation modifiers in the pathogenesis of Alzheimer's disease. Front Cell Neurosci 9: 226 [DOI] [PMC free article] [PubMed] [Google Scholar]
- Maina MB, Bailey LJ, Wagih S, Biasetti L, Pollack SJ, Quinn JP, Thorpe JR, Doherty AJ, Serpell LC (2018) The involvement of tau in nucleolar transcription and the stress response. Acta Neuropathol Commun 6: 70 [DOI] [PMC free article] [PubMed] [Google Scholar]
- McClatchy DB, Ma Y, Liu C, Stein BD, Martínez‐Bartolomé S, Vasquez D, Hellberg K, Shaw RJ, Yates JR (2015) Pulsed Azidohomoalanine labeling in mammals (PALM) detects changes in liver‐specific LKB1 knockout mice. J Proteome Res 14: 4815–4822 [DOI] [PMC free article] [PubMed] [Google Scholar]
- Meier S, Bell M, Lyons DN, Rodriguez‐Rivera J, Ingram A, Fontaine SN, Mechas E, Chen J, Wolozin B, LeVine H et al (2016) Pathological tau promotes neuronal damage by impairing ribosomal function and decreasing protein synthesis. J Neurosci 36: 1001–1007 [DOI] [PMC free article] [PubMed] [Google Scholar]
- Narayan PJ, Lill C, Faull R, Curtis MA, Dragunow M (2015) Increased acetyl and total histone levels in post‐mortem Alzheimer's disease brain. Neurobiol Dis 74: 281–294 [DOI] [PubMed] [Google Scholar]
- Neumann M, Schulz‐Schaeffer W, Crowther RA, Smith MJ, Spillantini MG, Goedert M, Kretzschmar HA (2001) Pick's disease associated with the novel tau gene mutation K369I. Ann Neurol 50: 503–513 [DOI] [PubMed] [Google Scholar]
- Ngo JT, Schuman EM, Tirrell DA (2013) Mutant methionyl‐tRNA synthetase from bacteria enables site‐selective N‐terminal labeling of proteins expressed in mammalian cells. Proc Natl Acad Sci 110: 4992–4997 [DOI] [PMC free article] [PubMed] [Google Scholar]
- Nisbet RM, Van der Jeugd A, Leinenga G, Evans HT, Janowicz PW, Götz J (2017) Combined effects of scanning ultrasound and a tau‐specific single chain antibody in a tau transgenic mouse model. Brain 140: 1220–1230 [DOI] [PMC free article] [PubMed] [Google Scholar]
- Perez‐Riverol Y, Csordas A, Bai J, Bernal‐Llinares M, Hewapathirana S, Kundu DJ, Inuganti A, Griss J, Mayer G, Eisenacher M et al (2019) The PRIDE database and related tools and resources in 2019: improving support for quantification data. Nucleic Acids Res 47: D442–D450 [DOI] [PMC free article] [PubMed] [Google Scholar]
- Polanco JC, Li C, Durisic N, Sullivan R, Götz J (2018) Exosomes taken up by neurons hijack the endosomal pathway to spread to interconnected neurons. Acta Neuropathol Commun 6: 10 [DOI] [PMC free article] [PubMed] [Google Scholar]
- Rangaraju V, tom Dieck S, Schuman EM (2017) Local translation in neuronal compartments: how local is local? EMBO Rep 18: 693–711 [DOI] [PMC free article] [PubMed] [Google Scholar]
- Reed LA, Schelper RL, Solodkin A, Van Hoesen GW, Van Hoesen GW, Solodkin A, Morris JC, Trojanowski JQ, Grabowski TJ, Talbot CJ et al (1997) Autosomal dominant dementia with widespread neurofibrillary tangles. Ann Neurol 42: 564–572 [DOI] [PubMed] [Google Scholar]
- Santacruz K, Lewis J, Spires T, Paulson J, Kotilinek L, Ingelsson M, Guimaraes A, DeTure M, Ramsden M, McGowan E et al (2005) Tau suppression in a neurodegenerative mouse model improves memory function. Science 309: 476–481 [DOI] [PMC free article] [PubMed] [Google Scholar]
- Shi Z, Fujii K, Kovary KM, Genuth NR, Röst HL, Teruel MN, Barna M (2017) Heterogeneous ribosomes preferentially translate distinct subpools of mRNAs genome‐wide. Mol Cell 67: 71–83 [DOI] [PMC free article] [PubMed] [Google Scholar]
- Slomnicki LP, Pietrzak M, Vashishta A, Jones J, Lynch N, Elliot S, Poulos E, Malicote D, Morris BE, Hallgren J et al (2016) Requirement of neuronal ribosome synthesis for growth and maintenance of the Dendritic tree. J Biol Chem 291: 5721–5739 [DOI] [PMC free article] [PubMed] [Google Scholar]
- Sotiropoulos I, Galas M‐C, Silva JM, Skoulakis E, Wegmann S, Maina MB, Blum D, Sayas CL, Mandelkow E‐M, Mandelkow E et al (2017) Atypical, non‐standard functions of the microtubule associated Tau protein. Acta Neuropathol Commun 5: 91 [DOI] [PMC free article] [PubMed] [Google Scholar]
- Ullrich M, Liang V, Chew YL, Banister S, Song X, Zaw T, Lam H, Berber S, Kassiou M, Nicholas HR et al (2014) Bio‐orthogonal labeling as a tool to visualize and identify newly synthesized proteins in Caenorhabditis elegans . Nat Protoc 9: 2237–2255 [DOI] [PubMed] [Google Scholar]
- Vanderweyde T, Apicco DJ, Youmans‐Kidder K, Ash PEA, Cook C, Lummertz da Rocha E, Jansen‐West K, Frame AA, Citro A, Leszyk JD et al (2016) Interaction of tau with the RNA‐binding protein TIA1 regulates tau pathophysiology and toxicity. Cell Rep 15: 1455–1466 [DOI] [PMC free article] [PubMed] [Google Scholar]
- Xia D, Gutmann JM, Götz J (2016) Mobility and subcellular localization of endogenous, gene‐edited Tau differs from that of over‐expressed human wild‐type and P301L mutant Tau. Sci Rep 6: 29074 [DOI] [PMC free article] [PubMed] [Google Scholar]
- Zatloukal B, Kufferath I, Thueringer A, Landegren U, Zatloukal K, Haybaeck J (2014) Sensitivity and specificity of in situ proximity ligation for protein interaction analysis in a model of steatohepatitis with mallory‐denk bodies. PLoS One 9: e96690 [DOI] [PMC free article] [PubMed] [Google Scholar]
Associated Data
This section collects any data citations, data availability statements, or supplementary materials included in this article.
Supplementary Materials
Expanded View Figures PDF
Table EV1
Table EV2
Table EV3
Source Data for Expanded View
Review Process File
Source Data for Figure 4
Data Availability Statement
The mass spectrometry proteomics data used in this study have been deposited to the ProteomeXchange Consortium via the PRIDE partner repository (Perez‐Riverol et al, 2019) with the data set identifier PXD013341 (https://www.ebi.ac.uk/pride/archive/projects/PXD013341).