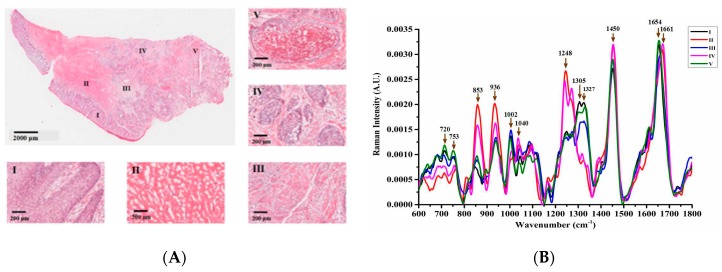
Figure 1.
(A) shows the hematoxylin and eosin (H&E) stained image of the primary squamous cell carcinoma (SCC) lesion. In that, the symbols I–V mark the different lesion area. The magnified image of the typical epidermis is marked as region I; collagen fiber reticulation in region II indicates a typical dermal layer structure; region III lies between the dermis and the mature tumor mass; the neoplasia occurring in the dermis area IV; and necrotic tissue mass is presented in region V; (B) shows normalized mean spectra of different areas for primary SCC lesion, in which the arrows point to some prominent Raman peaks.

