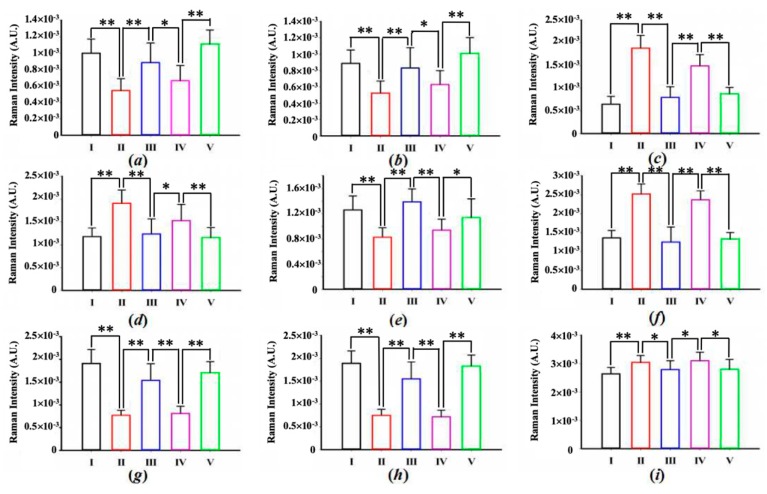
Figure 3.
Intensity measures for each kind of composition. (a) 720 cm−1; (b) 753 cm−1; (c) 853 cm–1; (d) 936 cm–1; (e) 1002 cm–1; (f) 1248 cm−1; (g) 1305 cm−1; (h) 1327 cm−1; (i) 1450 cm−1. Take the spectra intensity from region I as the reference, one way ANOVA was followed by Tukey’s honest significant difference (HSD) post hoc multiple comparison tests. The values are presented as mean + standard error of the mean (n = 20 in each group). * p < 0.05, ** p < 0.01.

