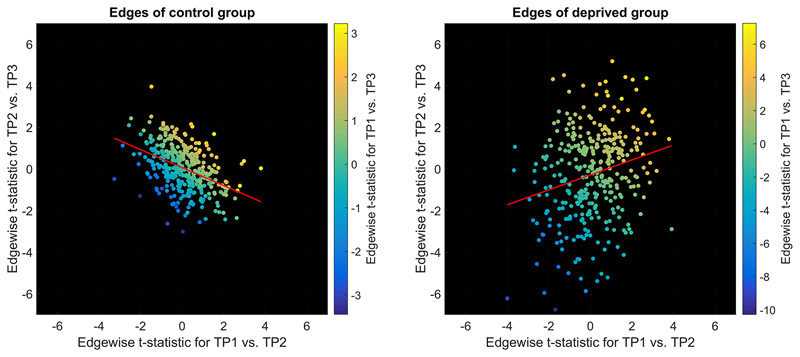
Figure 7. Correlation of the t-statistics reflecting morning-to-evening variability (TP1 vs. TP2) to t-statistics reflecting evening-to-next-morning variability (TP2 vs. TP3) indicated the impact of sleep on diurnal connectivity alterations (sign flip of the regression slope).
Least square regression lines are depicted in red. Colour indicates t-statistics for TP1 vs. TP3. TP1: first morning, TP2: evening, TP3: second morning

