Abstract
An alarm system has become essential to prevent someone from drowsiness while driving, considering the high incidence due to fatigue or drowsiness. This study offered an alternative to overcome all the limitations provided by the conventional system to detect sleepiness based on the driver's brain electrical activity using wearable electroencephalogram (EEG), which is lighter and easy to use. The EEG signals were collected using EMOTIV Epoc + and then were decomposed into narrowband frequency, such as delta, theta, alpha, and beta using DWT. The relative power, as the result of feature extraction, then were processed further by calculating its variance using the common spatial pattern (CSP) method to optimize the accuracy of extreme learning machine (ELM). Comparison of relative power between awake and drowsy state showed that during the drowsy state, theta-wave, alpha-wave, and beta-wave were tend to be higher than in the awake state. However, despite with the help of ELM, the accuracy was not too high (below 87%). The feature extraction which continued by calculating its variance using CSP algorithm before classified by ELM obtained a high accuracy, even with small amount of data training. This showed that CSP combining with ELM could be useful to shorten the time in training/calibration session, yet still, obtained high accuracy in classifying the awake state and drowsy state. The overall average accuracy of testing ranged from 91.67% to 93.75%. This study could increase the ability of EEG in detecting drowsiness that is important to prevent the risk caused by driving in a drowsy state.
Keywords: Common spatial pattern, drowsiness, electroencephalogram, extreme learning machine
Introduction
Drowsiness is a condition between awake or alert and sleep. Drowsiness is one of the highest causes in accidents. Based on the incidence of traffic accidents and deaths collected by the National Police Corps, in 2014, the number of traffic accident victims reached 95,906 victims, and 17.2% of the total was death. The data of traffic incidence showed that 83% of the accidents were caused due to human error, which consists of disorganized, indifferent/sleepy and exceeding the speed limit.[1]
An alarm system has become essential to prevent someone from drowsiness while driving, considering the high incidence of traffic accidents due to human error, such as fatigue or sleepiness, including adding sensors that placed in the car, such as a camera to monitor eye movements or sensors placed on a tire that can give an alarm when the driver is sleepy. However, the system is limited because it only applies to specific circumstances. The alternative offered to overcome all the limitations provided by the conventional system was to detect sleepiness based on the driver's brain electrical activity. The electrical activity of the brain would changes when a person starts to sleep, and this could become a promising tool for detecting the drowsiness while driving. In 2014, Awais researched to detect sleepiness based on alpha and theta wave spectrum using Fast Fourier transform.[2] Nikita Gurudath and Bryan Riley used discrete wavelet transform (DWT) to get the alpha, beta, theta, and gamma subwaves and then calculated the average value, median, variant, and standard deviation to distinguish alertness and drowsiness.[3]
This study tried to analyze electroencephalogram (EEG) signals automatically based on EEG signal in nondrowsy (awake state) and in the drowsy state with digital signal processing using a wearable EEG device. Wearable EEG was light and easy to use; hence, it would be suitable for detecting drowsiness while driving. Besides, the wearable EEG such as EPOC or MindWave Neurosky has been used widely for drowsiness detection,[4,5] eye state identification,[6,7] classifying imaginary hand movement,[8] and other brain-computer interface (BCI) applications. Compared to the medical-used device, the wearable EEG had nonsignificant differences and generated a good performance for the specific task.[7]
The EEG signals were decomposed into narrowband frequency, such as delta, theta, alpha, and beta. Then, this sub-band frequency was calculated to get its power spectral density (PSD) and its relative power. The PSD of the delta, theta, alpha, and beta would change if a person's state change from awake to drowsy.[3,9,10] The relative power of each sub-band frequency, as the result of feature extraction and then were processed further by calculating its variance using the common spatial pattern (CSP) method to enlarge the distance between drowsy and awake and could be used as a feature for the extreme learning machine (ELM). The addition of CSP was proven to increase the accuracy of the classifier since CSP maximize the variance of signals in one class while minimizing the variance of signals in the other class.[6,11,12] This study could improve the ability of EEG in detecting drowsiness that is important to prevent the risk caused by driving in a drowsy state.
Materials and Methods
Experiment protocol
BCI is a subject-dependent system where each person had different characteristic and resulted in better accuracy values if each individual was trained and tested on their recordings.[13,14] The 28 EEG signals consist of the drowsy and awake states were collected from two healthy individuals (male and female, age ranged from 20 to 25 years old who did not experience insomnia) using EMOTIV Epoc+ with 14 channel electrodes and two references (CMS/DRL noise cancellation configuration in P3/P4 locations). The sampling rate of EMOTIV Epoc+ device is 128 sampling per sequence with resolution 14 bits 1 least significant bit = 0.5 μV (16-bit ADC, 2-bit instrumental noise floor discarded) and connected by Bluetooth. The EEG data were recorded in the research laboratory of Biomedical Engineering study Program, Universitas Airlangga. The individual was asked to sit down and play a game, which was assumed as a condition of driving a car for 10 min in alert conditions and 10 min during sleepy condition. The alert condition was a condition when the individuals start the activity in the morning and 3 h after the individuals got up from sleep. Drowsiness was a condition while the individual had not slept for more than 18 h and felt drowsy. The electrode must be hydrated using saline solution every time before using the headset and make sure all the quality contact is green for proper contact of sensors on the scalp. The electrode was placed based on the EMOTIV tool shown in Figure 1.[15,16] This position represents the electrical activity of the brain in the frontal cortex (AF3, AF4, F3, F4, F7, and F8), frontocentral cortex (FC5-FC6), temporal cortex (T7-T8), parietal cortex (P7-P8), and occipital cortex (O1-O2). Data of EEG were saved in European Data Format (.EDF) and converted into. CSV to be processed further.
Figure 1.
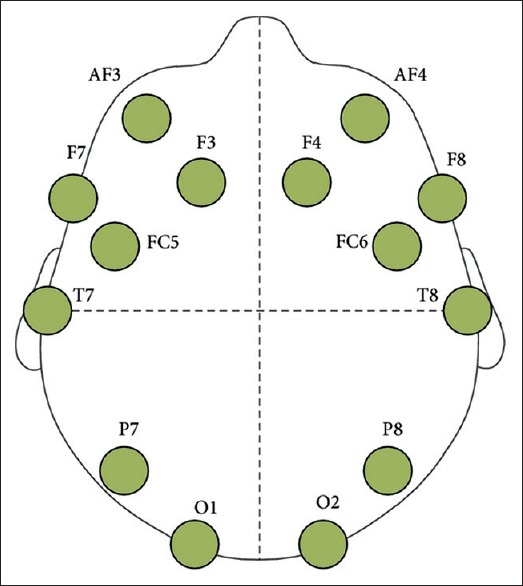
Electrode placement EPOC
Signal preprocessing
It is necessary to do the preprocessing stage before processing the data to decompose the EEG signal into a subwave based on the frequency range, namely, alpha, beta, theta, and delta using wavelet transform (DWT). Decomposition of the EEG signal into a subwave at frequency sampling 128 Hz requires four levels using Daubechies 4 as the mother wavelet, with a detailed description of each level as follows:
Level 1 is AD2 (0–32 Hz) and CD2 (32–64 Hz) which were considered as noise
Level 2 is AD3 (0–16 Hz) and CD3 (16–32 Hz) which were included in the beta frequency range
Level 3 is AD4 (0–8 Hz) and CD4 (8–16 Hz) which were included in the alpha frequency range
Level 4 is AD5 (0–4 Hz) which was included in the delta, and CD4 frequency ranges (4–8 Hz) were included in the theta frequency range.
Feature extraction and classification
Relative power ratio
Sub-band frequency selection for the features was conducted using DWT then obtained its PSD by calculating the squared magnitude of the decomposed signal (each sub-band frequency).
The afterward process was to gain the value of the relative power ratio (RPR) of each sub-band power that was the ratio between the power sub-band power to the total of all sub-band power (alpha + beta + delta + theta).

Common spatial pattern
The result of RPR value was processed further using the common spatial pattern (CSP) method to achieve better accuracy in classifying the drowsy and awake states. CSP improves the accuracy by increased the distinction of each class and was an excellent method for BCI signal classification.[8,17] This algorithm maximized the variance of one class and then minimized the variance of the other class.[6,11] This study used the frequency-based CSP algorithm by first filtering the signal into sub-bands frequency (delta, theta, alpha, and beta) and then were calculated its variance based on CSP algorithm. The CSP was obtained using the script from James Ethridge and William Weaver.[18]
Extreme learning machine
The decrease and increase in the magnitude or power of sub-band frequency have been linked to drowsiness. However, it was challenging to classify the awake state and the drowsy state using a threshold or linear classifier from the changes of frequency.[1] Therefore, the nonlinear classifier such as ELM was required to distinguish drowsy state and awake state. ELM is a single hidden layer of feedforward type neural network with L hidden neuron, activation function i (x) as the following equation:[19]

Where ai is an input weight that connected j-input nodes (xi) with i-hidden node. bi is an impact factor from the i-hidden node, while βi is an output weight which connected the i-hidden node with output node. ti is a threshold or the input target from the j-input node.
ELM was implemented to minimize the error training using Moore Penrose Pseudo Inverse by multiplied the inverse matrix H (H†) and target (T). Training was required to obtain weight values that were suitable for testing using the following algorithm:
-
Step 1: Initialize the input weight (ai) and impact factor (bi) randomly based on the suitable activation function G (x). In this study, the sigmoid function was used as the activation function.
The sigmoid activation function:

-
Step 2: Calculate all the output at the hidden neuron using the activation function and put it into matrix H


-
Step 3: Calculate the output weight (β) from the hidden layer.

While for testing was generated using the following algorithm:
Step 1: Setting the parameters obtained from the training.
Step 2: Calculate all the output at the hidden neuron using the activation function and put it into matrix H (Eqs. 4 and 5)
-
Step 3: Calculate the output node by multiplying the matrix H with output weight (β) from the training process.

The result of the output node Oj was then compared to the input target (T) to obtain the accuracy.
The classification, including training and testing, was conducted using K-fold Cross-validation (K = 3); hence, each individual was trained and tested three times with three different combinations of data classification. Thus, the accuracy was calculated from the average of each accuracy.

Training and testing in different individuals were conducted separately and respectively. BCI is a subject-dependent, which is specific and only suitable for just one particular individual,[20] so for different individual would need calibration/training session before the usage. Minimal data training would be preferable in BCI since the more data needed during training would make the individual feel uncomfortable and tired. Therefore, this study also tried to lessen the total data of training to observe the performance of the system with a small amount of data training. First, six data of training consist of three drowsy and three awake state data were used in each individual to test eight data. Then, the total data of training was lessen into four, which consist of two drowsy and two awake states were processed to test ten data. Finally, two data training were used to test the rest of the data. All of these training and testing were repeated three times (3-fold cross-validation) with three different combinations of data.
Results and Discussion
EEG data were obtained from the EEG EMOTIV EPOC with 14 channels, namely, AF3, AF4, F3, F4, F7 and F8 (frontal left and right), FC5-FC6 (frontocentral left and right), T7-T8 (temporal left), P7-P8 (parietal left and right), and O1-O2 (occipital left and right). Recordings were done by asking the individuals to play a simulation game driving on a mobile phone for approximately 10 min during drowsy and awake states as shown in Figure 2.
Figure 2.
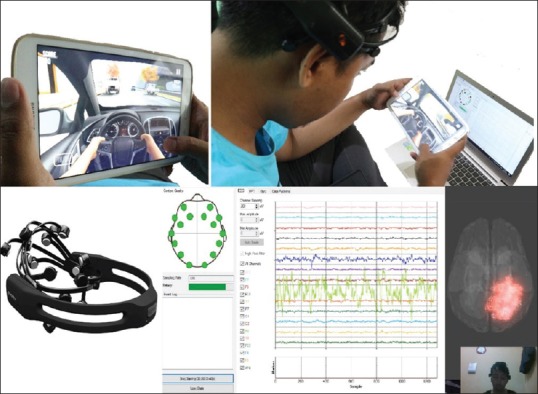
Acquisition data
As mention before that frequency related to the drowsiness; therefore, the increment or decrement of sub-band frequency needs to be processed further to obtain accurate information. EEG recording data obtained from the EMOTIV EPOC EEG device were stored in the. CSV format and then filtered into four sub-bands based on the frequency range, which was delta, theta, alpha, and beta wave using DWT. The signal required four-level decomposition and mother wavelet type Daubechies 4 (DB4) to obtain the coefficients that correspond to the frequency range of alpha, beta, delta, and theta. The following step was calculating the PSD and RPR of each sub-band frequency.
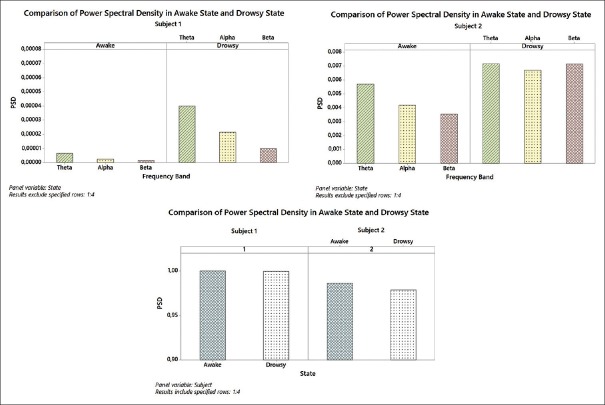
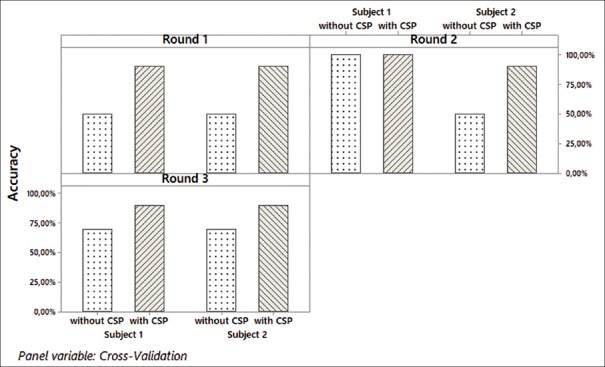
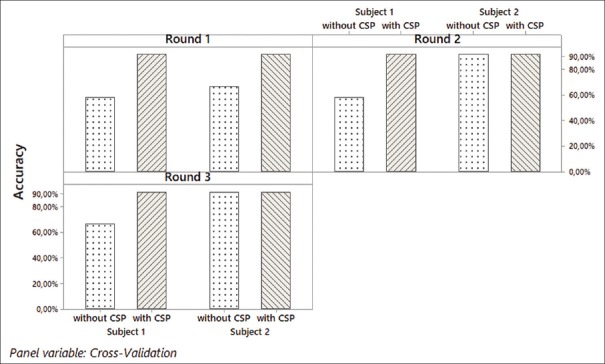
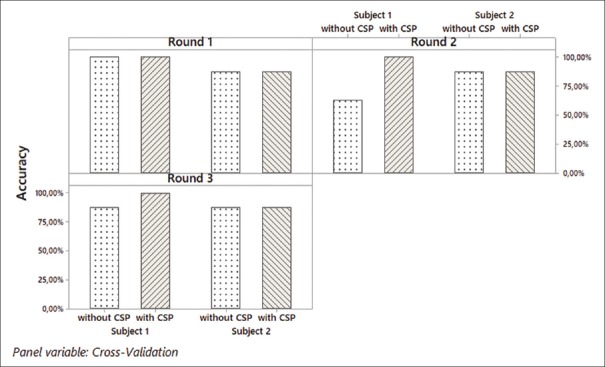
Comparison of PSD between awake and drowsy state in each sub-band frequency is shown in Figure 3. Figure 3 showed that during the drowsy state, theta, alpha, and beta were higher than in the awake state. It was challenging to design a linear threshold from the changes of frequencies[1] since the correlation between drowsy and awake states was regarded as moderate (Pearson's correlation, r = 0.5, P < 0.05). Therefore, it required the nonlinear classifier such as ELM. However, despite with the help of ELM, the accuracy was not too high (below 87%) [Figures 4-6]. Therefore, the feature needed to be processed further to obtain higher accuracy.
Figure 3.
Comparison of power spectral density in awake and drowsy states
Figure 4.
Testing accuracy using six data of the training
Figure 6.
Testing accuracy using two data of the training
The augmented of common spatial pattern algorithm to optimize the extreme learning machine
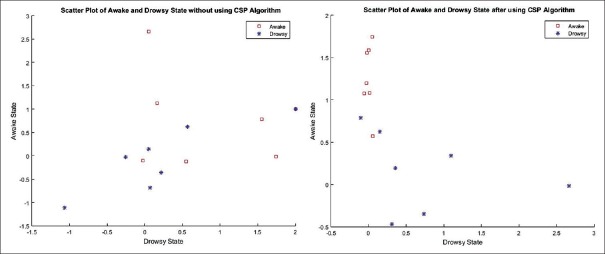
CSP algorithm was implemented in the matrix of relative power alpha, beta, theta, and delta in the drowsy and awake states. As shown in Figure 7, before the CSP algorithm was applied, the relative power features were difficult to classify but after continued the calculation using the CSP algorithm, the features started to group into two classes. Thus, the CSP method was necessary to improve the accuracy of ELM. The performances of CSP in optimizing the classification from relative power features are shown in Figures 4-6.
Figure 7.
Scatter plot of relative power features without and with the variance calculation using common spatial pattern algorithm
Figure 4 showed that CSP along with ELM classifier could increase the accuracy using six data of training to test eight data. The relative power features, which continued to calculate the variance using CSP algorithm had a better average accuracy of ELM (93.75% ± 0.00%) than the one which only using relative power spectral as the features for ELM (85.41% ± 9.55%).
Figure 5 was conducted using four data of training; consisted of two data of awake state and two data of drowsy state. The average accuracy of ELM testing from eight data that continued by calculating the variance using the CSP algorithm after going through the cross-validation process was 91.67% ± 2.89%, while the average accuracy of testing without CSP calculation algorithm was only 64.98% ± 18.38%.
Figure 5.
Testing accuracy using four data of the training
The similar behavior was shown in ELM training using two data, which consist of one drowsy state and one awake state. The average accuracy of ELM testing from 12 data feature which continued by calculating its variance using the CSP algorithm was 91.67% ± 0.00%, while the average accuracy of 12 data testing without CSP algorithm was 72.23% ± 9.63%.
Overall, it could be concluded that the ELM accuracy combined with CSP tend to give higher accuracy, even with a small amount of data. Thus, the augmented of CSP could optimize the ELM in obtaining the high accuracy.
Conclusions
In this study, we have tried to analyze and classify the drowsy state and awake state using relative PSD of sub-band delta, theta, alpha, and beta. CSP and ELM were implemented to obtain better accuracy in differentiating the relative power of the drowsy and awake states. The overall average accuracy of testing ranged from 91.67% to 93.75%, even with a small amount of data training. Minimal data training could be useful to shorten the time in training/calibration session, yet still, obtain a good accuracy in classifying the awake state and drowsy state by implementing CSP and ELM. This study could increase the ability of EEG in detecting drowsiness that is important to prevent the risk caused by driving in a drowsy state.
Financial support and sponsorship
This study was supported by the Faculty of Science and Technology, Airlangga University (Research grant no. 1893/UN3.1.8/LT/2018). The authors wish to thank the Research and Innovation Center Airlangga University and all members who participated in this study.
Conflicts of interest
There are no conflicts of interest.
BIOGRAPHIES

Osmalina Nur Rahma was born in 1991. She received her B.Eng degree in Biomedical Engineering from Airlangga University and M.Sc degree in Biomedical Engineering from University of Indonesia in 2013 and 2016, respectively. Currently, she is a lecturer in Biomedical Engineering Study Program, Department of Physics, Airlangga University, Surabaya, Indonesia. She has a great interest in biomedical application especially biomedical signal and her current research projects are mostly in digital signal processing, EEG, EMG, Brain Computer Interface.
Email: osmalina.n.rahma@fst.unair.ac.id

Akif Rahmatillah was born in Balikpapan, Indonesia, in 1986. He received his B.Eng degree in Engineering Physics (Instrumentation and Control minor) from Universitas Gadjah Mada in 2008 and the M.Eng degree in Control and Intelegent System from Bandung Institute of Technology in 2013. Currently, he is a lecturer Biomedical Engineering Study Program, Department of Physics, Airlangga University, Surabaya, Indonesia. His research interest include medical signal processing, control system and mechatronics for physical rehabilitation.
Email: akif-r@fst.unair.ac.id
References
- 1.Rohit F, Kulathumani V, Kavi R, Elwarfalli I, Kecojevic V, Nimbarte A. Real-time drowsiness detection using wearable, lightweight brain sensing headbands. IET Intell Transp Syst. 2017;11:255–63. [Google Scholar]
- 2.Djaja S, Widyastuti R, Tobing K, Lasut D, Irianto J. Gambaran Kecelakaan lalu lintas di Indonesia, Tahun 2010-2014. J Ekol Kesehat. 2016;15:30–42. [Google Scholar]
- 3.Awais M, Badruddin N, Drieberg M. Driver drowsiness detection using EEG power spectrum analysis.IEEE Region 10 Symposium. Kuala Lumpur. 2014:244–7. [Google Scholar]
- 4.Gurudath N, Bryan Riley H. Drowsy driving detection by EEG analysis using wavelet transform and K-means clustering. Procedia Comput Sci. 2014;34:400–9. [Google Scholar]
- 5.Kartsch V, Benatti S, Rossi D, Benini L. A wearable EEG-based drowsiness detection system with blink duration and alpha waves analysis. 8th International IEEE/EMBS Conference on Neural Engineering (NER), Shanghai. 2017:251–4. [Google Scholar]
- 6.Saghafi A, Tsokos CP, Farhidzadeh H. Common spatial pattern method for real-time eye state identification by using electroencephalogram signals. [Last accessed on 2018 Nov 01];IET Signal Process. 2017 11:936–41. Available from: https://www.scopus.com/inward/record.uri?eid=2-s2.0-85030532927&doi#x0026;#x003D;10.1049%2Fiet-spr. 2016.0520&partnerID=40&md5=e613ef2af3f4c7055d3d137d56ae189c . [Google Scholar]
- 7.Roesler O, Bader L, Forster J, Hayashi Y, Heßler S, Suendermann- Oeft D. Comparison of EEG devices for eye state classification. Proc. of the AIHLS. 2014. [Last accessed on 2018 Nov 02]. Available from: http://www.antikenschlacht.com/su/pdf/aihls2014.pdf .
- 8.Rahma ON, Hendradi R, Ama F. Classifying imaginary hand movement through electroencephalograph signal for neuro-rehabilitation. Walailak J Sci Technol. 2018;16:4. [Google Scholar]
- 9.Putra AE, Design AH. EEG-Based Microsleep Detector using Microcontroller. 2016 [Google Scholar]
- 10.Peiris MR, Jones RD, Davidson PR, Bones PJ. Detecting behavioral microsleeps from EEG power spectra. Conf Proc IEEE Eng Med Biol Soc. 2006;1:5723–6. doi: 10.1109/IEMBS.2006.260411. [DOI] [PubMed] [Google Scholar]
- 11.Lange G, Low CY, Johar K, Hanapiah FA, Kamaruzaman F. Classification of electroencephalogram data from hand grasp and release movements for BCI controlled prosthesis. [Last accessed on 2018 Oct 10];Procedia Technol. 2016 26:374–81. Available from: http://www.linkinghub.elsevier.com/retrieve/pii/S2212017316303954 . [Google Scholar]
- 12.Cantillo-Negrete J, Gutierrez-Martinez J, Carino-Escobar RI, Carrillo-Mora P, Elias-Vinas D. An approach to improve the performance of subject-independent BCIs-based on motor imagery allocating subjects by gender. Biomed Eng Online. 2014;13:158. doi: 10.1186/1475-925X-13-158. [DOI] [PMC free article] [PubMed] [Google Scholar]
- 13.Liu Y, Sourina O. EEG-based subject-dependent emotion recognition algorithm using fractal dimension. Conf Proc – IEEE. Int Conf Syst Man Cybern. 2014:3166–71. [Google Scholar]
- 14.Arslan MT, Eraldemir SG, Yildirim E. Subject-Dependent and Subject-Independent Classification of Mental Arithmetic and Silent Reading Tasks. 2017 [Google Scholar]
- 15.EMOTIV. EPOC User Manual. 2014. [Last accessed on 2018 Nov 02]. Avaialble from: https://www.emotiv.zendesk.com/./EPOCUserManual2014.pdf .
- 16.Kawala-Janik A, Baranowski J, Podpora M, Piatek P, Pelc M. Use of a cost-effective neuroheadset Emotiv Epoc for pattern recognition purposes. Int J Comput. 2014;13:25–33. [Google Scholar]
- 17.Szachewicz P. Poznan University of Technology, Institute of Computing Science. Poznan: 2013. Classification of Motor Imagery for Brain-Computer Interfaces. [Google Scholar]
- 18.Ethridge J, Weaver W. Common Spatial Patterns Alogarithm. Matlab Central. 2009 [Google Scholar]
- 19.Huang GB, Zhu QY, Siew CK. Extreme learning machine: Theory and applications. Neurocomputing. 2006;70:489–501. [Google Scholar]
- 20.Hatamikia S, Nasrabadi AM. Subject Independent BCI based on LTCCSP Method and GA Wrapper Optimization. 2015 22nd Iran Conf Biomed Eng ICBME. 2015 Nov;2016:405–9. [Google Scholar]


