Abstract
Creating a high-quality image with the low patient dose is one of the most important goals in medical X-ray imaging. In this study, the image quality parameters of the digital radiographic units in Tabriz city were considered and compared with the international protocols. The image quality parameters were measured at 11 high workload digital radiography (DR) imaging centers in Tabriz city, and the results were compared to DINN 6868/58 standards. All centers equipped with the direct DR units passed the spatial resolution, low contrast detectability, contrast dynamic range, and noise tests, while the computed radiography (CR) units only could pass the two last tests. The highest spatial resolution was observed 3.2 lp/mm in the DR unit while the lowest one was 1.8 lp/mm in the CR unit. The highest noise was measured to be 0.03 OD that was observed in the DR unit. The most difference between the nominal and measured peak kilovoltage and mAs was 3.1% and 6.8%, respectively. The entrance surface air kerma in all units was obtained <0.63 mGy. The measured half-value layer range was between 2.4 and 3.54 mmAl. The physical parameters of image quality such as spatial resolution, contrast, and noise are robustness quantitative parameters for the assessment of the image quality performance of the units. Therefore, measurement and control of these parameters using two-dimensional phantoms are very critical.
Keywords: Contrast, digital radiography, entrance surface air kerma, image quality, noise, spatial resolution
Introduction
The concept of image quality is a very complex and ambiguous term so that a quantitative assessment is very challenging. Image quality depends not only on the physical and technical parameters but also, most importantly, on the observer perception and experience.[1,2] In general, image quality is evaluated by visual assessment which included objective and subjective methods. None of these two methods has priority and integrity to each other.[3] The objective methods are far from real anatomical organ condition and the subjective approaches are strongly dependent on the observer experience so that the perception of the radiologists for one image can be very different. Moreover, the performance and integrity of the subjective methods strongly depend on the distinct and explicit definition of the quality criteria.[1,4] Therefore, the European Commission has changed the definition of the qualitative criteria for the subjective methods for several times.
Generally, the physical quantitative parameters for the assessment of the radiographic image quality are spatial resolution, contrast, and noise which are measured by the quality control phantom. These parameters are currently the first and most important tool for quantitative estimating and comparing the performance of the imaging units.[4]
The quality control programs for radiography units are essential procedures to produce the desirable image quality, reduce patient dose, as well as reduce the number of repeated radiographic examinations.[5,6,7,8] Digital radiography quality control guidelines have been provided by authorized international organizations such as the National Council on Radiation Protection and Measurements (NCRP) 99 and the American Association of Physicists in Medicine (AAPM) task group number 74.[5,9] It is noted that the routine quality control tests in the radiography centers are often included the analysis of output parameters such as peak kilovoltage (kVp), mAs, half-value layer (HVL), total filtration, and also reproducibility and linearity of these parameters. Many studies have been conducted about the importance of image quality control and management of patient dose.[7,8,10,11,12] In this regard, a feasible quality control program for digital and conventional radiography units was introduced in the Netherlands.[6] Other studies' findings confirmed that the skin dose was significantly reduced after the routine image quality control.[7,13] Moreover, some studies have been conducted on the quality control of the output parameters of the diagnostic radiography devices.[5,14,15] Other research works have been carried out using the subjective methods on radiographic images of the patients.[1,7,8,9,16,17] However, the results of the subjective methods are not suitable for evaluation of the unit performance.[1,18,19,20] On the other hand, image quality assessment using the standard phantoms can provide explicit consideration of the main physical image quality parameters and radiography unit performance.
The main purpose of this study was to fulfill an image quality control program in the digital radiography (DR) units in Tabriz city and to assess of the DR image quality using a two-dimensional (2D) phantom.
Materials and Methods
A total of the 11 DR units with the high workload including the eight direct DR units (A–H) and three computed radiography (CR) units (I–K) located in the clinical imaging centers in Tabriz city were considered in terms of the image quality. The spatial resolution, low contrast detectability, contrast dynamic range, and radiation field homogeneity (noise) for all units were measured using DIGRAD A + K DR 2D phantom (Pehamed, Germany).
To obtain the spatial resolution acceptance level according to the phantom manual, the air kerma on the image receptor (Kb) was measured using a semiconductor dosimeter (Piranha RTI Electronic AB, Sweden) that had been calibrated in RTI Electronics Calibration Laboratory with 172F53058 certification number. This dosimeter was also used for the measurement of the entrance surface air kerma (ESAK). To determine the spatial resolution and low contrast detectability, 16 radiology technology students who were completely blind to the study were participated in the study. The contrast dynamic range and noise were obtained using Densonorm 21E densitometer (Pehamed, Germany). To accurate measurement of the contrast dynamic range, the stepped-wedge direction on the phantom was set to be perpendicular to the longitudinal axis of the X-ray tube. The exposure and technical parameters including kVp = 80 kV, mA = 320, exposure time = 20 ms, focus film distance = 100 cm, and radiation field size = 26 cm × 26 cm were applied for all radiographic units. Since DIGRAD phantom fully meets the requirements of TECHSTREET DIN 6868/58, the results were considered with the standard criteria of “image quality assurance in X-ray diagnosis – Part 58 (DIN 6868/58): Acceptance testing for X-ray units with digital image receptor units in projection radiography.”[21] According to DIN 6868/58, the acceptance level for each tests is given below:
Spatial resolution >2.4 lp/mm for Kb ≤5 μGy and >2.8 lp/mm for Kb ≤10 μGy
Low contrast detectability: Visibility of at least the three low contrast elements
Contrast dynamic range: Separately visualization of all seven steps
Noise: Deviation of film optical density (OD) <0.2 OD.
In addition, the kVp, mAs, HVL, and total filtration of the units were considered as the exposure output parameters.
Results
A sample of radiographic image of DIGRAD A + K phantom is seen in Figure 1. Location of the different parts of the phantom related to the spatial resolution, low contrast detectability, contrast dynamic range, and noise is demonstrated in Figure 1.
Figure 1.
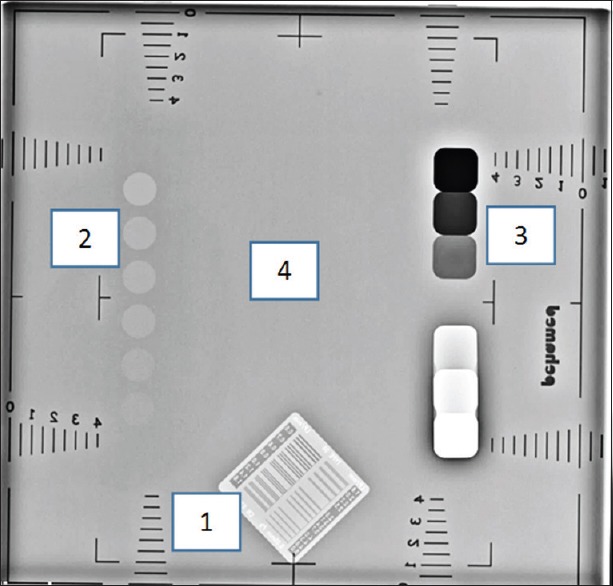
The radiographic image of DIGRAD A + K digital radiography phantom. Location of the different parts of the phantom: (1) spatial resolution, (2) low contrast detectability, (3) contrast dynamic range and (4) noise are seen
As it is seen in Figure 2, Kb values for all units were much <5 μGy with the highest amount for unit C (0.34 μGy). Therefore, based on DINN 6868/58 criteria, the spatial resolutions of the three CR units (I–K) were not acceptable [Figure 3]. The lowest spatial resolution belonged to unit K with 1.8 lp/mm, while it was 2.2 lp/mm for units I and J. On the other hand, units C, E, and G with 3.2 lp/mm showed the highest values of the spatial resolution, respectively.
Figure 2.
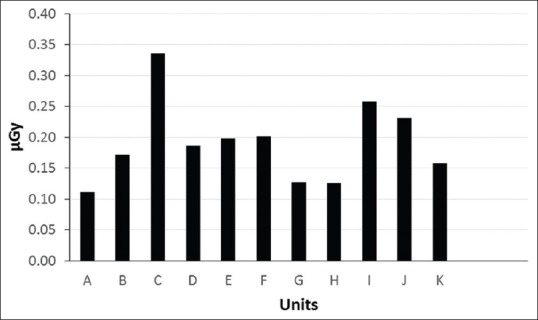
Air kerma on the image receptor (Kb) for different digital radiographic units
Figure 3.
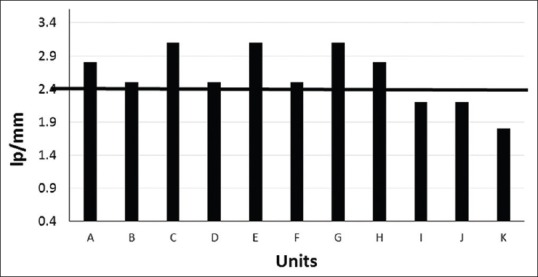
The spatial resolution for different digital radiography units. The bold horizontal line at 2.4 lp/mm demonstrates the acceptance level of spatial resolution for kb ≤5 μGy
In the low contrast detectability test, all of the six low contrast elements in the phantom image were visible using the DR units, while for J and K CR units, only five and four of the elements were seen, respectively.
The contrast dynamic range results showed that all seven contrast steps were separately seen in all units, except unit E with only five separate steps.
The noise of the units was in the range of 0.02–0.03 OD with the highest value for unit C.
Figure 4 depicts measured ESAK of the radiography units. The maximum value of ESAK was obtained for unit C (0.63 mGy).
Figure 4.
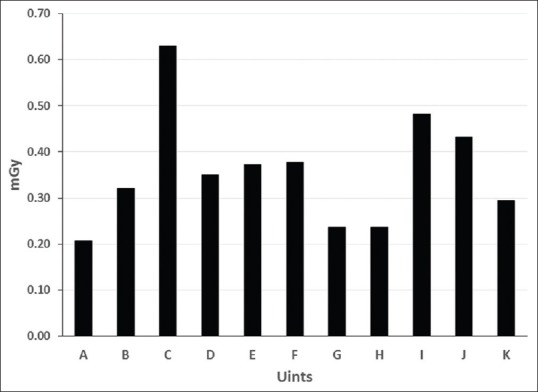
The measured entrance skin air kerma for the different digital radiography units
Figure 5 shows the measured kVp of the radiography units. The difference between the nominal kVp (80 kVp) and measured value was maximum for unit F with a value of 3.1%.
Figure 5.
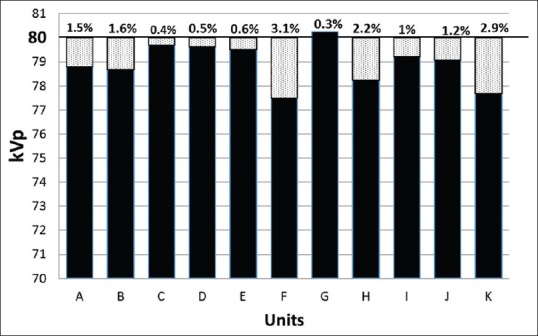
The measured peak kilovoltage and errors for different digital radiography units. Bold line across 80 peak kilovoltage shows the nominal peak kilovoltage
According to Figure 6, all units could pass mAs acceptance criteria except unit C, with a discrepancy of 6.8%.
Figure 6.
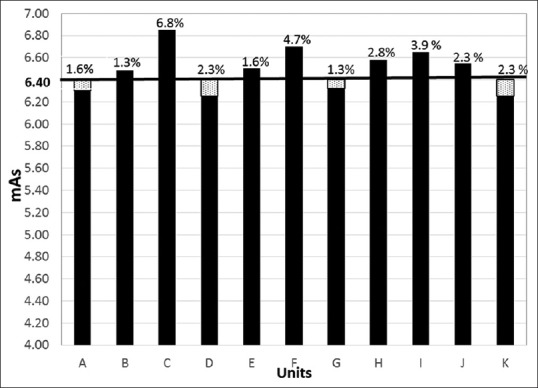
The measured mAs and errors for different digital radiography units. Bold line across 6.40 demonstrates the nominal mAs
The measured HVL and total filtration of the units are demonstrated in Figure 7. HVLs of all units were obtained within 2.4–3.54 mmAl. These results are higher than the minimum permissible HVLs recommended by the International Electro-technical Commission (IEC 2000).[22]
Figure 7.
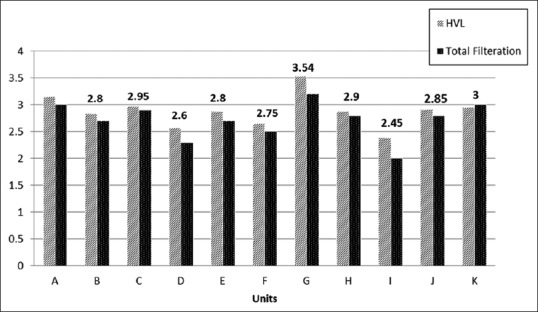
The measured half value layer and total filtration for different digital radiography units. The minimum permissible half value layer for the measured total filtration are mentioned at the top of the columns
Discussion
Diagnostic value of the radiographic images is highly dependent on the image quality. The results of the present study confirmed that the most of the radiography units successfully passed the radiographic image quality control tests. The only exception was about the spatial resolution of the three CR units. However, two of these CR units (I and J) had a little difference with the acceptance level of the spatial resolution [Figure 3]. The highest spatial resolution was obtained for units C, E, and G with 3.1 lp/mm. The high spatial resolution of unit C may be related to its high Kb, while in the case of units E and G, intrinsic performance of these units can cause the high spatial resolution. The spatial resolution of a DR unit is affected by the detector material and thickness, pixel size, and pre- and post-processing. Moreover, laser beam width affects the spatial resolution in the CR units. According to Figure 3, the spatial resolution in the CR units was found to be lower than the DRs which is in agreement with the other studies findings.[13] It can be due to the photo-stimulated phosphor plates and laser readout system characteristics.[23] The efficiency of the phosphor plates of the CR units is reduced by their frequent use and environmental conditions.[18,23]
Diagnostic-demanded spatial resolution limit depends on the diagnostic purpose and organ of interest. For instance, reduction of the pixel size to increase spatial resolution has only a little impact on the image visualization of the large organs. There is a negligible difference in better diagnosis of the thorax lesions with reducing of the pixel size from 200 to 100 μm. On the other hand, the small pixel size strongly improves the diagnostic accuracy in the breast lesions.[23]
Spatial resolution of a DR unit also depends on the detective quantum efficiency (DQE). DQE is affected by the X-ray beam energy, X-ray photon quantities in detector area, detector material, and spatial frequency. Because of the high X-ray attenuation in the low kVp range, the spatial resolution and DQE of the digital detectors are better than the high kVp.
A very important issue to be mentioned here is that during the analysis of the spatial resolution data, different amounts were reported by the observers. However, the value with the highest abundance was selected as the spatial resolution of each unit. This issue implies that although image assessment condition for all observers was similar, the results were affected by their visual characteristics. Therefore, it is concluded that even in the cases where image quality tests are performed using an objective phantom, the results are dependent on the observer's perception. Hence, it is important that each clinic according to its diagnostic goals and personnel's experiences performs an annual clinical quality control plan.
In this study, all units passed low contrast detectability test. Improvement of the image contrast causes increasing of the diagnostic details, especially in low contrast organs such as liver and kidney. Moreover, the low contrast detectability seriously depends on the system noise and background OD.[1,8] Furthermore, the contrast dynamic range of the image receptor affects the image contrast. The results showed that the 10 units had acceptable level of the contrast dynamic range.
In our study, the maximum noise among the units found to be 0.03 OD (unit D) which was considerably lower than the acceptance level of the noise (0.2 OD). Noise is the most destructive factor in the image quality that reduces the perception of the image. A slight increase in the noise causes drastic reduction of spatial resolution and contrast. However, the human visual system is almost insensitive to little changes of noise. Noise decreases with increasing the X-ray photon quantity and DQE. Noise can be reduced with the post-processing filters. However, spatial resolution and contrast of the images are suffered, and diagnostic evaluation is declined. In this study, the quantum noise and image receptor noise were measured as homogeneity of the images. However, the anatomical noise arising from anatomic organs overlying cannot be evaluated with the 2D phantoms.
According to Figure 4, the ESAK values for all units were significantly lower than the value extracted by CalDose_X 5.0 software (Departamento de Energia Nuclear, Universidade Federal de Pernambuco) which was approximately 1 mGy for a fixed 35 cm × 40 cm field size.[24] It can be related to the lower field size (26 cm × 26 cm) in our study which was selected based on the phantom dimensions. Low ESAK values of the units can lead to reduction of patient dose and consequently radiation-induced cancer risk.
Both of the image quality and patient dose are affected by kVp and mAs. According to the AAPM report TG.74, the kVp and mAs variations should be less than ±5%.[5,9] In this study, all kVp and the most mAs variations were less than this acceptance level [Figures 5 and 6]. Since the photon number is proportional to kVp4, a small change in the kVp leads to a dramatic increase in the patient dose. According to Figure 5, since the measured kVp in all units except unit G was less than the nominal kVp, patient dose reduction can be resulted. Besides, other studies confirmed that kVp reduction not only leads to patient dose decrease but also causes the image quality increase, especially in the case of the lumbar and chest posteroanterior images.[14,15,16,17] Increasing of mAs leads to the improvement of DQE, spatial resolution, and contrast as well as decline of noise. Unfortunately, on the other hand, it drastically increased patient radiation dose.
HVL and total filtration have an important role in the image quality and patient dose. According to the IEC 2000, minimum permissible HVL depends on kVp and total filtration. As it is seen in the Figure 7, the minimum permissible HVL of all units in the determined total filtrations were inside the acceptable range.[22] NCRP99 suggests that increasing the HVL from 2.3 to 3 mmAl at 80 kVp will reduce the exposure to the patient by 25%. This increase has a minimal effect on image contrast and density.
The study of Schaetzing showed that addition of a very thin layer of copper filter reduces the entrance skin dose by 40%.[25] Furthermore, addition of 1 mmAl +0.1 or 0.2 mmCu was recommended for pediatrics dose reduction in the other study.[18] However, adding of a thin layer of filter has not a significant impact on the image quality.[26,27]
Despite the rapid development of medical imaging technology, radiography has still kept its role as the first medical imaging step. In the current study, the image quality parameters of the DR units in Tabriz city were considered and compared with the international protocols. The results of this study showed that most of the units successfully passed the radiographic image quality control tests. Moreover, all of them showed low ESAK which can lead to low patient radiation dose. The DR units had higher spatial resolution and contrast as well as lower noise than the CR units. The physical parameters of the image quality have important role in assessment of image quality performance of radiography units. Therefore, measurement and control of these parameters using 2D phantoms are recommended.
Financial support and sponsorship
None.
Conflicts of interest
There are no conflicts of interest.
BIOGRAPHIES

Nahideh Gharehaghaji was born in Tabriz, Iran. She received the Ph.D. degree in medical physics from Tehran University of medical science. Currently, she is an associate professor in the Department of Radiology in paramedical science faculty in Tabriz university of medical science. Her research interests include Nano contrast agent in MRI, Gel dosimetry with MRI, and patient dosimetry.
Email: gharehaghajin@tbzmed.ac.ir

Davood Khezerloo was born in Khoy, Iran. He received the Ph.D. degree in medical physics from Tehran university of medical science. Currently, he is an assistant professor in the Department of Radiology in paramedical science faculty in Tabriz University of medical science. His research interests include, Image quality in medical imaging, patient dosimetry and radiotherapy.
Email: khezerlood@tbzmed.ac.ir

Tohid Abbasiazar was born in Miandoab, Iran. He received the BSc. degree in Radiology technologist from TTabriz university of medical science.
Email: tohidabbasiazar@yahoo.com
References
- 1.Ween B, Kristoffersen DT, Hamilton GA, Olsen DR. Image quality preferences among radiographers and radiologists. A conjoint analysis. Radiography. 2005;11:191–7. [Google Scholar]
- 2.Båth M, Månsson LG. Visual grading characteristics (VGC) analysis: A non-parametric rank-invariant statistical method for image quality evaluation. Br J Radiol. 2007;80:169–76. doi: 10.1259/bjr/35012658. [DOI] [PubMed] [Google Scholar]
- 3.Månsson L. Methods for the evaluation of image quality: A review. Radiat Prot Dosimetry. 2000;90:89–99. [Google Scholar]
- 4.Aichinger H, Dierker J, Joite-Barfuß S, Säbel M. Radiation Exposure and Image Quality in X-ray Diagnostic Radiology: Physical Principles and Clinical Applications. Springer Science & Business Media. 2011 [Google Scholar]
- 5.Jones AK, Heintz P, Geiser W, Goldman L, Jerjian K, Martin M, et al. Ongoing quality control in digital radiography: Report of AAPM imaging physics committee task group 151. Med Phys. 2015;42:6658–70. doi: 10.1118/1.4932623. [DOI] [PubMed] [Google Scholar]
- 6.Zoetelief J, van Soldt RT, Suliman II, Jansen JT, Bosmans H. Quality control of equipment used in digital and interventional radiology. Radiat Prot Dosimetry. 2005;117:277–82. doi: 10.1093/rpd/nci739. [DOI] [PubMed] [Google Scholar]
- 7.Kloth JK, Neumann R, von Stillfried E, Stiller W, Burkholder I, Kauczor HU, et al. Quality-controlled dose-reduction of pelvic X-ray examinations in infants with hip dysplasia. Eur J Radiol. 2016;85:233–8. doi: 10.1016/j.ejrad.2015.11.018. [DOI] [PubMed] [Google Scholar]
- 8.Veldkamp WJ, Kroft LJ, Geleijns J. Dose and perceived image quality in chest radiography. Eur J Radiol. 2009;72:209–17. doi: 10.1016/j.ejrad.2009.05.039. [DOI] [PubMed] [Google Scholar]
- 9.Boone JM, Cody DD, Fisher JR, Frey GD, Glasser H, Gray JE, et al. Quality Control in Diagnostic Radiology. Vol. 74. New York: American Association of Physicists; 2002. pp. 1–77. [Google Scholar]
- 10.Moser JB, Sheard SL, Edyvean S, Vlahos I. Radiation dose-reduction strategies in thoracic CT. Clin Radiol. 2017;72:407–20. doi: 10.1016/j.crad.2016.11.021. [DOI] [PubMed] [Google Scholar]
- 11.Yacoob HY, Mohammed HA. Assessment of patients X-ray doses at three government hospitals in Duhok city lacking requirements of effective quality control. J Radiat Res Appl Sci. 2017;10:183–7. [Google Scholar]
- 12.Ngoye WM, Motto JA, Muhogora WE. Quality control measures in Tanzania: Is it done? J Med Imaging Radiat Sci. 2015;46(Suppl 3):S23–30. doi: 10.1016/j.jmir.2015.06.004. [DOI] [PubMed] [Google Scholar]
- 13.Aldrich JE, Duran E, Dunlop P, Mayo JR. Optimization of dose and image quality for computed radiography and digital radiography. J Digit Imaging. 2006;19:126–31. doi: 10.1007/s10278-006-9944-9. [DOI] [PMC free article] [PubMed] [Google Scholar]
- 14.Asadinezhad M, Bahreyni Toossi MT, Ebrahiminia A, Giahi M. Quality control assessment of conventional radiology devices in Iran. Iran J Med Phys. 2017;14:1–7. [Google Scholar]
- 15.Suliman I, Zoetelief J, Van Soldt R. Protocol for Quality Control of Equipment used in Digital and Interventional Radiology. Delft, The Netherlands: Delft University for Technology. 2003 doi: 10.1093/rpd/nci739. [DOI] [PubMed] [Google Scholar]
- 16.Niemann T, Reisinger C, Rau P, Schwarz J, Ruis-Lopez L, Bongartz G, et al. Image quality in conventional chest radiography. Evaluation using the postprocessing tool diamond view. Eur J Radiol. 2010;73:555–9. doi: 10.1016/j.ejrad.2008.12.018. [DOI] [PubMed] [Google Scholar]
- 17.Hinojos-Armendáriz VI, Mejía-Rosales SJ, Franco-Cabrera MC. Optimisation of radiation dose and image quality in mobile neonatal chest radiography. Radiography (Lond) 2018;24:104–9. doi: 10.1016/j.radi.2017.09.004. [DOI] [PubMed] [Google Scholar]
- 18.Uffmann M, Schaefer-Prokop C. Digital radiography: The balance between image quality and required radiation dose. Eur J Radiol. 2009;72:202–8. doi: 10.1016/j.ejrad.2009.05.060. [DOI] [PubMed] [Google Scholar]
- 19.Schreiner-Karoussou A. Review of image quality standards to control digital X-ray systems. Radiat Prot Dosimetry. 2005;117:23–5. doi: 10.1093/rpd/nci722. [DOI] [PubMed] [Google Scholar]
- 20.Lanhede B, Båth M, Kheddache S, Sund P, Björneld L, Widell M, et al. The influence of different technique factors on image quality of chest radiographs as evaluated by modified CEC image quality criteria. Br J Radiol. 2002;75:38–49. doi: 10.1259/bjr.75.889.750038. [DOI] [PubMed] [Google Scholar]
- 21.Normung DI, editor. Image Quality Assurance in Diagnostic X-ray Departments. DIN V 6868-58. Sulzbach, Germany: Pehamed; 2016. DIGRAD phantom for digital radiography; p. 17. [Google Scholar]
- 22.International Elelctrotechnical Commission. Report 60601 Medical Electrical Equipment. Particular Requirements for the Safety of X-Ray Equipment for Interventional Procedures. Part 2-43. Geneva, Switzerland: International Elelctrotechnical Commission; 2000. [Google Scholar]
- 23.Schaefer-Prokop CM, De Boo DW, Uffmann M, Prokop M. DR and CR: Recent advances in technology. Eur J Radiol. 2009;72:194–201. doi: 10.1016/j.ejrad.2009.05.055. [DOI] [PubMed] [Google Scholar]
- 24.Kramer R, Khoury HJ, Vieira JW. CALDose_X-a software tool for the assessment of organ and tissue absorbed doses, effective dose and cancer risks in diagnostic radiology. Phys Med Biol. 2008;53:6437–59. doi: 10.1088/0031-9155/53/22/011. [DOI] [PubMed] [Google Scholar]
- 25.Schaetzing R. Management of pediatric radiation dose using Agfa computed radiography. Pediatr Radiol. 2004;34(Suppl 3):S207–14. doi: 10.1007/s00247-004-1271-z. [DOI] [PubMed] [Google Scholar]
- 26.Geijer H, Norrman E, Persliden J. Optimizing the tube potential for lumbar spine radiography with a flat-panel digital detector. Br J Radiol. 2009;82:62–8. doi: 10.1259/bjr/56572915. [DOI] [PubMed] [Google Scholar]
- 27.Uffmann M, Neitzel U, Prokop M, Kabalan N, Weber M, Herold CJ, et al. Flat-panel-detector chest radiography: Effect of tube voltage on image quality. Radiology. 2005;235:642–50. doi: 10.1148/radiol.2352031730. [DOI] [PubMed] [Google Scholar]


