Significance
The function of progressive rod-cone degeneration (PRCD) protein has remained a mystery since its gene and associated mutation were discovered as one of the most common causes of retinal degeneration in dogs. Furthermore, numerous mutations in the protein have since been identified to cause retinal degeneration in human patients diagnosed with retinitis pigmentosa. Here, we generated a PRCD knockout mouse and found that PRCD functions at the site of photoreceptor disc morphogenesis where it is required to keep newly forming discs flat as they protrude from the plasma membrane. Without PRCD, the newly forming discs bulge and release extracellular vesicles, which accumulate in the extracellular space and ultimately lead to retinal pathology.
Keywords: photoreceptor, PRCD, retinal degeneration, microglia
Abstract
Progressive rod-cone degeneration (PRCD) is a small protein residing in the light-sensitive disc membranes of the photoreceptor outer segment. Until now, the function of PRCD has remained enigmatic despite multiple demonstrations that its mutations cause blindness in humans and dogs. Here, we generated a PRCD knockout mouse and observed a striking defect in disc morphogenesis, whereby newly forming discs do not properly flatten. This leads to the budding of disc-derived vesicles, specifically at the site of disc morphogenesis, which accumulate in the interphotoreceptor matrix. The defect in nascent disc flattening only minimally alters the photoreceptor outer segment architecture beyond the site of new disc formation and does not affect the abundance of outer segment proteins and the photoreceptor’s ability to generate responses to light. Interestingly, the retinal pigment epithelium, responsible for normal phagocytosis of shed outer segment material, lacks the capacity to clear the disc-derived vesicles. This deficiency is partially compensated by a unique pattern of microglial migration to the site of disc formation where they actively phagocytize vesicles. However, the microglial response is insufficient to prevent vesicular accumulation and photoreceptors of PRCD knockout mice undergo slow, progressive degeneration. Taken together, these data show that the function of PRCD is to keep evaginating membranes of new discs tightly apposed to each other, which is essential for the high fidelity of photoreceptor disc morphogenesis and photoreceptor survival.
Progressive rod-cone degeneration (PRCD) is a canine retinal disease and the most common known cause of blindness in dogs, affecting over 35 breeds with allelic frequency as high as 45% (1–5). The disease is caused by a single C2Y mutation in the Prcd gene, which is expressed specifically in the retina (6, 7). Since the gene’s discovery, human patients diagnosed with retinitis pigmentosa have been identified with mutations in Prcd, including the same C2Y mutation (6, 8–12). In both human and canine patients, the disease is autosomal recessive and characterized by a relatively slow, progressive death of rod photoreceptors followed by cones (5, 6).
The Prcd gene encodes a 6-kDa membrane protein localized exclusively in photoreceptor outer segment discs and expressed at a 1:290 molar ratio with rhodopsin (13). PRCD is constitutively bound to rhodopsin with the C terminus exposed at the cytosolic disc surface and the N terminus S-acylated at the exact cysteine residue (C2) that is mutated to tyrosine in blind patients (14). The C2Y mutation in PRCD completely mislocalizes it from photoreceptor discs and results in PRCD degradation, which is functionally equivalent to a null mutation (14, 15).
To understand the role of PRCD in photoreceptors, we generated and characterized a PRCD knockout mouse. A striking phenotype of this mouse is a distinct defect in the formation of photoreceptor discs. Normally, photoreceptor discs are formed as serial plasma membrane evaginations at the outer segment base, followed by their immediate flattening, elongation, and enclosure (16). In Prcd−/− mice, newly evaginating discs are not immediately flattened, resulting in a release of extracellular vesicles accumulating in the interphotoreceptor space. This is associated with a unique pattern of microglial migration directly to the site of vesicle accumulation, likely in an effort to clear these vesicles from the interphotoreceptor matrix. Interestingly, nascent discs eventually flatten as they mature and enclose, and the resulting outer segments produce normal responses to light. However, this defect in disc morphogenesis is sufficient to induce retinal pathology consisting of a slow progressive photoreceptor loss.
Results
Generation of the PRCD Knockout Mouse.
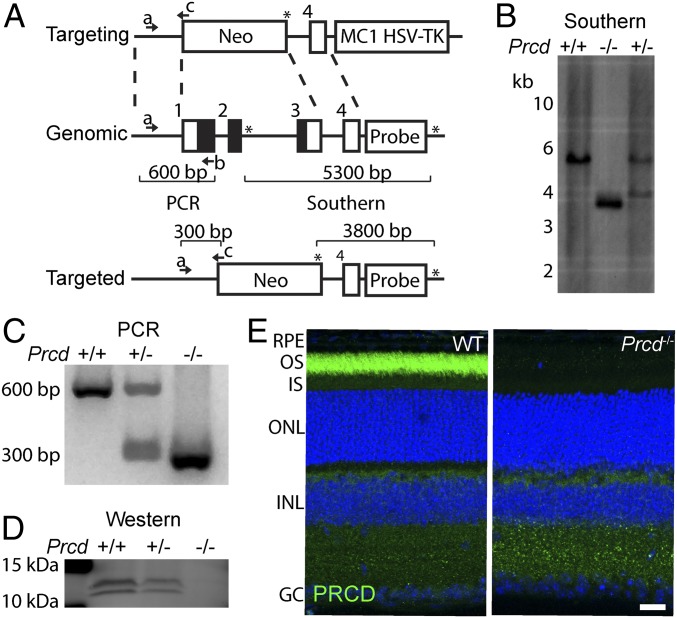
We generated a PRCD knockout mouse by deleting exons 1–3 of the Prcd gene, which effectively removed the entire protein-coding region of this gene (Fig. 1A). We confirmed the correct insertion of the targeting construct at the Prcd locus by Southern blotting (Fig. 1B) and developed a PCR genotyping strategy to distinguish between WT, Prcd+/−, and Prcd−/− mice (Fig. 1C). Western blotting for PRCD confirmed the complete absence of PRCD protein in Prcd−/− retinal lysates and a reduction in Prcd+/− mice (Fig. 1D). The lack of PRCD in Prcd−/− mouse retinas was further corroborated by immunostaining of WT and knockout retinas with an anti-PRCD antibody (Fig. 1E).
Fig. 1.
Generation of Prcd−/− mice. (A) The targeting construct containing homology arms flanking exons 1–3 of the mouse Prcd gene and binding the Prcd genomic region, as shown by the dashed-lines. The targeting construct had neomycin and HSV-TK cassettes used for positive and negative selection of ES cell clones, respectively. The targeted Prcd locus lacked exons 1–3, encompassing the entire protein coding region (black). A Southern blot probe (probe) was designed to bind between Pst1 restriction sites (shown by asterisks) at the Prcd locus, to distinguish a deleted locus producing a 3,800-bp fragment from the untargeted, genomic Prcd locus producing a 5,300-bp fragment. Three primer binding sites (denoted by a, b, and c with arrows) allow PCR determination of WT, Prcd+/− and Prcd−/− mice by producing 600- or 300-bp DNA fragments. (B) Southern blot using a 32P labeled DNA probe to hybridize with Pst1 digested DNA isolated from WT and Prcd+/− mice. Bacterial artificial chromosome containing targeted Prcd locus (Prcd−/−) was used as a positive control. (C) Agarose gel showing PCR products produced using the genotyping primers shown in A with DNA isolated from WT, Prcd+/− and Prcd−/− mice. (D) Western blot of mouse retinal lysates from WT, Prcd+/− and Prcd−/− mice probed with anti-PRCD antibody. Each lane contained 10 µg of total protein. PRCD double band results from its phosphorylation (14). (E) Retinal cross sections of P21 WT and Prcd−/− mice immunostained with anti-PRCD antibody (green). Nuclei were stained with Hoescht (blue) (Scale bar, 20 µm). Abbreviations: GC, ganglion cell layer; INL, inner nuclear layer; IS, photoreceptor inner segments; OS, photoreceptor outer segments. Data are taken from one of three independent experiments.
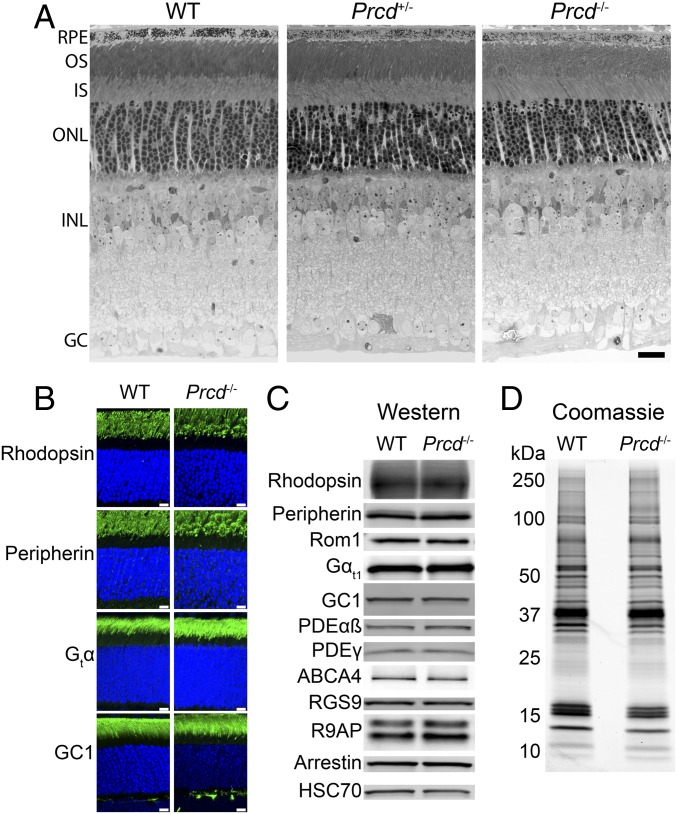
By postnatal day 21 (P21), Prcd−/− and Prcd+/− mice develop a normally layered retina, including photoreceptor outer segments (Fig. 2A). Because PRCD requires an interaction with rhodopsin for stability and outer segment localization (14), we conducted immunofluorescence staining of rhodopsin in Prcd−/− retinas at P21 and found that rhodopsin’s localization in Prcd−/− mice was normal (Fig. 2B). Western blotting of equal amounts of WT and Prcd−/− retinal lysates obtained from mice of the same age showed that the amount of rhodopsin in Prcd−/− mice was normal as well (Fig. 2C). We similarly observed normal outer segment localization and abundance of an array of other photoreceptor outer segment proteins (Fig. 2 B and C), including guanylate cyclase 1 (GC1), which is the only other photoreceptor disc protein that requires binding to rhodopsin for outer segment delivery (17). We also compared overall protein compositions in outer segments purified from Prcd−/− and WT retinas by running equal, rhodopsin-normalized aliquots of these preparations on SDS/PAGE gels and staining proteins with Coomassie. No observable differences between these two preparations were observed (Fig. 2D).
Fig. 2.
Prcd−/− mice develop all retinal layers and have normal localization and abundance of outer segment proteins. (A) Retinal morphology of WT, Prcd+/−, and Prcd−/− mice at P21. The 500-nm retinal cross-sections embedded in plastic were stained by Toluidine blue and analyzed by light microscopy (Scale bar, 20 µm). (B) Immunostaining of retinal cross-sections from WT and Prcd−/− mice at P21 with antibodies against representative ROS proteins indicated in the panel (green). Nuclei are stained with Hoescht (blue) (Scale bars, 10 µm). (C) Western blotting of representative outer segment proteins from retinal lysates of WT and Prcd−/− mice at P21. Samples are normalized by total protein. (D) A Coomassie-stained SDS/PAGE gel loaded with equal amounts of outer segments purified from WT and Prcd−/− mice at P21. Outer segments were purified in the dark using a density gradient, and samples were normalized by their content of rhodopsin. Data for all panels are taken from one of at least three independent experiments.
Slow Degeneration of Rod Photoreceptors in Prcd−/− Mice.
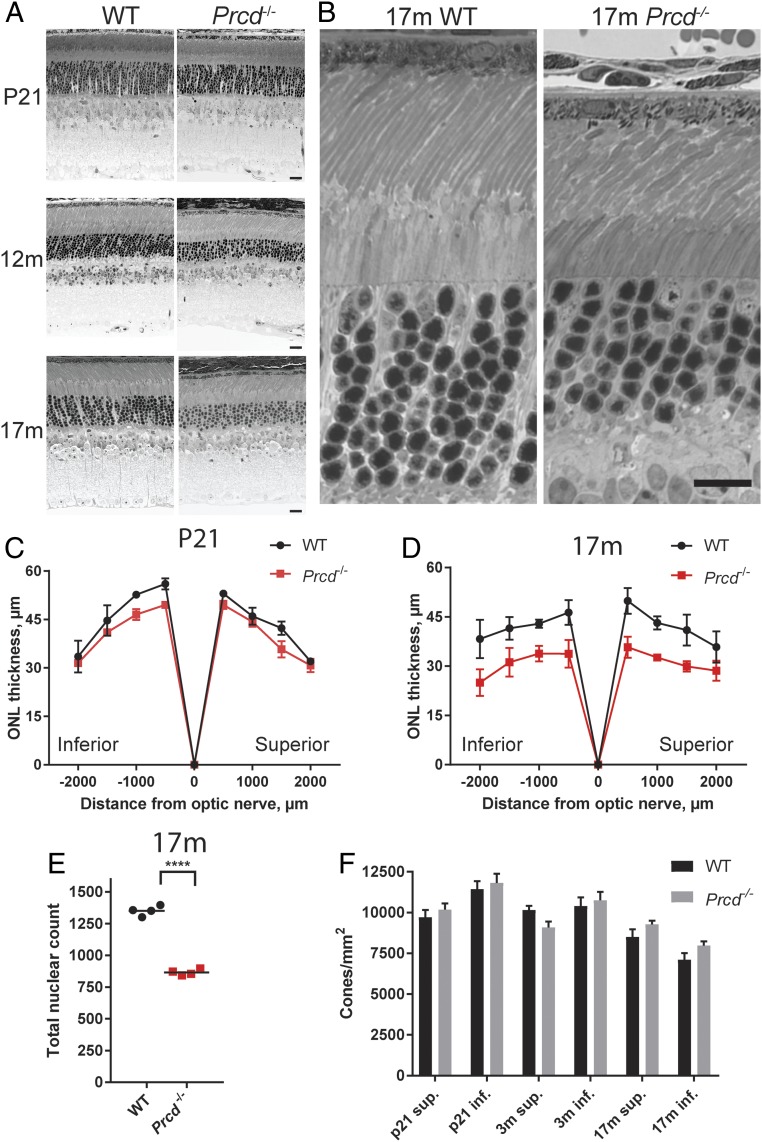
We conducted morphometric analysis of thin retinal cross-sections from Prcd−/− mice of different ages between 3 wk and 17 mo and observed a pattern of slowly progressing photoreceptor loss. At P21, Prcd−/− retinas looked normal, but the outer nuclear layer (ONL) thickness was markedly reduced in old mice (Fig. 3 A–D and SI Appendix, Fig. S1) and the outer segments looked somewhat disorganized, while the inner retina looked normal (Fig. 3 A and B). To describe photoreceptor loss quantitatively, we counted the number of photoreceptor nuclei in 100-µm sections of the ONL at 500-µm intervals from the optic nerve and found that 36 ± 3% of photoreceptors were lost by the age of 17 mo (Fig. 3E). The loss of photoreceptors was restricted to rods, as we observed no decrease in the number of cones in Prcd−/− retinas up to 17 mo of age (Fig. 3F and SI Appendix, Fig. S2).
Fig. 3.
Rod photoreceptors of Prcd−/− mice undergo slow degeneration, while cones survive. (A) Representative images of retinal cross-sections from WT and Prcd−/− mice taken at P21, 12 mo, and 17 mo showing the progressive loss of the ONL in Prcd−/− mice (Scale bars, 20 µm). (B) Representative, high-magnification images of WT and Prcd−/− mouse outer retinal layers at 17 mo of age (Scale bar, 20 µm). (C and D) Spider diagrams representing the thickness of the ONL in the inferior and superior retinas of WT and Prcd−/− mice at various distances from the optic nerve head. Measurements were conducted with P21 and 17-mo-old mice; one retina from each of four mice was analyzed for each genotype. Data are shown as mean ± SD determined for each location. (E) The reduction of the number of photoreceptor nuclei in 17-mo-old Prcd−/− mice. Nuclei were counted and summed from eight 100-µm-wide segments centered at each of the eight locations analyzed in the spider diagrams in D. Data are shown as mean ± SD; ****P < 0.0001, two-tailed t test. (F) Cone photoreceptor density in retinal flat mounts from WT and Prcd−/− mice of indicated ages. Cell count was performed after staining cones with peanut agglutinin (PNA), as shown in SI Appendix, Fig. S3. No significant difference (P > 0.05) was found between WT and Prcd−/− mice at any age. A two-way ANOVA with Bonferroni correction for multiple comparisons was used for statistical analysis.
Prcd−/− Rods Produce Normal Responses to Light.
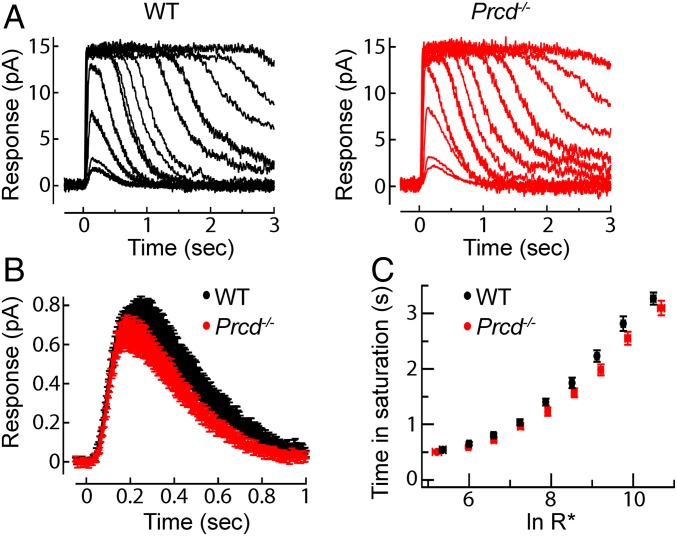
In the next set of experiments, we investigated whether the PRCD knockout affects the ability of rod photoreceptors to produce responses to light. We conducted suction electrode recordings from the outer segments of intact Prcd−/− and WT rods, which allow the measurement of single-photon responses and the kinetics of the underlying phototransduction machinery (18). In every respect, the light-evoked responses of Prcd−/− were indistinguishable from those produced by the littermate WT rods (Fig. 4 and SI Appendix, Table S1). Families of responses to flashes across a wide range of intensities were very similar in appearance (Fig. 4A) and the population average single-photon responses were indistinguishable in both amplitude and kinetics (Fig. 4B). Responses to bright flashes remained in saturation for comparable times and yielded similar dominant time constants of recovery (Fig. 4C). Together, these findings suggest normal rhodopsin packing density, as well as normal stoichiometry and activation/deactivation kinetics of other proteins of the phototransduction cascade in Prcd−/− rods. The maximal amplitudes of the bright flash responses, which reflect the total circulating “dark current,” were ∼12–13 pA in both WT and Prcd−/− rods (SI Appendix, Table S1), consistent with normal outer segment length, dark cGMP levels, and plasma membrane channel density.
Fig. 4.
Prcd−/− rods produce normal responses to light. (A) Representative families of flash responses from a WT (black) and Prcd−/− (red) rod. Flash strengths ranged from 4.7 to 74,000 photons µm−2 by factors of 2. (B) Population average single-photon responses from WT (n = 18) and Prcd−/− (n = 18) littermates 40–45 d of age. Average maximal response amplitudes for these populations were 13.2 and 12.2 pA, respectively (P = 0.34). (C) Plot comparing the time that bright flash response remained in saturation as a function of the natural log of the number of photoexcited rhodopsins (R*). Data are shown as mean ± SEM.
Prcd−/− Rods Display a Distinct Defect in Photoreceptor Disc Morphogenesis.
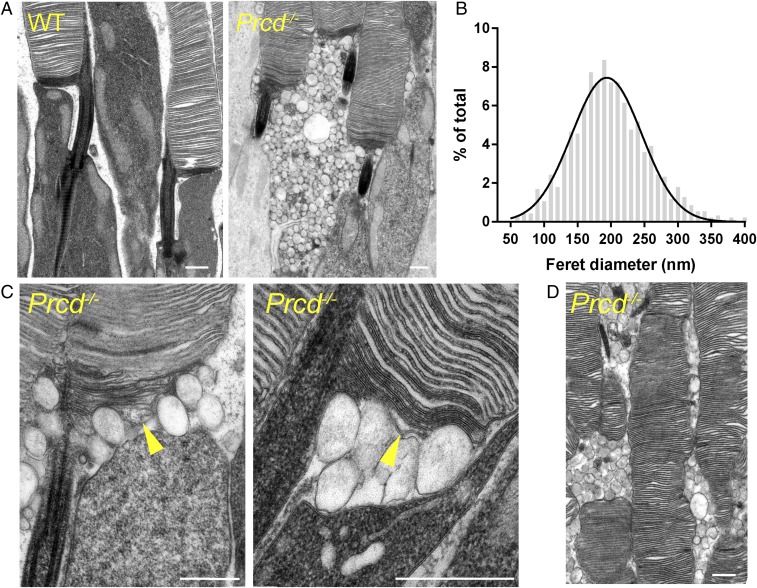
We next conducted ultrastructural analysis of Prcd−/− rods. Most critical to revealing the PRCD knockout phenotype was employing our recently developed protocol for tissue fixation and processing, which ideally preserves the structure of newly evaginating discs at the outer segment base and stains these discs more intensely than mature, enclosed discs (19). This is important because many other commonly used protocols result in severe artifacts of postmortem membrane rearrangement at the outer segment base (see examples in ref. 19). This analysis revealed a striking phenotype, whereby large numbers of extracellular vesicles, sized 200 ± 61 nm in diameter (mean ± SD), accumulate in the interphotoreceptor matrix (Fig. 5 A and B). A closer inspection suggested that these vesicles emanate from the outer segment base where new discs are formed, resulting in a separation of the inner/outer segment juncture (Fig. 5C). Curiously, membrane contrasting of these vesicles was unique and did not match that of other surrounding membranes (newly forming discs, mature discs, or the apical plasma membrane of the inner segment).
Fig. 5.
Accumulation of extracellular vesicles at the base of photoreceptor outer segments in Prcd−/− mice. (A) Electron micrographs of WT and Prcd−/− rod photoreceptors. Note that contrasting membranes with tannic acid yields darker staining of newly forming discs than mature, enclosed discs. (B) Gaussian histogram of Feret’s maximum diameters for the extracellular vesicles accumulating next to the outer segments of Prcd−/− mice. (C) High-magnification electron micrographs of the site of disc morphogenesis in Prcd−/− mice. Arrowheads indicate newly forming discs, which are bulging. (D) Electron micrograph illustrating uneven outer segment diameter of Prcd−/− rods. All mice were 2-mo old (Scale bars in all panels, 500 nm).
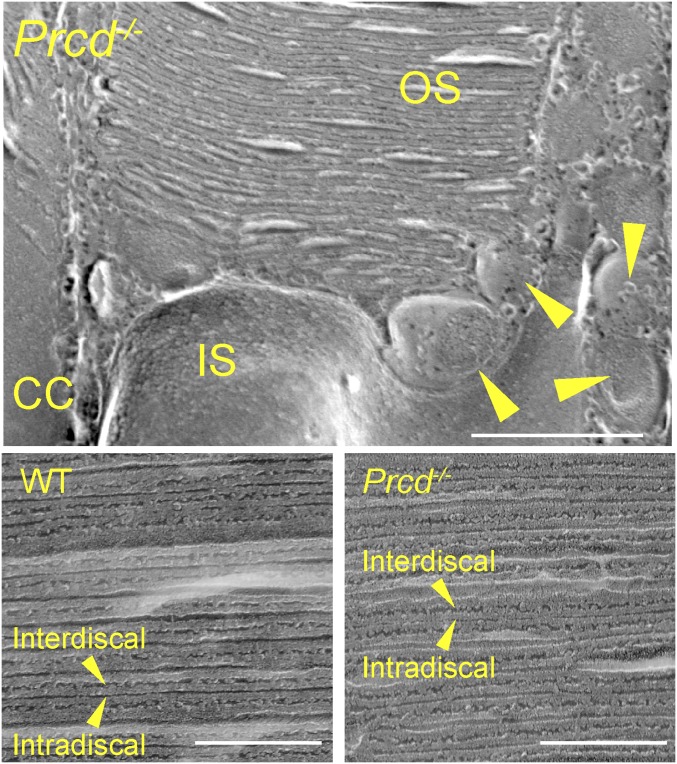
Except for a few grossly deformed outer segments likely belonging to dying cells, rod outer segments (ROS) of Prcd−/− mice looked relatively normal and contained normally spaced disc stacks inside. The only exception was that many cells had an outer segment with irregular diameter along its length, also noted in dogs bearing the C2Y PRCD mutation (5). This can be particularly well-appreciated by the example in Fig. 5D. In addition, we analyzed Prcd−/− rods by freeze-fracture electron microscopy, which corroborated the presence of vesicles at the outer segment base and, similarly, did not reveal any gross changes in disc spacing (Fig. 6).
Fig. 6.
Freeze-fracture electron microscopy of WT and Prcd−/− rods. (Upper) An image of a Prcd−/− rod at the site of disc morphogenesis. CC denotes the connecting cilium and arrowheads show extracellular vesicles (Scale bar, 500 nm). (Lower) Images showing the cross-fractures of outer segments and organization of enclosed photoreceptor discs from WT and Prcd−/− mice. Arrowheads denote the interdiscal surfaces (facing between discs) and intradiscal surfaces (facing inside the disc). Mice were 2-mo old (Scale bars, 200 nm).
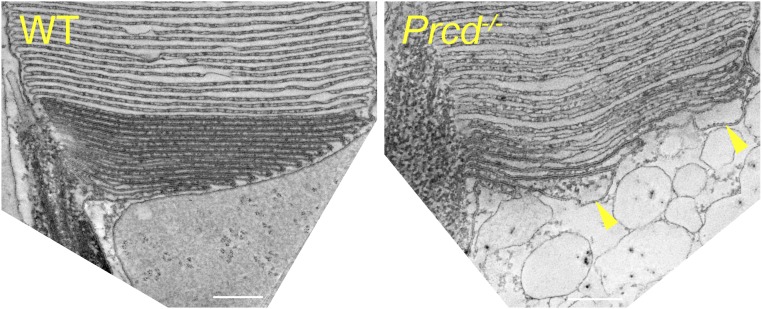
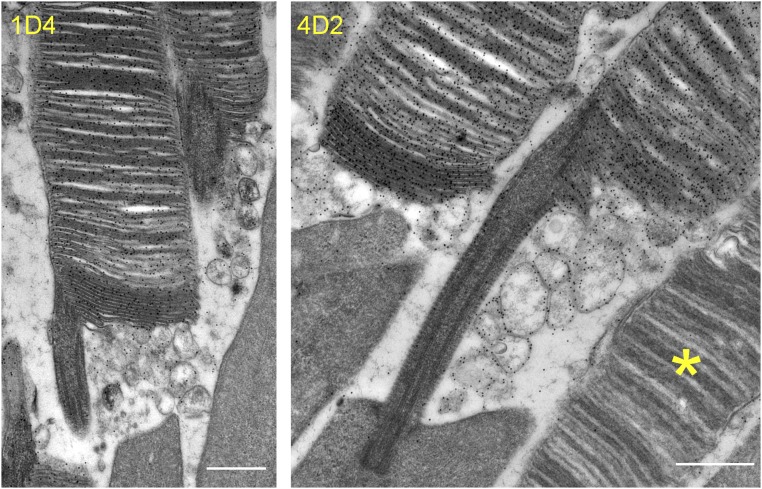
Careful examination of Prcd−/− rod ultrastructure at higher magnification revealed that some cells displayed a distinct defect in the flattening of newly forming discs (marked by an arrowhead in Fig. 5C). This inability of evaginating Prcd−/− discs to promptly flatten could be particularly well-documented using 3D electron tomography, which allows imaging thick, ∼250-nm sections through the photoreceptor cell at nanoscale resolution (Fig. 7; see the entire tomograms in Movies S1 and S2 and a segmented tomogram from a Prcd−/− rod in Movie S3). Through the entire tomogram depth, membranes of newly forming discs in the WT rod were organized in a nearly perfect parallel pattern. In contrast, new discs of the Prcd−/− rod formed a much less orderly pattern and contained occasional bulges filled with cytoplasm, typically located toward the edge of a growing disc. Combined with the observation that extracellular vesicles accumulate at the site of new disc formation, this argues that the vesicles likely form upon severing of these membrane bulges. This process must occur before disc enclosure because fully enclosed discs in Prcd−/− rods are flat. To further support our hypothesis, we performed immunogold staining of retinal sections from Prcd−/− mice with two different anti-rhodopsin antibodies. In both cases, the membranes of the extracellular vesicles were intensely immunostained at a level comparable to discs (Fig. 8), consistent with them having a disc origin.
Fig. 7.
Three-dimensional electron tomography of WT and Prcd−/− rods at the site of disc morphogenesis. An image of a single, 1-nm z-section from ∼250-nm-thick electron tomograms of WT and Prcd−/− rods taken at the site of disc morphogenesis. The entire tomograms are shown in Movies S1 and S2. Arrowheads indicate two prominent bulges at the edges of newly forming discs of the Prcd−/− rod. Mice were 2-mo old (Scale bars, 200 nm).
Fig. 8.
Immunogold staining of disc-derived extracellular vesicles in Prcd−/− mice with anti-rhodopsin antibodies. Immunogold labeling of rhodopsin in Prcd−/− mouse retinas was performed using two different anti-rhodopsin antibodies: 1D4 and 4D2. An essential lack of gold particles over a cone (marked by the asterisk in the Right image) provides a measure of labeling specificity. Mice were 2-mo old (Scale bars, 500 nm).
Activated Microglia Migrate to the Site of Extracellular Vesicle Accumulation.
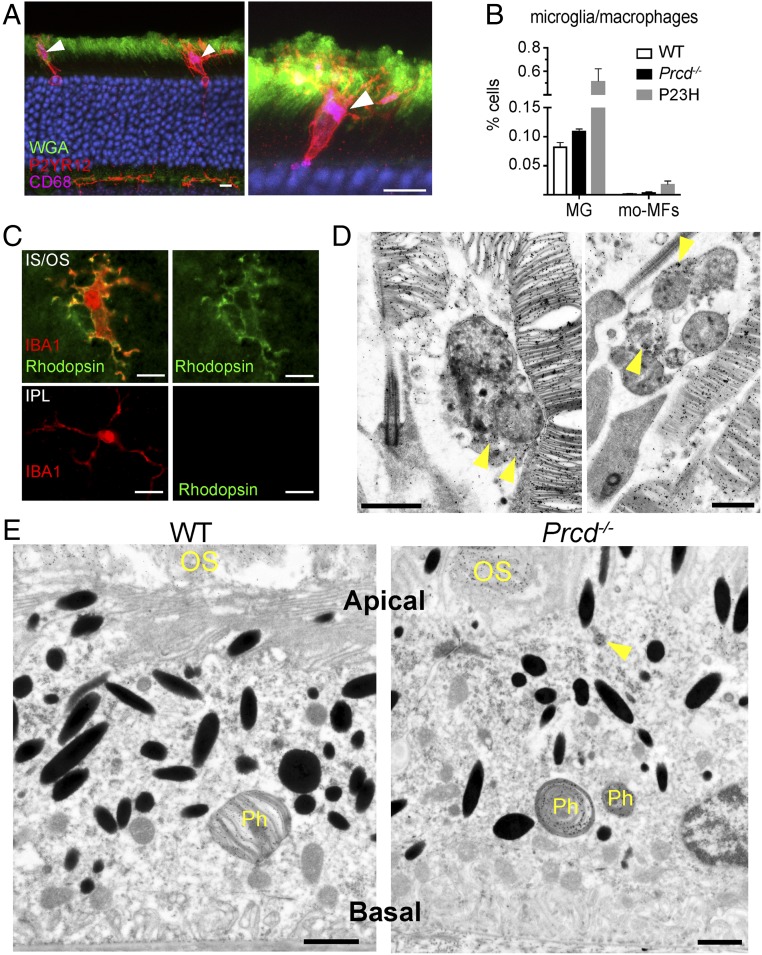
Like in other forms of retinal degeneration, we observed the presence of microglia/macrophages in the photoreceptor layer of Prcd−/− mice. These phagocytes were immunolabeled for P2RY12, the purinergic receptor highly expressed by microglia (20), including retinal microglia (21) (Fig. 9A and Movies S4 and S5). They also expressed CD68, a lysosomal protein highly expressed by activated microglia in degenerating retinas (21). To further interrogate these cells’ identity, we used a flow cytometry panel (22), which distinguishes endogenous microglia from monocyte-derived macrophages in degenerating retina (SI Appendix, Fig. S3). We found that only ∼4% of mononuclear phagocytic cells displayed the monocyte-derived signature, whereas the rest matched the resident microglia profile (Fig. 9B). Interestingly, the total amount of microglia and macrophages in Prcd−/− retinas was smaller than in the retinas of mice bearing a knockin P23H point mutation in rhodopsin, a model used as a positive control in this analysis, likely reflecting a much more aggressive progression of retinal degeneration in the P23H mouse than in the Prcd−/− mouse. Together, these data suggest that the vast majority of phagocytes observed in the photoreceptor layer of Prcd−/− mice are resident microglia.
Fig. 9.
Immune response in outer retina of 4-mo-old Prcd−/− mice. (A) Microglia immunostaining in cross-sections of Prcd−/− mouse retinas with the P2YR12 marker in red and lysosomal marker CD68 in purple. Photoreceptor outer segments are labeled with wheat germ agglutinin (WGA) in green. Arrowheads denote sites of maximal lysosomal activity (CD68 staining) within microglia. Images represent maximum intensity projections. See Movies S4 and S5 for 3D confocal images of these cells (Scale bars, 10 µm). (B) A bar graph comparing the percentage of microglia (MG) and monocyte derived macrophages (mo-MFs) identified in WT, Prcd−/−, and P23H retinas by flow cytometry. The following markers were used: CD45low, CD11b+, F4/80+, Ly6C−, Ly6G− for microglia, and CD45high, CD11b+, F4/80+, Ly6C−, Ly6G− for macrophages, relative to total viable single cells in dissociated retina. Data are expressed as mean ± SEM (WT, n = 4; Prcd−/−, n = 5; P23H, n = 2). A two-way ANOVA test with Bonferroni correction was used for statistical analysis. All observed changes were statistically significant (P < 0.05). (C, Upper) Immunostaining of microglia in the Prcd−/− mouse retina flat mount with antibodies against IBA1 (red) and rhodopsin (green). The image is a single z-section acquired just below the outer segment layer from a retina flat mount with photoreceptors facing up. (Lower) Immunostaining of microglia in the inner plexiform layer of the same Prcd−/− mouse as above obtained from a retinal flat mount with photoreceptors facing down (Scale bars, 10 µm). (D) Immunogold labeling of rhodopsin using 4D2 antibody in Prcd−/− mouse retinas showing two examples of microglia residing at the base of outer segments complete with gold particle labeling within their cell bodies. Note that the microglia contain multivesicular bodies inside, which is a characteristic feature of these cells during active phagocytosis (66) (Scale bars, 1 µm). (E) Immunogold labeling of rhodopsin using 4D2 antibody in WT and Prcd−/− mouse eyecups showing RPE cells. Phagosomes that are full of gold particles and derived from shedding outer segments are labeled, Ph. In the Prcd−/− RPE image, an arrow annotates a rhodopsin positive structure inside the RPE cell which resembles an engulfed vesicle (Scale bars, 1 µm).
A striking feature of the microglial cells found in the photoreceptor layer of Prcd−/− retinas was their location between inner segments and at the inner/outer segment junction, with their processes extending toward the extracellular vesicles. This is different from other models of photoreceptor degeneration, in which activated “amoeboid” microglia engulf photoreceptor somata in the ONL and eventually accumulate in the subretinal space abutting the retinal pigment epithelium (RPE) (e.g., refs. 21 and 23–25). We noted that there is a temporal progression of this response: whereas the majority of microglia were settled at the inner/outer segment junction in 4-mo-old mice (Fig. 9), many microglia cells were found in the ONL at P21, apparently en route to their final destination (SI Appendix, Fig. S4).
The unique presence of microglia at the site of extracellular vesicle formation in Prcd−/− retinas suggests that they are actively involved in phagocytosis of these vesicles. We tested this hypothesis by costaining these cells for a microglia-specific marker, IBA-1, and rhodopsin, and found significant rhodopsin immunostaining inside their processes and cell body (Fig. 9C). The specificity of this staining was confirmed by showing that microglia located on the other side of the retina in the inner plexiform layer completely lacked rhodopsin immunoreactivity. As an additional line of evidence, we performed immunogold labeling of microglia in Prcd−/− retinal cross-sections with an anti-rhodopsin antibody and found numerous gold particles within their cell bodies (Fig. 9D). Taken together, these data led us to conclude that microglia are actively involved in phagocytosis of extracellular vesicles in this mouse, likely functioning to clear them from the interphotoreceptor matrix.
We next examined whether the extracellular vesicles accumulating in Prcd−/− retinas could also be phagocytized by the RPE. We immunogold-labeled the RPE of Prcd−/− mice with anti-rhodopsin antibody and found a pattern very similar to WT mice: the gold particles were almost exclusively confined to phagosomes containing large outer segment fragments (Fig. 9E). On occasion, we observed engulfed rhodopsin-labeled objects that could be interpreted as phagocytosed vesicles (marked with an arrowhead in Fig. 9E), although the vast majority of RPE cells did not contain such objects despite the presence of many vesicles in the subretinal space. This suggests that microglia are the primary cells attempting to clear the extracellular vesicles from the interphotoreceptor matrix of Prcd−/− retinas, whereas the RPE essentially lacks such capacity.
Discussion
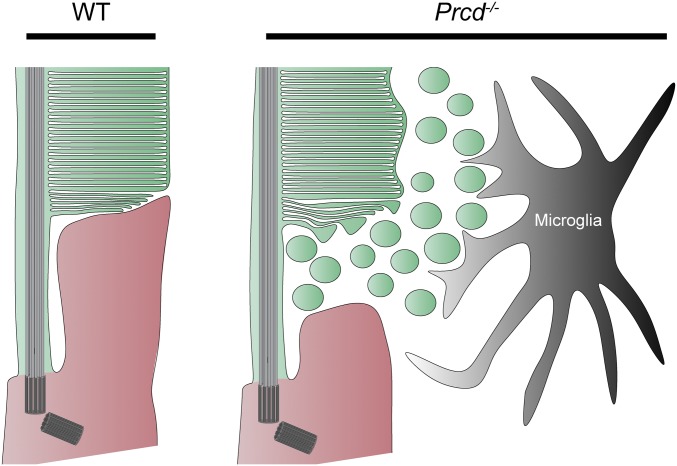
The role of PRCD in supporting photoreceptor health has remained a mystery since a single point mutation in this protein was identified as a major cause of inherited blindness in dogs (6). We now demonstrate that PRCD plays a critical role in the process of photoreceptor disc morphogenesis. In healthy rod photoreceptors, newly forming discs are perfectly aligned among themselves and tightly laminated as they evaginate from the ciliary plasma membrane (Fig. 10). In contrast, newly forming discs in PRCD knockout mice are poorly aligned, often contain swollen membrane bulges, and are surrounded by numerous membrane vesicles. These vesicles likely originate from the bulges severing into the extracellular space during the process of disc maturation. Despite this defect, newly forming discs of Prcd−/− mice do eventually flatten and enclose inside the outer segment. The resulting outer segments look essentially normal, contain normal amounts of their constituent proteins, and produce normal responses to light. The only exception is an unusual variation in the outer segment diameter, which may reflect variable amounts of membrane material being shed from individual discs during their formation.
Fig. 10.
Cartoon depiction of Prcd−/− pathobiology. The membranes of newly forming discs in WT rods are tightly apposed, and highly organized in a parallel arrangement. In Prcd−/− mice, the membranes of newly forming discs are wavy, and tend to form bulges that bud off into the extracellular space. These vesicles, most likely derived from the membranes of newly forming discs, accumulate in the interphotoreceptor matrix, and are cleared by microglia that migrate to this location. The newly forming discs in Prcd−/− mice do eventually flatten and enclose inside the outer segment, although the enclosed discs have an irregular diameter.
Although such a detailed level of ultrastructural analysis has not been performed before, many phenotypic features of Prcd−/− mice parallel those associated with the C2Y PRCD mutation in dogs. This is not surprising because this mutation was shown to completely mislocalize PRCD from the outer segment, resulting in PRCD degradation, an effective knockout of the protein (14, 15). As in dogs and humans containing a single allele of mutant PRCD, Prcd+/− mice do not display any overt phenotype, consistent with a truly recessive disease pattern. Before widespread degeneration, mutant dogs also display normal abundance and localization of outer segment proteins, relatively normal looking outer segments (aside from a few grossly abnormal outer segments likely from dying cells), and relatively normal light responses measured by electroretinography (5, 26–28). Notably, extracellular vesicles were also observed in these studies, although their origin was not definitively determined. Despite photoreceptor degeneration being relatively slow in both species, its lifespan-adjusted rate in mice appears to be slower, as affected dogs experience significant visual impairment as early as 2 y of age (29).
The most prominent consequence of the PRCD knockout is massive accumulation of extracellular vesicles between the outer segments. This is somewhat analogous to the phenotype of the rds mouse lacking the disc-specific protein peripherin, whose photoreceptors also produce rhodopsin-containing extracellular vesicles (30, 31). But unlike Prcd−/− mice, rds mice do not produce outer segments at all. We recently showed that extracellular vesicles in rds mice bud directly from the photoreceptor’s cilium and concluded that the lack of peripherin causes the evaginating membrane of a newly forming disc to sever as a vesicle instead of being retained and elongated (32). This may be different from Prcd−/− mice where vesicles appear to form from the nascent, elongating discs. The latter is supported by three arguments: (i) the membrane bulges are located at the edges of newly forming discs; (ii) unlike in rds mice, we did not observe vesicles directly budding from the connecting cilium in either thin retinal sections or 3D tomograms; and (iii) the diameter of the resulting outer segment is uneven, which implies that individual discs may have lost different amounts of the membrane material upon vesicle formation. However, the Feret’s diameter of the extracellular vesicles in both mice (231 nm in rds vs. 200 nm in Prcd−/− mice) and their ultrastructural appearances are very similar. These findings prompt a further investigation into whether the underlying molecular machinery responsible for vesicle release is shared between the two models.
Although not ubiquitously observed across animal models of inherited photoreceptor degeneration, Prcd−/− and rds mice are not the only animals where extracellular vesicles are observed between photoreceptors or in the subretinal space. Other models include Tulp1−/− mice (33), tubby mice (34), BBS8−/− mice (35), Tg737/IFT88 mice (36), rhodopsin P347S transgenic mice (37), rhodopsin Q344ter transgenic mice (38), pcd mice (30, 39), rhodopsin P347L transgenic rabbits (40), and rhodopsin S334ter transgenic rats (41). However, unlike in Prcd−/− and rds mice, the location of these vesicles typically extends to the space between photoreceptor inner segments. As conceptualized by Lavail et al. in ref. 41: “In all cases, the origin of the vesicles appears to be from budding or blebbing from the [inner segments], or in some cases, protrusions from the [inner segments].” Therefore, the phenotypes observed in PRCD and peripherin knockouts may be rather unique and potentially foretelling for addressing the fine mechanisms of photoreceptor disc morphogenesis.
Interestingly, the demonstration that Prcd−/− photoreceptors release large numbers of extracellular vesicles of presumed disc origin may shed light on another observation obtained with dogs bearing a C2Y mutation in PRCD. Using a variety of techniques, including radiolabeling of newly synthesized proteins, Aguirre and colleagues found that mutant dogs display a reduced rate of outer segment renewal (5, 27, 42). It is conceivable that this effect could be explained, at least in part, by the fact that a fraction of the membrane material destined to be delivered to discs is instead delivered to vesicles. This explanation is consistent with the level of rhodopsin mRNA in young affected dogs being normal (43), but does not exclude other contributing factors, for example if there was a decreased rate of protein translation.
Considering how essentially normal the photoreceptors are in Prcd−/− mice, it is possible that their degeneration results from the accumulation of extracellular vesicles in the interphotoreceptor space. It is well established that improper clearance of outer segment material from the subretinal space is toxic to photoreceptors (44–47). Our immunogold analysis suggests that the RPE has little capacity to ingest these vesicles, perhaps because they do not expose or even contain the correct molecules for recognition and phagocytosis by the RPE. On the other hand, these vesicles are processed by the microglia, which translocate from the synaptic layers to the site of vesicle release at the inner/outer segment juncture in an apparent attempt to clear them from the interphotoreceptor matrix. In this scenario, microglial translocation may contribute to photoreceptor preservation in this model, although it is clearly insufficient to remove all vesicles and completely prevent ongoing photoreceptor cell death.
In summary, the lack of PRCD causes a unique phenotype in which photoreceptor outer segments produce both discs and extracellular vesicles due to a specific defect in the flattening of newly forming discs. The goals of future studies are to elucidate the precise molecular mechanism underlying this defect and to determine whether the accumulation of extracellular vesicles is indeed a primary driver of retinal pathology in animals and humans affected by the lack of PRCD or other mutations in which extracellular vesicles are found in the photoreceptor layer of the retina.
Materials and Methods
Generation of Prcd−/− Mice.
The Prcd knockout mouse was generated at the Duke Cancer Institute Transgenic Mouse Core Facility. The targeting construct contained homology arms flanking exons 1–3 of the Prcd gene, which effectively removes the entire protein coding region (Fig. 1A). The construct contained a neomycin cassette for positive selection and herpes simplex virus thymidine kinase (HSV-TK) cassette for negative selection of transfected mouse embryonic stem (ES) cells. Using previously established techniques (48), this construct was transfected into G4 ES cells which were microinjected into C57BL/6J mouse embryos, as in ref. 49, to generate PRCD knockout mice. The correct insertion of the targeting vector was verified by PCR of DNA isolated from transfected ES cell clones using one primer within the targeting construct and one primer outside, in the genomic region. This was performed at the 5′ end with primers TGGTATCAGGGAGGAAGGGTGTAG and AAGGGTTATTGAATATGATCGGAATTGG, and at the 3′ end with CTATCGCCTTCTTGACGAGTTCTTC and GGCTAGACAGAGGCATCTCTGCTG. To further verify the correct targeting of the construct, we performed a Southern blot, as in ref. 50, on DNA isolated from WT and Prcd+/− mice digested with Pst1 restriction enzyme (restriction sites marked in Fig. 1A). For the Southern blot, a DNA probe was created with primers GCATCTCTCTTCCCCACCCAGCTCCCC and GCTGAGGGAAGGGTACCTGGGCGGTA and 32P radiolabeled with random primer DNA labeling kit (TaKara). Prcd+/− DNA produced two Southern blot bands of the expected size (5,300-bp WT and 3,800-bp targeted band), confirming that the targeting construct disrupted the Prcd gene and did not incorporate elsewhere in the genome (Fig. 1B). WT mouse DNA and a bacterial artificial chromosome (BAC) construct of the PRCD targeted locus were used as controls (Fig. 1B).
The distinction among Prcd+/+, Prcd+/−, and Prcd−/− mice was made by PCR genotyping, using three primers (TAAGTCCTCAAGTGCTCTGC, CCAACCCACACCACTAGCTC, and AAGGGTTATTGAATATGATCGGAATTGG; locations marked in Fig. 1A) in one PCR to produce a 600-bp WT band or 300-bp Prcd−/− band (Fig. 1C). Crosses of Prcd+/− mice produced normally looking mice with Mendelian ratios of Prcd+/+, Prcd+/−, and Prcd−/− pups. Prcd−/− mice were confirmed to lack the rd1 and rd8 mutations and back-crossed for at ≥five generations with C57BL/6J WT mice.
Mouse work was performed in accordance with procedures approved by the Institutional Animal Care and Use Committees of Duke University (registry #A254-16-12). WT mice were C57BL/6J (Jackson Labs, stock #000664). P23H mice, described in ref. 51, were from Jackson Labs (stock #017628). Mice were kept under a 12/12-h light cycle.
Antibodies.
We previously described our rabbit polyclonal anti-PRCD antibody (13), sheep polyclonal anti-RGS9 (52), and sheep polyclonal anti-Rom1 antibody (53). The following antibodies were gifts: mouse monoclonal antibody 4D2 against the N terminus of rhodopsin from Robert S. Molday, the University of British Columbia, Vancouver, Canada; rabbit polyclonal antiperipherin antibody from Gabriel H. Travis, University of California, Los Angeles; mouse monoclonal antibody 1S4 against GC1 from Wolfgang Baehr, University of Utah, Salt Lake City; rabbit polyclonal anti-R9AP antibody from Stefan Heller, Stanford University, Stanford, CA; rabbit polyclonal antibody against the PDE γ-subunit of PDE6 from Rick H. Cote, University of New Hampshire, Durham, NH; and rabbit polyclonal antibody against α- and β-subunits of PDE6 from Nikolai O. Artemyev, University of Iowa, Iowa City. We used the following commercial antibodies: mouse monoclonal antibody 1D4 against the C terminus of rhodopsin (ab5417; Abcam); goat polyclonal anti-ABCA4 antibody (SC-21460; Santa Cruz); rabbit polyclonal anti-Gαt1 antibody (SC-389; Santa Cruz); rabbit polyclonal anti–S-arrestin antibody (PA1-731; Thermo Fisher Scientific); rabbit polyclonal anti-P2RY12 antibody (55043A; Ana Spec); rabbit polyclonal anti-Iba1 antibody (019-19741; Wako); and rat monoclonal antibody FA-11 against CD68 (137002; Biolegend).
Immunofluorescence.
Experiments were performed as previously described (54). Briefly, mouse eyecups were placed in 4% paraformaldehyde in PBS for 1 h at 22 °C, rinsed three times in PBS, and embedded in 7% low-melt agarose (A3038; Sigma-Aldrich). The agarose-embedded eyecups were Vibratome sectioned into 100-µm-thick slices (VT1200S; Leica), which were then blocked in PBS containing 7% goat serum and 0.5% Triton X-100 for 1 h at 22 °C. The sections were incubated with primary antibodies overnight at 4 °C, washed three times in PBS, and incubated for 2 h at 22 °C with appropriate secondary antibodies conjugated with Alexa Fluor 488, 568, or 647 (Invitrogen) and 10 µg/mL Hoescht (H3569; Thermo Fisher Scientific) to stain nuclei. Stained slices were washed three times in PBS, mounted onto slides in Fluoromount (Electron Microscopy Sciences) and coverslipped. For retinal wholemounts, retinas were detached from eyecups, which were fixed and immunostained as described above. For imaging cones and immune cells in the outer retina, the photoreceptor side of the retina was placed up when mounted on slides; for imaging immune cells in the inner plexiform layer, the ganglion cell layer was placed up on the slide. Images were taken with a confocal microscope (Eclipse 90i and A1 confocal scanner; Nikon) with a 60× objective (1.4 NA Plan Apochromat VC; Nikon) using Nikon NIS-Elements software. Image analysis and processing was performed with ImageJ and Nikon NIS-Elements software.
Western Blotting.
Isolated retinas were sonicated in 400 μL of 2% SDS containing protease inhibitor mixture (eComplete; Roche) in PBS. Next, the lysates were centrifuged at 20,000 × g for 10 min at 22 °C, and the resulting supernatants were normalized by total protein concentration measured by the RC DC Protein Assay kit (Bio-Rad). Equal volumes of normalized lysates from corresponding mouse genotypes, ranging from 5 to 20 µg, were subjected to SDS/PAGE. Proteins were transferred to low-fluorescence PVDF membrane (Bio-Rad), and probed with primary antibodies listed above and goat secondary antibodies conjugated with Alexa Fluor 680 or 800 (Invitrogen) for detection on an Odyssey infrared imaging system (LiCor Bioscience).
Isolation of ROS and Normalization by Rhodopsin.
Osmotically intact ROS were isolated under dim red light, as described previously, with slight modifications (55). At least four WT and Prcd−/− mice were dark adapted overnight, killed, and their retinas were isolated in mouse Ringer’s solution containing 130 mM NaCl, 3.6 mM KCl, 2.4 mM MgCl2, 1.2 mM CaCl2, and 10 mM Hepes (pH 7.4) adjusted to 314 mosM. Retinas from each genotype were pooled into 400 µL ice-cold Optiprep (8%; Sigma-Aldrich) in Ringer’s solution and vortexed at maximum speed for 60 s in a 1.5-mL Eppendorf tube. The tube was then centrifuged at 200 × g for 30 s to sediment large retinal debris. Then, 350 µL of the supernatant was loaded on top of a 1.8-mL step gradient composed of 10% and 18% OptiPrep in Ringer’s solution and centrifuged for 30 min at 20,000 rpm in a swing bucket SW-55 rotor (Beckman Coulter) at 4 °C. ROS were carefully collected from the 10/18% OptiPrep interface, diluted at least fivefold with Ringer’s solution, and centrifuged at 50,000 rpm in a fixed-angle TLA-100.3 rotor (Beckman Coulter) at 4 °C. The resulting ROS pellet was solubilized in 200 µL of 2% octyl glucoside in water and stored on ice.
Rhodopsin concentration in ROS samples was measured by difference spectroscopy (56). Twenty microliters of ROS aliquots were mixed into 100-µL cuvettes containing 80 µL of 2% octyl glucoside and 25 mM hydroxylamine (pH 7.5). A spectrum was recorded from 300 to 700 nm using a DU800 spectrophotometer (Beckman). The cuvette was bleached with a 100-W halogen lamp for 60 s before taking the second spectrum reading. The difference in the absorbance at 500 nm was used to calculate rhodopsin concentration, using the extinction coefficient of 40,500 M−1·cm−1. The ROS samples were then adjusted to contain equal rhodopsin concentrations with 2% octyl glucoside in water, before adding sample buffer and running SDS/PAGE.
Histological Techniques and Transmission Electron Microscopy.
Mice were deeply anesthetized and transcardially perfused with 2% paraformaldehyde, 2% glutaraldehyde, and 0.05% calcium chloride in 50 mM Mops (pH 7.4) resulting in exsanguination (19). The eyes were enucleated and fixed for an additional 2 h in the same buffer at 22 °C. To obtain thin plastic retinal sections, eyecups were cut in half through the optic nerve and embedded in Spurr’s resin (Electron Microscopy Sciences). The embedded retinal cross sections were cut through the optic nerve in 500-nm slices and stained with methylene blue for light microscopy, as in ref. 57.
For electron microscopy, eyes were fixed and processed as described above. The fixed eyes were washed in PBS, eyecups were dissected and embedded in PBS containing 5% agar (A1296; Sigma-Aldrich), and cut into 200-µm-thick slices on a vibratome (VT1200S; Leica). The vibratome slices were stained with 1% tannic acid (Electron Microscopy Sciences) and 1% uranyl acetate (Electron Microscopy Sciences), gradually dehydrated with ethanol, and infiltrated and embedded in Spurr’s resin. Next, 70-nm sections were cut, placed on copper grids, and counterstained with 2% uranyl acetate and 3.5% lead citrate (19314; Ted Pella). The samples were imaged on a JEM-1400 electron microscope (JEOL) with a digital camera (Orius; Gatan). To measure the size of the extracellular vesicles in Prcd−/− mouse retinas, the vesicles were traced in ImageJ software, which automatically calculated the Feret’s maximum diameter (i.e., the maximum diameter of an ovoid object).
Postembedment Immunogold.
Immunogold staining was performed as described in refs. 19 and 32. Mouse eyes were fixed and cut into vibratome sections, as described above. The resulting sections were treated with 0.5% tannic acid, cryoprotected with 30% glycerol in 0.1 M sodium acetate, and freeze-substituted overnight in 4% uranyl acetate/95% methanol at −78 °C with gentle agitation on dry ice. Sections were rinsed with methanol, infiltrated with Lowicryl HM-20 (Electron Microscopy Sciences), slowly warmed to 0 °C, and embedded for 3 d under UV light. After embedment, 70-nm sections were cut and placed on nickel grids before treating them with 10 mM citrate buffer (pH 6.0) containing 0.005% Tergitol NP-10 for 15 min at 60 °C. Next, they were rinsed with water, blocked with 1% glycine in Tris-buffered saline (pH 7.6) containing 0.005% Tergitol NP-10 for 30 min, and incubated overnight with either 1D4 or 4D2 primary antibody against rhodopsin. The grids were rinsed with the same buffer, blocked with 1% donkey serum, and incubated for 2 h with donkey anti-mouse secondary conjugated with colloidal gold particles (Jackson ImmunoResearch Laboratories). Finally, the grids were incubated for 2 min with silver enhancement solution (HQ Silver, Nanoprobes) before being counterstained with 2% uranyl acetate and 3.5% lead citrate.
Freeze-Fracture Electron Microscopy.
Experiments were performed as described in refs. 58–60 with the following modifications. Eyes were fixed through perfusion fixation as described above. Dissected eyecups were washed three times with 0.1 M cacodylate buffer (pH 7.3) and cryo-protected with 25% glycerol in 0.1 M cacodylate buffer. Eye cups were cut into 300-μm slices with a Vibratome and sandwiched together on gold-nickel supports and frozen by rapid immersion in Genetron 22 (Honeywell) at near liquid nitrogen temperature. Retinas were fractured at −135 °C in a vacuum of ∼2·10−7 Torr with a Balzers 400T freeze fracture machine and etched within the vacuum for 1–3 min at −95 °C or −110 °C before rotary shadowing at a 45° angle during platinum evaporation to form a platinum replica of about 1.5-nm thickness. The platinum surface was coated with carbon (20 nm) to stabilize it, and the tissue was dissolved with Chlorox. Replicas were washed in distilled water and collected on Girder finder grids, which were imaged at 75 kV on a JEOL 1200EX TEM or a Hitachi H-600 TEM with a Hamamatsu ORCA-100 digital camera.
Three-Dimensional Electron Microscopy Tomography.
Electron tomography experiments were performed as described in ref. 61. Semithick retinal sections (∼250 nm) were cut from a resin block prepared for conventional transmission electron microscopy, as described above, and placed on 30-nm Luxel film slot grids. The grids were glow discharged and 5-nm gold particles were spread onto both surfaces to act as fiducial markers. Imaging and data acquisition were conducted on a FEI Titan Halo electron microscope operating at 300 kV equipped with an 8k × 8k direct detector (Direct Electron DE-64). Electron tomograms were generated from a four-tilt series scheme for which the specimen was tilted from −60° to +60° every 0.25°, at four evenly distributed azimuthal angle positions. The microscope magnification was set to 18,000× for the WT section and 14,000× for the Prcd−/− section and the projection micrographs binned by a factor of 4 before reconstruction. Accordingly, the pixel sizes in the final 3D digital representations were ∼0.88 nm for WT and ∼1.14 nm for Prcd−/− tomograms. For image segmentation, membrane contours were manually traced as separate objects and meshed into a 3D model using IMOD software (62).
Flow Cytometry.
Microglia and monocyte-derived macrophages were identified and quantified as described in ref. 22. The retina was extracted from the eyecup and digested in 1.5 mg/mL collagenase A and 0.4 mg/mL DNase I (Roche) in Hank’s Balanced Salt Solution (HBSS) supplemented with 5% FBS and 10 mM Hepes for 1 h at 37 °C for flow cytometry analysis. Single-cell suspensions were generated by passing the retinal digest through a 70-μm cell strainer (Corning) to generate single-cell suspensions, which were stained with Aqua Live/Dead viability dye (Thermo Fisher Scientific) for 30 min on ice. Cells were washed with FACS/EDTA buffer (0.5% BSA and 10 mM EDTA in PBS) and incubated in blocking solution containing 5% normal mouse serum, 5% normal rat serum, and 1% Fc block (eBiosciences) for 10 min. Next, the cells were stained with a combination of fluorophore-conjugated primary antibodies against mouse CD45, Ly6C, Ly6G, CD64, CD11b, CD11c (all from Biolegend), F4/80 (eBiosciences), and MHC class II (BD Biosciences), at 22 °C for 20 min. After staining, cells were washed with FACS/EDTA buffer and fixed with 1× BD stabilizing fixative (BD Biosciences). Flow cytometry was performed with a BD Fortessa flow cytometer using the BD FACSDiva software (BD Biosciences). Data were analyzed using the FlowJo software (FlowJo LLC) and expressed for each cell type as percentage of total viable single cells in the sample.
Suction Electrode Recordings.
Suction electrode recordings from the outer segments of intact mouse rods were performed as in ref. 63. Dark-adapted retinas were stored on ice in L-15 medium supplemented with 10 mM glucose. Recordings were performed in oxygenated, bicarbonate buffered Locke’s solution supplemented with 10 mM glucose at 35–37 °C. The suction pipette contained Hepes-buffered Locke’s solution (pH 7.4) connected to a calomel electrode via an agar bridge. An agar bridge also connected the bath to the opposite calomel half-cell. Brief (10 ms, 500 nm) flashes of calibrated strength were used to elicit electrical responses, which were amplified (Axopatch 200B; Molecular Devices), filtered at 30 Hz with an eight-pole Bessel (Frequency Devices), and digitized at 200 Hz using custom-written acquisition procedures in IgorPro (Wavemetrics). Responses to a large number (>30) of dim flashes were averaged and used to determine the mean time to peak and integration time (time integral of the response divided by the peak amplitude) if the peak amplitude was <20% of the maximal response amplitude. Variance to mean analysis of the dim flash responses was used to calculate the average single-photon response for each cell, and saturating flash responses were used to calculate the dominant time constant of recovery (τD), as previously described (63–65). Statistical tests for differences between genotypes was determined using a two-tailed t test assuming equal variances.
Supplementary Material
Acknowledgments
This work was supported by the National Institutes of Health Grants EY012859 (to V.Y.A.), EY005722 (to V.Y.A.), EY025558 (to W.J.S.), EY029929 (to T.R.L.), EY014047 (to M.E.B.), EY005314 (to W.-K.L.), GM103412 (to M.H.E.), EY03222 (to J.C.B.), EY025732 (to J.N.P.), and EY021798 (to D.R.S.); BrightFocus MDR (D.R.S.); the National Institutes of Health Grants CA014236 and UL1TR002553 (to Duke University); and an Unrestricted Award from Research to Prevent Blindness, Inc. (to Duke University).
Footnotes
The authors declare no conflict of interest.
This article is a PNAS Direct Submission. G.H.T. is a guest editor invited by the Editorial Board.
This article contains supporting information online at www.pnas.org/lookup/suppl/doi:10.1073/pnas.1906421116/-/DCSupplemental.
References
- 1.Kohyama M., et al. , Real-time PCR genotyping assay for canine progressive rod-cone degeneration and mutant allele frequency in Toy Poodles, Chihuahuas and Miniature Dachshunds in Japan. J. Vet. Med. Sci. 78, 481–484 (2016). [DOI] [PMC free article] [PubMed] [Google Scholar]
- 2.Gentilini F., Rovesti G. L., Turba M. E., Real-time detection of the mutation responsible for progressive rod-cone degeneration in Labrador Retriever dogs using locked nucleic acid TaqMan probes. J. Vet. Diagn. Invest. 21, 689–692 (2009). [DOI] [PubMed] [Google Scholar]
- 3.Dostal J., Hrdlicova A., Horak P., Progressive rod-cone degeneration (PRCD) in selected dog breeds and variability in its phenotypic expression. Vet. Med. 56, 243–247 (2011). [Google Scholar]
- 4.Takanosu M., Different allelic frequency of progressive rod-cone degeneration in two populations of Labrador Retrievers in Japan. J. Vet. Med. Sci. 79, 1746–1748 (2017). [DOI] [PMC free article] [PubMed] [Google Scholar]
- 5.Aguirre G., Alligood J., O’Brien P., Buyukmihci N., Pathogenesis of progressive rod-cone degeneration in miniature poodles. Invest. Ophthalmol. Vis. Sci. 23, 610–630 (1982). [PubMed] [Google Scholar]
- 6.Zangerl B., et al. , Identical mutation in a novel retinal gene causes progressive rod-cone degeneration in dogs and retinitis pigmentosa in humans. Genomics 88, 551–563 (2006). [DOI] [PMC free article] [PubMed] [Google Scholar]
- 7.Goldstein O., et al. , Linkage disequilibrium mapping in domestic dog breeds narrows the progressive rod-cone degeneration interval and identifies ancestral disease-transmitting chromosome. Genomics 88, 541–550 (2006). [DOI] [PMC free article] [PubMed] [Google Scholar]
- 8.Beheshtian M., et al. , Impact of whole exome sequencing among Iranian patients with autosomal recessive retinitis pigmentosa. Arch. Iran. Med. 18, 776–785 (2015). [PubMed] [Google Scholar]
- 9.Remez L., Zobor D., Kohl S., Ben-Yosef T., The progressive rod-cone degeneration (PRCD) protein is secreted through the conventional ER/Golgi-dependent pathway. Exp. Eye Res. 125, 217–225 (2014). [DOI] [PubMed] [Google Scholar]
- 10.Nevet M. J., Shalev S. A., Zlotogora J., Mazzawi N., Ben-Yosef T., Identification of a prevalent founder mutation in an Israeli Muslim Arab village confirms the role of PRCD in the aetiology of retinitis pigmentosa in humans. J. Med. Genet. 47, 533–537 (2010). [DOI] [PubMed] [Google Scholar]
- 11.Fu Q., et al. , Next-generation sequencing-based molecular diagnosis of a Chinese patient cohort with autosomal recessive retinitis pigmentosa. Invest. Ophthalmol. Vis. Sci. 54, 4158–4166 (2013). [DOI] [PMC free article] [PubMed] [Google Scholar]
- 12.Pach J., Kohl S., Gekeler F., Zobor D., Identification of a novel mutation in the PRCD gene causing autosomal recessive retinitis pigmentosa in a Turkish family. Mol. Vis. 19, 1350–1355 (2013). [PMC free article] [PubMed] [Google Scholar]
- 13.Skiba N. P., et al. , Proteomic identification of unique photoreceptor disc components reveals the presence of PRCD, a protein linked to retinal degeneration. J. Proteome Res. 12, 3010–3018 (2013). [DOI] [PMC free article] [PubMed] [Google Scholar]
- 14.Spencer W. J., et al. , Progressive rod-cone degeneration (PRCD) protein requires N-terminal S-acylation and rhodopsin binding for photoreceptor outer segment localization and maintaining intracellular stability. Biochemistry 55, 5028–5037 (2016). [DOI] [PMC free article] [PubMed] [Google Scholar]
- 15.Murphy J., Kolandaivelu S., Palmitoylation of progressive rod-cone degeneration (PRCD) regulates protein stability and localization. J. Biol. Chem. 291, 23036–23046 (2016). [DOI] [PMC free article] [PubMed] [Google Scholar]
- 16.Goldberg A. F., Moritz O. L., Williams D. S., Molecular basis for photoreceptor outer segment architecture. Prog. Retin. Eye Res. 55, 52–81 (2016). [DOI] [PMC free article] [PubMed] [Google Scholar]
- 17.Pearring J. N., Spencer W. J., Lieu E. C., Arshavsky V. Y., Guanylate cyclase 1 relies on rhodopsin for intracellular stability and ciliary trafficking. eLife 4, e12058 (2015). [DOI] [PMC free article] [PubMed] [Google Scholar]
- 18.Gross O. P., Pugh E. N. Jr, Burns M. E., Spatiotemporal cGMP dynamics in living mouse rods. Biophys. J. 102, 1775–1784 (2012). [DOI] [PMC free article] [PubMed] [Google Scholar]
- 19.Ding J. D., Salinas R. Y., Arshavsky V. Y., Discs of mammalian rod photoreceptors form through the membrane evagination mechanism. J. Cell Biol. 211, 495–502 (2015). [DOI] [PMC free article] [PubMed] [Google Scholar]
- 20.Bennett M. L., et al. , New tools for studying microglia in the mouse and human CNS. Proc. Natl. Acad. Sci. U.S.A. 113, E1738–E1746 (2016). [DOI] [PMC free article] [PubMed] [Google Scholar]
- 21.O’Koren E. G., et al. , Microglial function is distinct in different anatomical locations during retinal homeostasis and degeneration. Immunity 50, 723–737.e7 (2019). [DOI] [PMC free article] [PubMed] [Google Scholar]
- 22.O’Koren E. G., Mathew R., Saban D. R., Fate mapping reveals that microglia and recruited monocyte-derived macrophages are definitively distinguishable by phenotype in the retina. Sci. Rep. 6, 20636 (2016). [DOI] [PMC free article] [PubMed] [Google Scholar]
- 23.Zhang C., et al. , Activation of microglia and chemokines in light-induced retinal degeneration. Mol. Vis. 11, 887–895 (2005). [PubMed] [Google Scholar]
- 24.Ng T. F., Streilein J. W., Light-induced migration of retinal microglia into the subretinal space. Invest. Ophthalmol. Vis. Sci. 42, 3301–3310 (2001). [PubMed] [Google Scholar]
- 25.Levy O., et al. , Apolipoprotein E promotes subretinal mononuclear phagocyte survival and chronic inflammation in age-related macular degeneration. EMBO Mol. Med. 7, 211–226 (2015). [DOI] [PMC free article] [PubMed] [Google Scholar]
- 26.Parkes J. H., Aguirre G., Rockey J. H., Liebman P. A., Progressive rod-cone degeneration in the dog: Characterization of the visual pigment. Invest. Ophthalmol. Vis. Sci. 23, 674–678 (1982). [PubMed] [Google Scholar]
- 27.Aguirre G., O’Brien P., Morphological and biochemical studies of canine progressive rod-cone degeneration. 3H-fucose autoradiography. Invest. Ophthalmol. Vis. Sci. 27, 635–655 (1986). [PubMed] [Google Scholar]
- 28.Gropp K. E., Huang J. C., Aguirre G. D., Differential expression of photoreceptor-specific proteins during disease and degeneration in the progressive rod-cone degeneration (prcd) retina. Exp. Eye Res. 64, 875–886 (1997). [DOI] [PubMed] [Google Scholar]
- 29.Aguirre G. D., Acland G. M., Variation in retinal degeneration phenotype inherited at the prcd locus. Exp. Eye Res. 46, 663–687 (1988). [DOI] [PubMed] [Google Scholar]
- 30.Cohen A. I., Some cytological and initial biochemical observations on photoreceptors in retinas of rds mice. Invest. Ophthalmol. Vis. Sci. 24, 832–843 (1983). [PubMed] [Google Scholar]
- 31.Nir I., Papermaster D. S., Immunocytochemical localization of opsin in the inner segment and ciliary plasma membrane of photoreceptors in retinas of rds mutant mice. Invest. Ophthalmol. Vis. Sci. 27, 836–840 (1986). [PubMed] [Google Scholar]
- 32.Salinas R. Y., et al. , Photoreceptor discs form through peripherin-dependent suppression of ciliary ectosome release. J. Cell Biol. 216, 1489–1499 (2017). [DOI] [PMC free article] [PubMed] [Google Scholar]
- 33.Hagstrom S. A., Duyao M., North M. A., Li T., Retinal degeneration in tulp1-/- mice: Vesicular accumulation in the interphotoreceptor matrix. Invest. Ophthalmol. Vis. Sci. 40, 2795–2802 (1999). [PubMed] [Google Scholar]
- 34.Heckenlively J. R., et al. , Mouse model for Usher syndrome: Linkage mapping suggests homology to Usher type I reported at human chromosome 11p15. Proc. Natl. Acad. Sci. U.S.A. 92, 11100–11104 (1995). [DOI] [PMC free article] [PubMed] [Google Scholar]
- 35.Dilan T. L., et al. , Bardet-Biedl syndrome-8 (BBS8) protein is crucial for the development of outer segments in photoreceptor neurons. Hum. Mol. Genet. 27, 283–294 (2018). [DOI] [PMC free article] [PubMed] [Google Scholar]
- 36.Pazour G. J., et al. , The intraflagellar transport protein, IFT88, is essential for vertebrate photoreceptor assembly and maintenance. J. Cell Biol. 157, 103–113 (2002). [DOI] [PMC free article] [PubMed] [Google Scholar]
- 37.Li T., Snyder W. K., Olsson J. E., Dryja T. P., Transgenic mice carrying the dominant rhodopsin mutation P347S: Evidence for defective vectorial transport of rhodopsin to the outer segments. Proc. Natl. Acad. Sci. U.S.A. 93, 14176–14181 (1996). [DOI] [PMC free article] [PubMed] [Google Scholar]
- 38.Concepcion F., Chen J., Q344ter mutation causes mislocalization of rhodopsin molecules that are catalytically active: A mouse model of Q344ter-induced retinal degeneration. PLoS One 5, e10904 (2010). [DOI] [PMC free article] [PubMed] [Google Scholar]
- 39.Blanks J. C., Mullen R. J., LaVail M. M., Retinal degeneration in the pcd cerebellar mutant mouse. II. Electron microscopic analysis. J. Comp. Neurol. 212, 231–246 (1982). [DOI] [PubMed] [Google Scholar]
- 40.Kondo M., et al. , Generation of a transgenic rabbit model of retinal degeneration. Invest. Ophthalmol. Vis. Sci. 50, 1371–1377 (2009). [DOI] [PubMed] [Google Scholar]
- 41.LaVail M. M., et al. , Phenotypic characterization of P23H and S334ter rhodopsin transgenic rat models of inherited retinal degeneration. Exp. Eye Res. 167, 56–90 (2018). [DOI] [PMC free article] [PubMed] [Google Scholar]
- 42.Aguirre G., Andrews L., Nomarski evaluation of rod outer segment renewal in a hereditary retinal degeneration. Comparison with autoradiographic evaluation. Invest. Ophthalmol. Vis. Sci. 28, 1049–1058 (1987). [PubMed] [Google Scholar]
- 43.Huang J. C., Chesselet M. F., Aguirre G. D., Decreased opsin mRNA and immunoreactivity in progressive rod-cone degeneration (prcd): Cytochemical studies of early disease and degeneration. Exp. Eye Res. 58, 17–30 (1994). [DOI] [PubMed] [Google Scholar]
- 44.Dowling J. E., Sidman R. L., Inherited retinal dystrophy in the rat. J. Cell Biol. 14, 73–109 (1962). [DOI] [PMC free article] [PubMed] [Google Scholar]
- 45.Mullen R. J., LaVail M. M., Inherited retinal dystrophy: Primary defect in pigment epithelium determined with experimental rat chimeras. Science 192, 799–801 (1976). [DOI] [PubMed] [Google Scholar]
- 46.Vollrath D., et al. , Correction of the retinal dystrophy phenotype of the RCS rat by viral gene transfer of Mertk. Proc. Natl. Acad. Sci. U.S.A. 98, 12584–12589 (2001). [DOI] [PMC free article] [PubMed] [Google Scholar]
- 47.D’Cruz P. M., et al. , Mutation of the receptor tyrosine kinase gene Mertk in the retinal dystrophic RCS rat. Hum. Mol. Genet. 9, 645–651 (2000). [DOI] [PubMed] [Google Scholar]
- 48.DeChiara T. M., et al. , Producing fully ES cell-derived mice from eight-cell stage embryo injections. Methods Enzymol. 476, 285–294 (2010). [DOI] [PubMed] [Google Scholar]
- 49.George S. H., et al. , Developmental and adult phenotyping directly from mutant embryonic stem cells. Proc. Natl. Acad. Sci. U.S.A. 104, 4455–4460 (2007). [DOI] [PMC free article] [PubMed] [Google Scholar]
- 50.Southern E., Southern blotting. Nat. Protoc. 1, 518–525 (2006). [DOI] [PubMed] [Google Scholar]
- 51.Sakami S., et al. , Probing mechanisms of photoreceptor degeneration in a new mouse model of the common form of autosomal dominant retinitis pigmentosa due to P23H opsin mutations. J. Biol. Chem. 286, 10551–10567 (2011). [DOI] [PMC free article] [PubMed] [Google Scholar]
- 52.Makino E. R., Handy J. W., Li T., Arshavsky V. Y., The GTPase activating factor for transducin in rod photoreceptors is the complex between RGS9 and type 5 G protein beta subunit. Proc. Natl. Acad. Sci. U.S.A. 96, 1947–1952 (1999). [DOI] [PMC free article] [PubMed] [Google Scholar]
- 53.Gospe S. M. 3rd, Baker S. A., Arshavsky V. Y., Facilitative glucose transporter Glut1 is actively excluded from rod outer segments. J. Cell Sci. 123, 3639–3644 (2010). [DOI] [PMC free article] [PubMed] [Google Scholar]
- 54.Lobanova E. S., et al. , Mechanistic basis for the failure of cone transducin to translocate: Why cones are never blinded by light. J. Neurosci. 30, 6815–6824 (2010). [DOI] [PMC free article] [PubMed] [Google Scholar]
- 55.Tsang S. H., et al. , Role for the target enzyme in deactivation of photoreceptor G protein in vivo. Science 282, 117–121 (1998). [DOI] [PubMed] [Google Scholar]
- 56.Bownds D., Gordon-Walker A., Gaide-Huguenin A. C., Robinson W., Characterization and analysis of frog photoreceptor membranes. J. Gen. Physiol. 58, 225–237 (1971). [DOI] [PMC free article] [PubMed] [Google Scholar]
- 57.Lobanova E. S., et al. , Transducin γ-subunit sets expression levels of α- and β-subunits and is crucial for rod viability. J. Neurosci. 28, 3510–3520 (2008). [DOI] [PMC free article] [PubMed] [Google Scholar]
- 58.Besharse J. C., Pfenninger K. H., Membrane assembly in retinal photoreceptors I. Freeze-fracture analysis of cytoplasmic vesicles in relationship to disc assembly. J. Cell Biol. 87, 451–463 (1980). [DOI] [PMC free article] [PubMed] [Google Scholar]
- 59.Besharse J. C., Forestner D. M., Defoe D. M., Membrane assembly in retinal photoreceptors. III. Distinct membrane domains of the connecting cilium of developing rods. J. Neurosci. 5, 1035–1048 (1985). [DOI] [PMC free article] [PubMed] [Google Scholar]
- 60.Lo W. K., et al. , Aquaporin-0 targets interlocking domains to control the integrity and transparency of the eye lens. Invest. Ophthalmol. Vis. Sci. 55, 1202–1212 (2014). [DOI] [PMC free article] [PubMed] [Google Scholar]
- 61.Phan S., et al. , 3D reconstruction of biological structures: Automated procedures for alignment and reconstruction of multiple tilt series in electron tomography. Adv. Struct. Chem. Imaging 2, 8 (2017). [DOI] [PMC free article] [PubMed] [Google Scholar]
- 62.Kremer J. R., Mastronarde D. N., McIntosh J. R., Computer visualization of three-dimensional image data using IMOD. J. Struct. Biol. 116, 71–76 (1996). [DOI] [PubMed] [Google Scholar]
- 63.Gross O. P., Burns M. E., Control of rhodopsin’s active lifetime by arrestin-1 expression in mammalian rods. J. Neurosci. 30, 3450–3457 (2010). [DOI] [PMC free article] [PubMed] [Google Scholar]
- 64.Krispel C. M., et al. , RGS expression rate-limits recovery of rod photoresponses. Neuron 51, 409–416 (2006). [DOI] [PubMed] [Google Scholar]
- 65.Pepperberg D. R., et al. , Light-dependent delay in the falling phase of the retinal rod photoresponse. Vis. Neurosci. 8, 9–18 (1992). [DOI] [PubMed] [Google Scholar]
- 66.Solé-Domènech S., Cruz D. L., Capetillo-Zarate E., Maxfield F. R., The endocytic pathway in microglia during health, aging and Alzheimer’s disease. Ageing Res. Rev. 32, 89–103 (2016). [DOI] [PMC free article] [PubMed] [Google Scholar]
Associated Data
This section collects any data citations, data availability statements, or supplementary materials included in this article.


