Abstract
Meniscus tears in the avascular region rarely functionally heal due to poor intrinsic healing capacity, frequently resulting in tear propagation, followed by meniscus deterioration. Recently, we have reported that time-controlled application of connective tissue growth factor (CTGF) and transforming tissue growth factor β3 (TGFβ3) significantly improved healing of avascular meniscus tears by inducing recruitment and step-wise fibrocartilaginous differentiation of mesenchymal stem/progenitor cells (MSCs). In this study, we investigated effects of the dose of CTGF and the release rate of TGFβ3 on avascular meniscus healing in our existing explant model. Our hypothesis was that dose and release rate of CTGF and TGFβ3 are contributing factors for functional outcome in avascular meniscus healing by stem cell recruitment. Low (100ng/ml) and high (1,000 ng/ml) doses of CTGF as well as fast (0.46 ± 0.2ng/day) and slow (0.29 ± 0.1 ng/day) release rates of TGFβ3 were applied to our established meniscus explant model for meniscus tears in the inner-third avascular region. The release rate of TGFβ3 was controlled by varying compositions of poly(lactic-co-glycolic acids) (PLGA) microspheres. The meniscus explants were then cultured for 8 weeks on top of mesenchymal stem/progenitor cells (MSCs). Among the tested combinations, we found that a high CTGF dose and slow TGFβ3 release are most effective for integrated healing of avascular meniscus, demonstrating improvements in alignment of collagen fibers, fibrocartilaginous matrix elaboration and mechanical properties. This study may represent an important step toward the development of a regenerative therapy to improve healing of avascular meniscus tears by stem cell recruitment.
Keywords: knee meniscus, in situ tissue engineering, connective tissue growth factor, transforming growth factor β3
Knee meniscus is a semi-lunar and wedge-shaped fibrocartilaginous tissue between the distal femoral condyle and the proximal tibial plateau, playing important roles in joint congruence, shock absorption and stress distribution.1 The meniscus is frequently referred to as a multiphase fibrocartilaginous tissue given its regionally variability in biochemical composition as well as structure and cell phenotypes.1 For instance, spindle-shaped fibroblast-like cells populate the outer third region, which is composed of a vascularized, dense fibrous matrix. Rounded chondrocyte-like cells reside in the inner third region, which is composed of avascular cartilaginous tissue. A mixture of fibroblast-like and chondrocyte-like cells are found in the middle region which has a fibrocartilaginous matrix.2
In the United States alone, over one million patients undergo surgical repair or meniscectomy each year.3,4 In contrast to the tears in the vascularized outer third region of the meniscus, tears in the inner avascular region rarely functionally heal and frequently propagate into the middle third region, ultimately resulting in meniscus deterioration.1,5,6 Meniscus tears often be repaired by various surgical techniques but suffers from a substantial re-tear and failure rate.7 Surgeons may perform partial or even total meniscectomy to treat symptoms caused by such meniscus injuries and degeneration. However, meniscectomy dramatically elevates joint contact stress, consequently leading to osteoarthritis (OA) at a later time in life.1,5,6 Cadaveric allografts or synthetic materials can be transplanted to lower the joint contact pressure after meniscectomy; however, such meniscus grafts are limited by donor availability, testing and discarding to avoid pathogen transmission, potential immune responses, structural mismatch, access, capabilities, and costs.1,5,6 Tissue engineering and regenerative medicine approaches have recently emerged with the hope to overcome the current limitations associated with the existing meniscus repair and replacement strategies.8–12 Various biomaterials, bioactive cues, and/or stem/progenitor cells have been applied to improve healing of avascular meniscus tears in vitro and in vivo, and have shown promising progress.8–12
Recently, we devised an in situ tissue engineering approach to promote healing of avascular meniscus tears by endogenous stem/progenitor cells. We have demonstrated that time-controlled application of connective tissue growth factor (CTGF) and transforming tissue growth factor beta 3 (TGFβ3) successfully improved healing of avascular meniscus tears by inducing recruitment and step-wise fibrocartilaginous differentiation of mesenchymal stem/progenitor cells (MSCs).12 Among several growth factors and cytokines tested for meniscus healing, the selection of CTGF and TGF33 is based on our previous studies.8,12–15 More-over, a single application of CTGF-loaded fibrin glue mixed with poly(lactic-co-glycolic acids) (PLGA) microspheres (μS)-encapsulating TGFβ3 successfully recruited MSCs into the defect sites, resulting in integrated healing with fibrocartilaginous tissue.12 Our previous work showed that CTGF, through short-term release from a fibrin gel, functions as a chemotac-tic, profibrogenic factor that recruits MSCs into the defect site, followed by constructing intermediate fibrous repair tissue.12 Through sustained release from PLGA μS, TGFβ3 induced fully integrated fibrocartilaginous healing from the intermediate fibrous tissue.12
Despite the promising improvement in the healing of avascular meniscus tears, our previous study is limited in optimal repair timing and efficacy by the single dose of CTGF and the single release rate of TGFβ3. The biological functions of a growth factor are largely dependent on the dose and delivery mode.8,15–17 For instance, the controlled delivery of TGFβ1 and TGFβ3 with sustained release significantly improved chondrogenic differentiation of MSCs in comparison with direct application via media.18–22 Accordingly, herein we investigate the effects of CTGF dose and release rate of TGβ3 on avascular meniscus healing in our existing explant model. Our hypothesis is that doses and release rates of CTGF and TGFβ3 are contributing factors for functional outcome in avascular meniscus healing by stem cell recruitment. Given the expected timelines for the roles of CTGF and TGFβ3 in avascular meniscus healing supported by our previous work,12 this study focused on the doseeffect of CTGF and the effect of release rate of TGFβ3 in order to improve functional healing of avascular meniscus tears.
MATERIALS AND METHODS
Preparation of CTGF-Loaded TGFβ3-Encapsulated PLGA μS
Fibrinogen, thrombin, and PLGA (66,000–107,000 Mw), with a lactic acids to glycolic acids ratio of 75:25 and 85:15, were purchased from Sigma (St. Louis, MO). CTGF and TGFβ3 were purchased from BioVendor (Asheville, NC) and R&D Systems (Minneapolis, MN), respectively. In order to apply a sustained release of TGFβ3, we prepared PLGA μS-encapsulating TGFβ3 (2.5 μg per 250 mg PLGA) as per our established protocol.8,23 For release kinetics, a total of 1,000 ng/ml (high) or 100ng/ml (low) of CTGF was loaded in fibrin gel (50 mg/ml fibrinogen and 50U/ml thrombin) mixed with PLGA μS-encapsulating TGFβ3. The CTGF-loaded fibrin gel with PLGA μS was then incubated at 37 °C with gentle agitation for 5 weeks in PBS and 1% BSA for CTGF and TGFβ3, respectively. At selected time points, the incubation medium was collected, followed by measurement of the concentrations of CTGF and TGFβ3 by ELISA, as per our previous works.8,12,15 The average release amount per day was calculated to quantitatively compare TGFβ3 release rate from PLGA 75:25 and PLGA 85:15.
Explant Model for Avascular Meniscus Healing
Short-term release CTGF from fibrin gel and sustained release TGFβ3 from PLGA μS were applied to our existing meniscus healing explant model. As shown in Figure 1, CTGF delivered to meniscus tears at inner avascular region is expected to recruit accessible mesenchymal stem/progenitor cells, followed by formation of intermediate fibrous integration.12 Sustained release TGFβ3 then leads to integrated fibrocartilaginous healing of avascular meniscus tears (Fig. 1).12 To determine the effects of CTGF dose and TGFβ3 release rates, we adopted our established bovine meniscus explant model.12 Briefly, both medial and lateral menisci were isolated from skeletally mature bovine knee joints provided by a local butcher shop. After isolating the inner 1/3 portion, wedge-shaped explants were prepared by cutting the menisci in the radial direction, resulting in 5–6 wedge-shaped tissue samples in ~5 mm thickness per whole meniscus.12 Then, a full-thickness tear was created using a surgical blade in the middle of the isolated inner third zone, followed by application of 50 μl fibrin gel with CTGF and TGFβ3-PLGA μS. High (1,000 ng/ml) and low (100 ng/ml) doses of CTGF and 10 mg of fast (75:25, lactic and glycolic acids) and slow (85:15) TGFβ3-encapsulated PLGA μS were applied. A single dose PLGA μS was applied to all the groups as optimized from our previous works12,24 in order to focus on the effect of release. Then, the meniscus explants were placed on top of monolayer-cultured P2–3 synovial MSCs12 at 80– 90% confluence. Supplements for fibrogenic and chondrogenic differentiation were applied as described in our recent publication.8,12,24 At 8 weeks, fibrocartilaginous tissue integration was evaluated by H&E and Saf-O staining. Collagen (COL) and glycosaminoglycan (GAG) assays were performed with 500 μm-thick tissue samples containing the healed region, and multi-scale mechanical tests were performed as per our prior methods.13–15 Histological outcome was then evaluated using a semi-quantitative scoring system (0–18) used for meniscus healing and repair.25 The recruited cells into the defect sites were measured by immunofluorescence with human nucleus antigen as per our prior methods.8 A total 10 meniscus explants were used per group.
Figure 1.
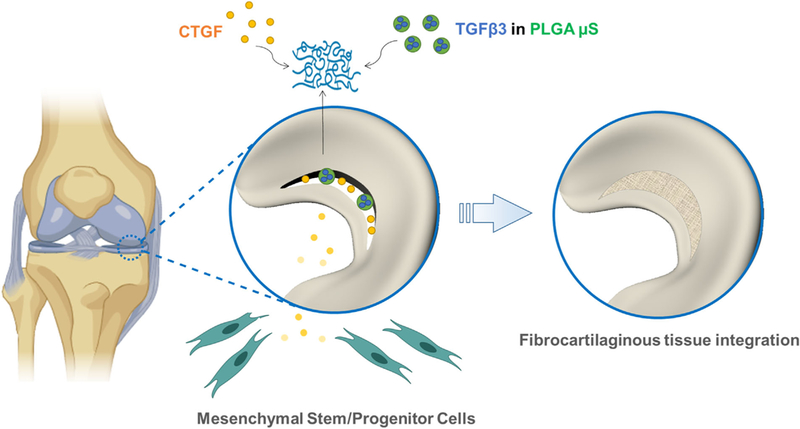
Strategy for healing avascular meniscus tears by stem/progenitor cell recruitment. CTGF and TGFβ3 encapsulated in PLGA μS are delivered via fibrin gel into the defect sites. Short-term release CTGF recruits the local MSCs and results in fibrocartilaginous integration along with sustained release TGFβ3.
Tensile Tests
Following our prior methods,19 samples for the pull-out tests were prepared using a cryotome to a thickness of 500–600 mm and a width of 1 mm.26 The meniscus samples were mounted with knurled faced tensile jigs (Product #336709–0010, TA Instruments, New Castle, DE) in an isotonic saline bath at RT, and a 0.02-N tare load was applied to the samples. Then, the samples were elongated at 10%/min until failure. From the force versus elongation curve, the ultimate strength and tensile modulus were obtained. All pull-out tests were performed by a blinder tester who has no group identifier using Electroforce® BioDynamics® system (Bose Corp., Eden Prairie, MN).
Modulus Mapping by Nanoindentation
PIUMA™ nano-indenter (Optics11, Amsterdam, the Netherlands) was used to perform modulus mapping following our prior methods.12 Briefly, nanoindentation tests were carried out on unfixed and unstained tissue sections27 under a maximum force of 10 mN using a probe with 9.5 mm radius and 57.1 N/m stiffness. Using the embedded high-precision mobile X-Y stage, a series of indentations were performed to determine the effective modulus (EEff) across a healed region every 20 mm from the original defect site. The distribution of EEff were graphed on X and Y axis of a locational coordination and the average EEff was calculated in 100 mm-width healing region as per our prior work.25
Automated Digital Imaging Processing for Fiber Orientation
Following our well-established protocols,14,28 collagen fiber orientation at the meniscus healing region was analyzed in Picrosirius Red (PR) stained tissue sections with circularly polarized microscopic images. Using the automated imageprocessing method,14,28 local directionality and angular deviation (AD) of collagen fibers were estimated. Briefly, our well-established automated imaging analysis detects fibers’ orientation by calculating the pixels’ intensity gradients. In order to achieve an accurate and reliable comparison in between groups, we obtained all the images under identical exposure and brightness. The AD values quantified the degree of collagen fiber alignment. The analysis algorithm was implemented with MATLAB (Mathworks Inc., Natick, MA).
Statistical Analysis
Upon confirmation of normal data distribution, all quantitative data of control and treatment groups were analyzed using one-way ANOVA with a post hoc Tukey test (p-value of 0.05) (Prism, Graphpad Software, San Diego, CA).
RESULTS
Release Kinetics of CTGF and TGFβ3
Consistent with our previous work,12 CTGF showed short-term release from fibrin gel up to 5 days, with no significant difference between the high (1,000 ng/ml) and low (100 ng/ml) initial doses (n = 5 per group; p < 0.01) (Fig. 2A). TGFβ3 showed a sustained release from PLGA μS up to the tested duration of 49 days with both compositions (75:25 and 85:15) (Fig. 2B). By 49 days of in vitro release, PLGA 75:25 showed a faster release than PLGA 85:15 (Fig. 2B). Quantitatively, the average daily release from PLGA 75:25 (0.46 ± 0.2ng/day) was significantly higher than that of PLGA 85:15 (0.29 ± 0.1ng/day) (n = 8 per group: p < 0.01) (Fig. 2C). The daily release from PLGA 75:25 showed a larger standard deviation than PLGA 85:15, suggesting PLGA 75:25 has less inhomogeneous release over time (Fig. 3C).
Figure 2.

In vitro release kinetics of CTGF and TGFβ3. CTGF in both high (1,000 ng/ml) and low (100 ng/ml) doses showed short-term release from fibrin gel up to ~5 days (A). TGFβ3 showed a sustained release from PLGA μS up to 42 days, with a faster release from PLGA 75:25 than PLGA 85:15 (B). Average daily release rate was significantly higher with PLGA 75:25 than PLGA 85:15 (C) (n=8 per group; *p<0.001). Data represented as mean±standard deviation.
Figure 3.
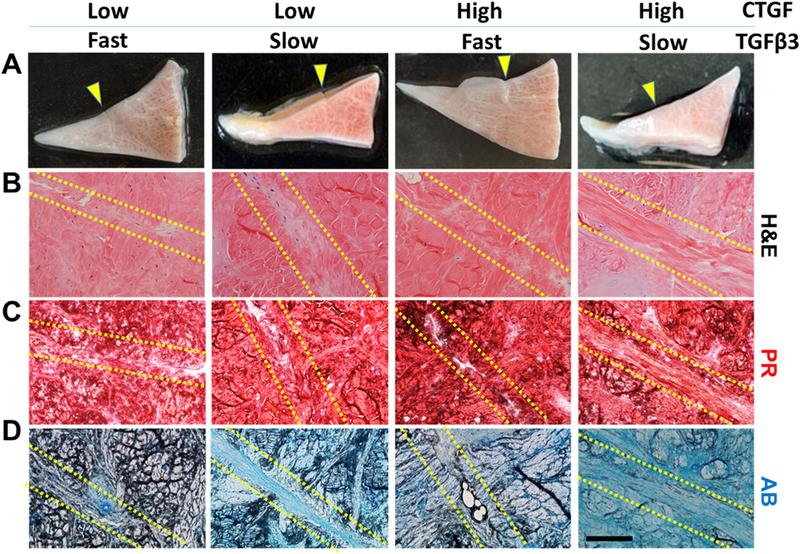
Healing of avascular meniscus tears by MSC recruitment with various doses and release rates of CTGF and TGFβ3. Macroscopically, all the CTGF doses and TGFβ3 release rates improved healing of avascular meniscus tears without a notable difference between groups (A) (arrows indicate the defect site). Histologically, tissue sections with H&E and Picrosirius Red (PR) staining showed better tissue integration with the high dose of CTGF than the low dose (B and C). AB-stained sections revealed a denser fibrocartilaginous matrix at the healing region with the slow TGFβ3 release than the fast release (D). Scale=200μm.
Meniscus Healing by CTGF and TGFβ3 μS
By 8 weeks of culture together with a mono-layer of MSCs, short-term (<5 days) release of CTGF (Fig. 2A) and sustained release (>49 days) of TGFβ3 (Fig. 2B) successfully induced integrative healing of avascular meniscus tears in a dose- and release rate-dependent manner (Fig. 3A–D). Immunofluorescence with human nucleus antigen (HNA) demonstrated recruitment of MSCs into the defect site by 1 week, with no obvious difference between high and low doses of CTGF (Supplementary Fig. S1A and B). Macroscopically, there was no obvious difference between the tested groups regarding the healing of the incised meniscus after 8 weeks (Fig. 3A). In the H&E and PR stained tissue sections, a high CTGF dose appeared to fail to show notable difference from the low CTGF doses (Fig. 3B and C). AB staining showed denser fibrocartilaginous matrix in the healing regions with slow release of TGFβ3 in comparison with fast release (Fig. 3D). Regarding integrated fibrocartilaginous tissue healing, the high CTGF dose and slow TGFβ3 release combination was likely superior to all the other combinations (Fig. 3A–D). In a higher magnification, the low CTGF dose and fast TGFβ3 release resulted in a higher cellularity in the healing zone as compared to the other groups (Supplementary Fig. S2). Histological scores were significantly higher in the slow release of TGFβ3 in comparison with the fast release (Supplementary Fig. S3).
COL and GAG Contents
By 8 weeks, total COL contents in healed regions were significantly higher after slow release of TGFβ3 compared to fast release for both high and low doses of CTGF (Fig. 4A). With the slow TGFβ3 release rate, the high dose of CTGF resulted in significantly higher COL than the low CTGF dose (Fig. 4A). The COL contents were the highest with high CTGF dose and slow TGFβ3 release, as compared to all other tested combinations (Fig. 4A). Similarly, total GAG contents were significantly higher with the slow TGFβ3 release in comparison with the fast TGFβ3 release (Fig. 4B).
Figure 4.
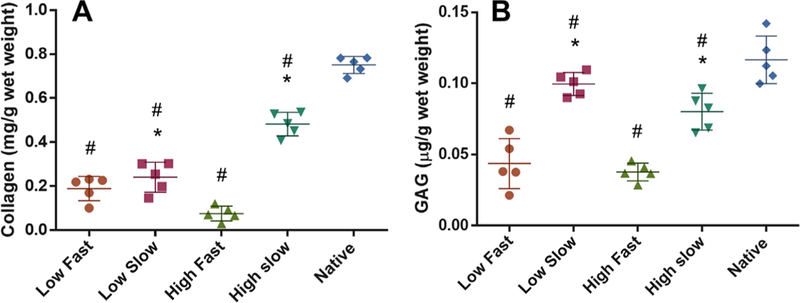
Collagen (COL) and GAG assays. Total COL contents at the healing region were significantly higher in the high CTGF dose and the slow TGFβ3 release as compared to the low dose and the fast release (A). Total GAG contents at the healing region was significantly higher with the slow TGFβ3 release in comparison with the fast release (B). The low CTGF and the slow TGFβ3 release showed the highest GAG amounts among all the groups (B) (n=5 per group; *p<0.01 compared to the fast; #p<0.01 compared to native). Data represented as mean±standard deviation.
With the slow TGFβ3 release, the low CTGF dose showed significantly higher GAG than the high CTGF dose (Fig. 4B). The low CTGF dose and the slow TGFβ3 release led to the highest GAG contents among all the tested combinations (Fig. 4B).
Collagen Fibers Orientation
Our automated digital imaging process demonstrated that the high dose CTGF and slow release of TGFβ3 resulted in more highly aligned collagen fibrils in the healing zone, as compared to the other groups (Fig. 5A). Histograms of fiber orientation angles consistently demonstrated that the high dose CTGF and slow release of TGFβ3 resulted in densely aligned collagen fibers compared to randomly aligned fibers in the other groups (Fig. 5B). Quantitatively, the angular deviation (AD) of collagen fibrils were significantly lower in the high dose of CTGF and slow release of TGFβ3, as compared to the other groups (Fig. 5C).
Figure 5.
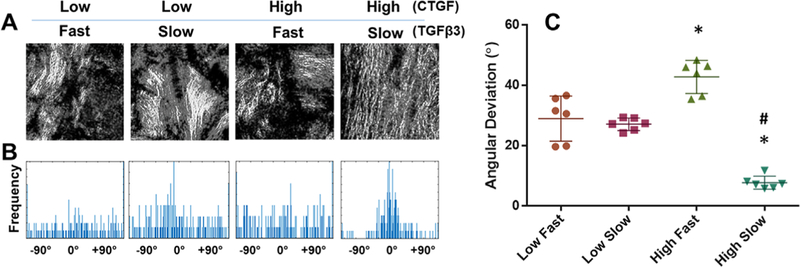
Quantitative image analysis for collagen fiber alignments. Collagen fibers at the healing zone were denser and more aligned with the high CTGF dose and the slow TGFβ3 release than all the other combinations (A). Consistently, the angular distribution of collagen fibers was narrower with the high CTGF dose and the slow TGFβ3 release compared to the other groups (B). Quantitatively, AD was significantly lower with the high CTGF dose and the slow TGFβ3 release compared to the other combinations (C) (n=6 per group; *p<0.001 compared to low dose; # p<0.001 compared to the fast release). Data represented as mean±standard deviation.
Mechanical Properties
Consistent with the histological and biochemical assays described above, the tensile modulus and ultimate strength of the healed tissue were significantly higher in the high dose of CTGF and the slow release of TGFβ3 (Fig. 6A and B). Modulus mapping with nanoindentation showed the distribution of effective indentation modulus (EEff) over healing regions (Fig. 7A). The healing region showed lower EEff compared to adjacent meniscus tissues, with some improvement in EEff with the slow TGFβ3 release compared to the fast release for both high and low CTGF doses (Fig. 7A). Quantitatively, average EEff was significantly higher with the slow TGFβ3 release than the fast release for both high and low doses of CTGF (Fig. 7B) (n = 8–15 per group; p < 0.05).
Figure 6.
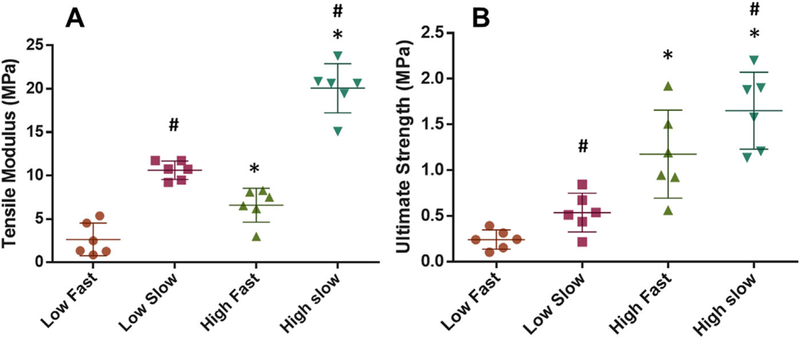
Mechanical properties of the healed meniscus tissues after 8 wks. The tensile modulus was significantly higher in the high dose of CTGF and the slow release of TGFβ3 (A). Consistently, the high CTGF dose and the slow TGFβ3 release resulted in the highest ultimate strength among the tested combinations (B) (n=6 per group; *p<0.001 compared to low dose; #p<0.001 compared to fast). Data represented as mean±standard deviation.<!——!>
Figure 7.
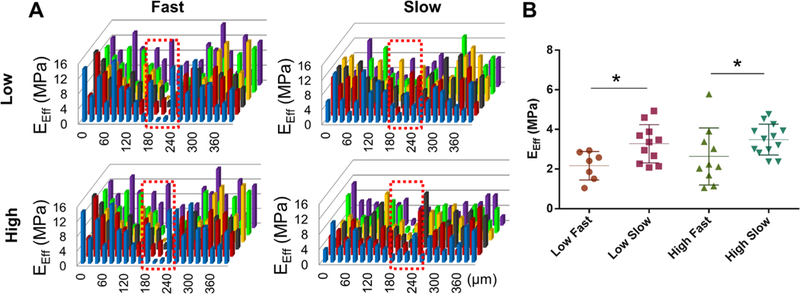
Modulus mapping with nanoindentation. Distribution of effective indentation modulus (EEff) showed the gap at the healing region (indicated by red dotted box) (A). The average EEff at the healing region was significantly higher with the slow TGFβ3 release rate (B) (n=8–15 per group; *p <0.001). Data represented as mean±standard deviation.
DISCUSSION
We have recently devised a strategy to guide healing of avascular meniscus tears by controlled delivery of CTGF and TGFβ3.12 Short-term release CTGF recruited MSCs into the defect site and formed an intermediate fibrous integration, whereas sustained release TGFβ3 led to fibrocartilaginous remodeling for healing of avascular meniscus tears in vitro.12 As a follow-up, the present study suggests that the dose of CTGF and the release rate of TGFβ3 are contributing factors to the timing and quality of avascular meniscus healing by MSC recruitment. Despite the expected role of CTGF as a chemotactic factor, the high (1,000 ng/ml) and low (100ng/ml) doses of CTGF resulted in no significant difference in number of recruited MSCs into the defect site. This observation suggests that 100 ng/ml is a sufficient dose for induction of cell recruitment, which is consistent with our previous work.14,15 In contrast, the profibrogenic function of CTGF appears to be dose-dependent and associated with the activities of TGFβ3 in meniscus healing. For instance, with fast TGFβ3 release, high-dose CTGF resulted in less COL than low-dose, with no difference in GAG contents. With slow TGFβ3 release, however, the high CTGF dose yielded less GAG than the low dose. Thus, the dose-dependent effects of CTGF and the role of TGFβ3 release rate are likely complementary.
In order to provide a sustained release of TGFβ3 with a controlled rate, we applied a double-emulsion technique to encapsulate TGFβ3 in PLGA μS. Since TGFβ3 is released and PLGA undergoes degradation by hydrolysis, we applied a higher ratio of lactic acids to glycolic acids in order to lower the release rate and degradation rate. In this study, we tested PLGA (75:25 and 85:15), which has been widely used for controlled delivery in tissue engineering applications. We omitted PLGA 50:50 due to its relatively fast degradation time (<1 month) that leads to an unsatisfactory efficiency, as demonstrated by our pilot studies. The PLGA ratio, molecular weight and the particle size affect the degradation rate of PLGA, consequently changing the release rate. High molecular weight (MW) and larger particle size can further delay PLGA degradation. Given that the present findings suggest higher efficiency with slower TGFβ3 release, we will follow up with various combinations of MW and particle sizes to investigate the effects of further prolonged release of TGFβ3 in meniscus healing. In addition, in vivo studies will be designed to understand the long-term effects of further prolonging TGFβ3 release on functional restoration of meniscus tears in the knee joint environment using a preclinical animal model.
We performed a series of biochemical and functional assays to evaluate the outcome of meniscus healing with the outcomes corresponding well to each other. The quantitative alignment of collagen fibers in the healing region showed an outcome pattern consistent with that of the tensile properties. Similarly, the outcome patterns of collagen and GAG contents corresponded to those of the tensile properties and indentation moduli. Despite these generally consistent outcome patterns, the quantitative measures showed some mismatches to each other as well. For instance, total collagen and GAG contents with the high CTGF dose and the slow TGFb3 release reached 62.5–65.2% of those of native tissues, but the effective indentation modulus (EEff) ended up with only 34.6–37.3% of native properties. This observation likely suggests suboptimal tissue remodeling and maturation by 8 weeks, thus advocating a need for longer-term follow-up studies both in vitro and in vivo.
Our collective data demonstrated that 1,000 ng/ml of CTGF and slow (0.29 ± 0.1ng/day) release of TGFβ3 from PLGA 85:15 are the most effective combination for avascular meniscus healing among all the tested combinations in this study. As an inevitable dosing study, this study may represent an important step toward development of a regenerative therapy for healing avascular meniscus tears by stem/progenitor cell recruitment. Our strategy to induce avascular meniscus healing by endogenous cell recruitment shows potential for overcoming the limitations of current stem cell-based approaches to treat meniscus injuries.
Supplementary Material
ACKNOWLEDGMENTS
This study is supported by NIH/NIAMS 5R01AR071316–02 and 5R01AR065023–05 to C.H.L. Potential conflict of interest to J.L.C. is disclosed in accordance to the policy of Journal of Orthopaedic Research.
Grant sponsor: NIH/NIAMS; Grant numbers: 5R01AR071316–02, 5R01AR065023–05.
Footnotes
SUPPORTING INFORMATION
Additional supporting information may be found in the online version of this article.
REFERENCES
- 1.Athanasiou KA, Sanchez-Adams J. 2009. Engineering the knee meniscus. San Rafael, California: Morgan and Claypool Publishers. [Google Scholar]
- 2.Cheung HS. 1987. Distribution of type I, II, III and V in the pepsin solubilized collagens in bovine menisci. Connective Tissue Res 16:343–356. [DOI] [PubMed] [Google Scholar]
- 3.CDC. 2011. Center for Disease Control and Prevention Report. [Google Scholar]
- 4.Cook JL, Fox DB. 2007. A novel bioabsorbable conduit augments healing of avascular meniscal tears in a dog model. Am J Sports Med 35:1877–1887. [DOI] [PubMed] [Google Scholar]
- 5.Baker BM, Gee AO, Sheth NP, et al. 2009. Meniscus tissue engineering on the nanoscale: from basic principles to clinical application. J Knee Surg 22:45–59. [DOI] [PMC free article] [PubMed] [Google Scholar]
- 6.Noyes FR, Barber-Westin SD. 2010. Repair of complex and avascular meniscal tears and meniscal transplantation. J Bone Joint Surg Am 92:1012–1029. [PubMed] [Google Scholar]
- 7.Nepple JJ, Dunn WR, Wright RW. 2012. Meniscal repair outcomes at greater than five years: a systematic literature review and meta-analysis. J Bone Joint Surgery Am 94:2222–2227. [DOI] [PMC free article] [PubMed] [Google Scholar]
- 8.Lee CH, Rodeo SA, Fortier LA, et al. 2014. Protein-releasing polymeric scaffolds induce fibrochondrocytic differentiation of endogenous cells for knee meniscus regeneration in sheep. Sci Transl Med 6:266ra–171. [DOI] [PMC free article] [PubMed] [Google Scholar]
- 9.Patel JM, Brzezinski A, Raole DA, et al. 2018. Interference screw versus suture endobutton fixation of a fiber-reinforced meniscus replacement device in a human cadaveric knee model. Am J Sports Med 46:2133–2141. [DOI] [PubMed] [Google Scholar]
- 10.Patel JM, Ghodbane SA, Brzezinski A, et al. 2018. Tissue-engineered total meniscus replacement with a fiber-reinforced scaffold in a 2-year ovine model. Am J Sports Med 46:1844–1856. [DOI] [PubMed] [Google Scholar]
- 11.Qu F, Pintauro MP, Haughan JE, et al. 2015. Repair of dense connective tissues via biomaterial-mediated matrix reprogramming of the wound interface. Biomaterials 39:85–94. [DOI] [PMC free article] [PubMed] [Google Scholar]
- 12.Tarafder S, Gulko J, Sim KH, et al. 2018. Engineered healing of avascular meniscus tears by stem cell recruitment. Sci Rep 8:8150. [DOI] [PMC free article] [PubMed] [Google Scholar]
- 13.Lee CH, Cook JL, Mendelson A, et al. 2010. Regeneration of articular surface of synovial joint by cell homing. Lancet 376:440–448. [DOI] [PMC free article] [PubMed] [Google Scholar]
- 14.Lee CH, Lee FY, Tarafder S, et al. 2015. Harnessing endogenous stem/progenitor cells for tendon regeneration. J Clin Invest 125:2690–2701. [DOI] [PMC free article] [PubMed] [Google Scholar]
- 15.Lee CH, Shah B, Moioli EK, et al. 2010. CTGF directs fibroblast differentiation from human mesenchymal stem/ stromal cells and defines connective tissue healing in a rodent injury model. J Clin Invest 120:3340–3349. [DOI] [PMC free article] [PubMed] [Google Scholar]
- 16.Kim K, Lam J, Lu S, et al. 2013. Osteochondral tissue regeneration using a bilayered composite hydrogel with modulating dual growth factor release kinetics in a rabbit model. J Controlled Release 168:166–178. [DOI] [PMC free article] [PubMed] [Google Scholar]
- 17.Moioli EK, Hong L, Guardado J, et al. 2006. Sustained release of TGFbeta3 from PLGA microspheres and its effect on early osteogenic differentiation of human mesenchymal stem cells. Tissue Eng 12:537–546. [DOI] [PMC free article] [PubMed] [Google Scholar]
- 18.Gokce A, Yilmaz I, Bircan R, et al. 2012. Synergistic effect of TGF-beta1 and BMP-7 on chondrogenesis and extracellular matrix synthesis: an in vitro study. Open Orthop J 6:406–413. [DOI] [PMC free article] [PubMed] [Google Scholar]
- 19.Rey-Rico A, Venkatesan JK, Sohier J, et al. 2015. Adapted chondrogenic differentiation of human mesenchymal stem cells via controlled release of TGF-beta1 from poly(ethylene oxide)-terephtalate/poly(butylene terepthalate) multiblock scaffolds. J Biomed Mater Res A 103:371–383. [DOI] [PubMed] [Google Scholar]
- 20.Solorio LD, Dhami CD, Dang PN, et al. 2012. Spatiotemporal regulation of chondrogenic differentiation with controlled delivery of transforming growth factor-beta1 from gelatin microspheres in mesenchymal stem cell aggregates. Stem Cells Transl Med 1:632–639. [DOI] [PMC free article] [PubMed] [Google Scholar]
- 21.Solorio LD, Fu AS, Hernandez-Irizarry R, et al. 2010. Chondrogenic differentiation of human mesenchymal stem cell aggregates via controlled release of TGF-beta1 from incorporated polymer microspheres. J Biomed Mater Res A 92:1139–1144. [DOI] [PMC free article] [PubMed] [Google Scholar]
- 22.Solorio LD, Vieregge EL, Dhami CD, et al. 2012. Engineered cartilage via self-assembled hMSC sheets with incorporated biodegradable gelatin microspheres releasing transforming growth factor-beta1. J Controlled Release 158:224–232. [DOI] [PMC free article] [PubMed] [Google Scholar]
- 23.Lee CH, Marion NW, Hollister S, et al. 2009. Tissue formation and vascularization in anatomically shaped human joint condyle ectopically in vivo. Tissue Eng A 15: 3923–3930. [DOI] [PMC free article] [PubMed] [Google Scholar]
- 24.Tarafder S, Koch A, Jun Y, et al. 2016. Micro-precise spatiotemporal delivery system embedded in 3D printing for complex tissue regeneration. Biofabrication 8:025003. [DOI] [PubMed] [Google Scholar]
- 25.Nakagawa Y, Muneta T, Kondo S, et al. 2015. Synovial mesenchymal stem cells promote healing after meniscal repair in microminipigs. Osteoarthritis Cartilage 23:1007–1017. [DOI] [PubMed] [Google Scholar]
- 26.Kalpakci KN, Willard VP, Wong ME, et al. 2011. An interspecies comparison of the temporomandibular joint disc. J Dental Res 90:193–198. [DOI] [PMC free article] [PubMed] [Google Scholar]
- 27.Akhtar R, Schwarzer N, Sherratt MJ, et al. 2009. Nanoindentation of histological specimens: mapping the elastic properties of soft tissues. J Mater Res 24: 638–646. [DOI] [PMC free article] [PubMed] [Google Scholar]
- 28.Lee CH, Shin HJ, Cho IH, et al. 2005. Nanofiber alignment and direction of mechanical strain affect the ECM production of human ACL fibroblast. Biomaterials 26: 1261–1270. [DOI] [PubMed] [Google Scholar]
Associated Data
This section collects any data citations, data availability statements, or supplementary materials included in this article.


