Abstract
Building a data-driven model to localize the origin of ventricular activation from 12-lead electrocardiograms (ECG) requires addressing the challenge of large anatomical and physiological variations across individuals. The alternative of a patient-specific model is, however, difficult to implement in clinical practice because training data must be obtained through invasive procedures. Here, we present a novel approach that overcomes this problem of the scarcity of clinical data by transferring the knowledge from a large set of patient-specific simulation data while utilizing domain adaptation to address the discrepancy between simulation and clinical data. The method that we have developed quantifies non-uniformly distributed simulation errors, which are then incorporated into the process of domain adaptation in the context of both classification and regression. This yields a quantitative model that, with the addition of 12-lead ECG data from each patient, provides progressively improved patient-specific localizations of the origin of ventricular activation. We evaluated the performance of the presented method in localizing 75 pacing sites on three in-vivo premature ventricular contraction (PVC) patients. We found that the presented model showed an improvement in localization accuracy relative to a model trained on clinical ECG data alone or a model trained on combined simulation and clinical data without considering domain shift. Further, we demonstrated the ability of the presented model to improve the real-time prediction of the origin of ventricular activation with each added clinical ECG data, progressively guiding the clinician towards the target site.
Keywords: Patient-specific model, 12-lead ECG, cardiac electrophysiology, domain adaptation
I. Introduction
VEntricular arrhythmia involves abnormal electrical activity inside the ventricles, which predisposes the heart to mechanical catastrophe. Localizing the origin of abnormal ventricular activation is of therapeutical importance in the treatment of many ventricular arrhythmias, such as premature ventricular contraction (PVC) and scar-related ventricular tachycardia [1], [2]. Because the origin of ventricular activation largely determines the QRS morphology of 12-lead ECG [2], one current technique involves physically stimulating multiple myocardial sites until finding the site at which pacing reproduces the QRS morphology of the arrhythmia (i.e., the pace-matched site). This practice – known as pace-mapping – is of a trial-and-error nature and relies on a clinicians ability to rapidly interpret ECG data. A quantitative model that uses 12-lead ECG data to automatically and progressively guide the clinician to the origin of ventricular activation in real time has the potential to improve the accuracy and efficiency of localizing the site of pace-match.
One potential strategy is to train a model from pace-mapped ECG data with labeled sites of pacing from a large cohort of patients (i.e., a population model). This approach was pioneered in [3] where a support vector machine (SVM) was used to localize the origin of ventricular activation into ten predefined segments of the left ventricle (LV). Recently, multiple linear regression was used to predict the 3D coordinate of the origin of ventricular activation from 12-lead ECG [4]. However, there exist large anatomical and physiological variations in ECG data across individuals, which lead to a limited accuracy when a population model is applied to a new patient. Furthermore, a population model lacks the flexibility to be improved by new data from a specific patient of interest, making it unsuitable for providing the clinician with real-time progressive guidance towards the target site.
An alternative strategy is to build a customized prediction model for each patient that can be improved by each added pace-mapping data on the patient. However, if relying on pace-mapping data only, a sufficient number of locations will need to be paced on each patient before the model can make accurate predictions. Moreover, as shown in [4], the prediction accuracy is heavily reliant on the distance between the training sites and the actual target site. This strategy is impractical to implement in clinical practice and defeats the models intended purpose of guiding pace-mapping. One way to overcome this limitation is to utilize ECG data generated from image-based patient-specific simulation, which incorporates both rich physiological knowledge and patient-specific anatomical information derived from tomographic scans (e.g., CT or MRI). This has been exploited in existing works [5], [6], where a patient-specific ECG database of ectopic activations is generated from image-based simulation and used to develop methods, such as template matching, to localize the origin of ventricular activation given clinical ECG data. The abundance of simulation data potentially provides knowledge about ECG originating from all possible locations on a ventricle, without requiring any pace-mapping to be carried out on a patient to train a model. However, the accuracy of this type of model can be affected by the discrepancy between the simulated and real ECG data due to assumptions, simplifications, and potential errors in the simulation model.
In the present study, we associate the above challenge with a common machine-learning scenario where there is limited data for training in the domain of interest (target domain) but an abundance of data in a related domain (source domain) [7]. Domain adaptation is a sub-field of transfer learning that addresses this challenge by considering the data distributional shifts between the source and target domain. Significant progress has been made in domain adaptation, especially in the field of computer vision [7]. For example, in [8], a feature transformation matrix between the source and target domains was learned using metric learning. Subsequently, a max-margin domain transform (MMDT) method was presented to jointly learn the matrix of feature transformation and the parameter of an SVM classifier [9]. Among existing works in domain adaptation, however, little attention is given to potential errors that may be non-uniformly distributed within the source data. We argue that, in the application context of this study, there is a potential presence of errors that vary across the simulation data, which needs to be quantified and incorporated into domain adaptation.
Specifically, using domain adaptation, we transfer the knowledge from simulated ECG data to minimize the need for pace-mapping data in predicting the origin of ventricular activation. To account for potential errors in simulation data, we have devised a novel strategy to measure the quality of simulation data utilizing a small amount of clinical data. In a classification setting, we incorporate simulation errors into the SVM-based MMDT algorithm [9] and use it to localize the origin of ventricular activation into one of 24 predefined ventricular segments. In a regression setting, we incorporate simulation errors into the metric learning algorithm presented in [8] and use it to predict the 3D coordinate of the origin of ventricular activation. This allows us to introduce a scheme to improve the model with each added clinical ECG data, guiding the clinician progressively closer to the target site in real time.
We evaluate the presented method on three PVC patients in localizing a total of 75 pacing sites from 12-lead ECG [10]. Then, we compare the results with three alternative approaches to patient-specific modeling: a model trained only on clinical ECG data, a model trained on combined simulation and clinical data without considering domain shift, and a model trained on combined simulation and clinical data with domain adaptation but without addressing potential simulation errors. In this comparison, we investigate the effect of using a varying number of clinical ECG data (4–15) for training. Further, we retrospectively emulate the proposed scheme of progressive prediction on the three patients. Finally, we compare the localization accuracy of the presented method with that obtained by a physics-based approach, known as electrocardiographic imaging (ECGI), on the same patients [11]. Our results show that the presented method has the potential to provide real-time guidance for localizing the origin of ventricular activation within a small number of pacing sites. We make the following key contributions in this paper:
We introduce the concept of domain adaptation to transfer knowledge from abundant simulation data to a small amount of clinical data, in order to localize the origin of ventricular activation from 12-lead ECG data.
We devise a novel method to quantify and incorporate non-uniformly distributed simulation errors to improve the accuracy of domain adaptation.
We introduce and emulate a strategy to progressively guide clinicians to the origin of ventricular activation in real time.
We demonstrate the efficacy of incorporating knowledge from simulation data while addressing the discrepancy between simulated and clinical data through a comprehensive comparison study.
We compare the performance of the presented data-driven approach to a physics-based approach in localizing the origin of ventricular activation on the same dataset, with an in-depth discussion of the differences in performance
II. Image-based ECG Simulation with Error Quantification
The presented method consists of two main elements. First, using a patient-specific model, a large set of ECG data is simulated from ventricular activation originating at various locations of the ventricles. Second, using a small amount of clinical data, the quality of the simulated ECG data is measured according to its origin of ventricular activation.
A. Image-based Patient-specific ECG Simulation
The process of generating a simulated 12-lead ECG database includes three main steps. First, a patient-specific anatomical model of the heart and torso is extracted from medical images. Second, a personalized cardiac electrophysiological model is used to simulate activations originating from all possible ventricular locations. Third, for each simulated activation within the heart, 12-lead ECG is simulated on the torso based on electromagnetic theory.
1). Image-based Personalized Anatomical Models:
From cardiac tomographic scans (e.g., CT or MRI) of a patient, a 3D bi-ventricular model is first customized to the patient. a 3D fiber structure of the patient-specific ventricular model is constructed to allow anisotropic conduction. Fiber orientations at the epicardial and endocardial surfaces are mapped from a canine ventricular fibrous model established in [12]. Fiber orientations inside the myocardium are then interpolated from those on the surface, assuming a linear counterclockwise rotation [13].
Because ECG data are affected by the anatomical shape of the torso and the position of surface electrodes [14], a patient-specific torso model is also extracted from the tomographic scans of a patient (subject). We assume the torso to be an isotropic and homogeneous volume conductor.
2). Personalized Cardiac Electrophysiological Modeling:
On the patient-specific ventricular model, activation sequences originating at different ventricular locations are simulated using the macroscopic mono-domain Aliev-Panfilov model [15]:
| (1) |
where u stands for the transmembrane potential (TMP), z for the recovery current, and D for the diffusion tensor. ǫ, c, and a are parameters that control local TMP shape. This model is solved numerically on the patient-specific ventricular model using the mesh-free method as detailed in [16]. A large set of simulation data is generated using each node in the ventricular mesh as the origin of ventricular activation. On average, we consider a ventricular mesh with a spatial resolution of ∼5-mm. This is the size of a typical ablation lesion and is the highest resolution that is clinically necessary to localize an origin of ventricular activation.
3). Simulation of Patient-specific ECG Database:
On the patient-specific heart-torso model, the relationship between the TMP and the surface ECG is governed by the quasi-static electromagnetic theory:
| (2) |
| (3) |
where Di is the intracellular conductivity tensor, σk is the bulk conductivity, σt is the torso conductivity, φtk is the extracellular potential in the myocardium, φt is the body surface potential, Ωh is the domain of the ventricular mesh, and Ωt/h is the domain between the ventricular surfaces and body surface. These equations are solved on the 3D patient-specific heart-torso model using the combined Boundary-Element and Meshfree strategy as described in [16].
Twelve-lead ECG can be extracted from the simulated body-surface ECG maps, producing a simulated database of 12-lead ECG with known origin of ventricular activation. Because the Aliev-Panfilov model is unitless, the simulated ECGs are scaled in both amplitude and time to a physiologically meaningful range. The amplitude is scaled by 110φ 90 to bring the Aliev-Panfilov model output (0 1) to the physiological range of TMP ( 90 20 mV). For temporal scaling, a mean ratio is calculated between QRS durations in simulated and clinical ECG data, which is then applied to all simulated ECGs.
B. Quantification of ECG Simulation Quality
A general discrepancy exists between simulated and clinical data due to assumptions and simplifications involved in simulation models. This discrepancy, however, may vary spatially. As a result, simulated ECG data originating from certain ventricular locations may be less similar to clinical ECG data than to data originating from other ventricular locations. In our dataset, simulated ECG data originating within the septum are in general observed to be less similar to their clinical counterparts, compared with ECG data originating from other ventricular locations. Therefore, we propose to model this spatially non-uniform quality of simulation by utilizing a small amount of available clinical ECG data obtained during pacemapping.
We denote the simulated data (source domain DS ) as with labels and target data (target domain with labels , where the number of simulated data N is significantly larger than the number of clinical data M. We measure the quality of the simulated ECG data as a function of the origin of the ventricular activation in the following three steps:
1. Measure the quality of simulated ECG data using available clinical data:
Correlation coefficients between a paced ECG and the target ECG from the ventricular tachycardia (VT) are a primary metric used to identify the pace-matched site in conventional pace-mapping [17]. We therefore base the quantification of simulation quality on this metric. Given a pair of simulated and clinical ECG data originating from the same location, we measure their similarity using the Pearson correlation coefficient: . This yields a partial map that shows how the quality of the simulation data varies in space at limited locations where clinical ECG data are available.
2. Learn the spatially-varying similarity map across the ventricles:
To estimate the quality of the simulation data at locations where clinical ECGs are not available, we train a regression model for the similarity measure ρ(x, y, z) as a function of the spatial coordinate (x, y, z). We use support vector regression (SVR) model with the radial basis kernel [18]. Trained with ρj at limited spatial locations obtained in Step 1, it generates the similarity measure across the ventricles.
3. Scale the similarity map to emphasize the penalty for large errors:
We intend to utilize the similarity map to recognize and penalize inaccurate simulation data in domain adaptation. We argue that simulation data of reasonable quality (e.g., ρ(x, y, z) ≥ 0.5) should be treated similarly, whereas a drastically increasing penalty should be applied as the quality decreases below that range (e.g., ρ(x, y, z) < 0.5). We thus scale ρ(x, y, z) with a modified sigmoid function: which can be visualized in Fig. 1. Evaluating Ψ(x, y, z) on each node in the cardiac mesh yields us the quality measure for all simulated ECG data.
Fig. 1.
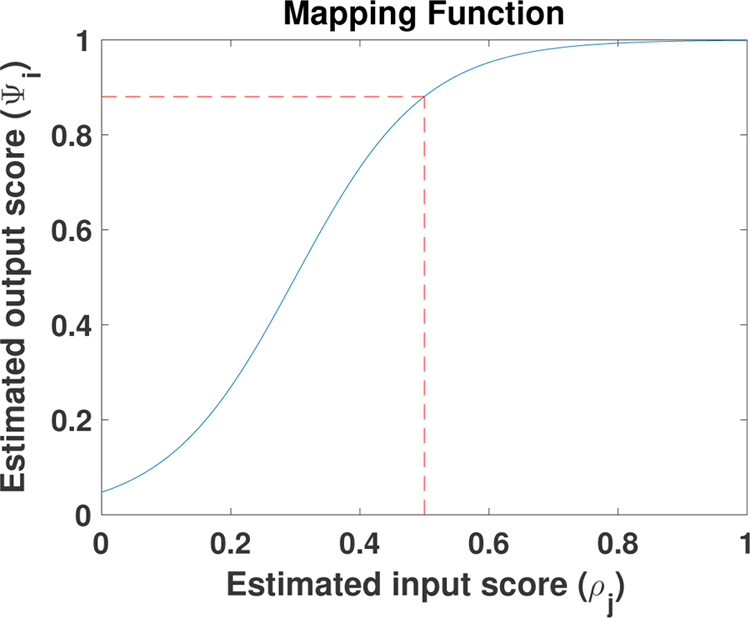
Mapping function. This modified sigmoid function transforms ρi ≥ 0.5 to a similar output score ψi, but it transforms ρi < 0.5 to a drastically decreasing output score ψi. Th red dotted line shows an example when the input score is 0.5 the output estimated score will be 0.88
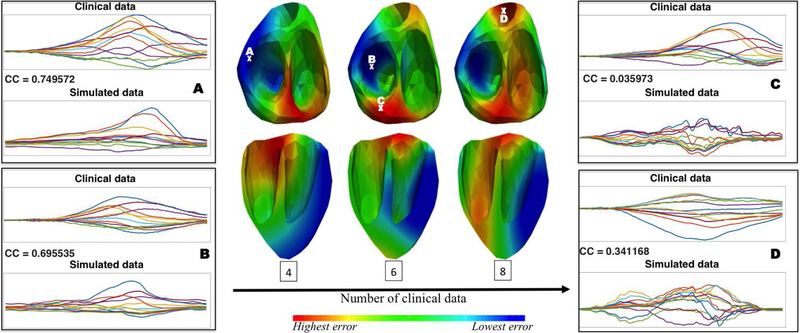
Intuitively, as more clinical data become available, the learned similarity map will more faithfully reflect the actual distribution of the ECG simulation error according to the origin of ventricular activation. Fig. 2 shows an example of the agreement between the actual simulation quality at selected sites and the learned similarity map as more clinical data are used for training. Note that the low similarity between the simulated and clinical data at selected points C and D was not captured in the learned similarity map until more clinical ECG data were incorporated for training.
Fig. 2.
Illustration of the change in the learned similarity map as the number of clinical data increases (middle panel), in comparison with examples of clinical versus simulated ECG data with their actual correlation coefficients (CC) at selected sites (A, B, C, and D). This provides an example of the agreement between the actual simulation quality at selected sites and the learned similarity map as more clinical data are used for training.
III. Domain Adaptation with Uncertainty
In this section, we modify existing domain adaptation methods using the similarity map obtained in section II-B to address the shift between simulated and clinical ECG data during knowledge transfer. We consider the localization of the origin of ventricular activation in two settings. First, we predict the exact 3D coordinates of the origin of ventricular activation using a regression model, which also allows for the development of progressive prediction with each added pacing site. Second, we localize a predefined anatomical segment as the origin of activation in the form of a classification solution.
A. Regression-based Domain Adaptation
Regression-based domain adaptation has not been well investigated, except in a theoretical study in [19]. Here, we present a distance-based approach to first learn an optimal distance metric between the simulated and clinical domain, and we then use the learned distance metric in combination with the k-nearest-neighbor (kNN) method to predict the coordinates of the activation origin of ventricular activation from ECG data.
To learn the distance metric between a source and target domain, Saenko et al [8] presented an approach based on the concept of Mahalanobis distance as described in [20]. Given data in the source domain and target domain , their Mahalanobis distance can be measured by parameterized by a positive-definite matrix W. To learn W from training data, is regularized to be close to a given Mahalanobis distance function parameterized by W0, with a set of similarity and dissimilarity constraints [20]:
| (4) |
where KL is the Kullback-Leibler divergence, and is a multivariate Gaussian, with Z being the normalizing constant and W−1 the covariance of the distribution. W0, per the standard definition of Mahalanobis distance, is often taken as the covariance matrix between the source and target data. The distance between W0 and W is minimized by minimizing the Kullback-Leibler divergence between the two multivariate Gaussian [8]. The constraints specify that two data points sharing the same label should have a dW smaller than a relatively small value of u; otherwise, their dW should be larger than a relatively large value of l. In practice, for example, u can be assigned as the 5th percentile value of all Euclidean distances between the source and target data, and l as the 95th percentile value.
While the similarity/dissimilarity between two data points is in a binary fashion in the setting of classification, it is in a continuous fashion in the setting of regression. Here, we argue that the dissimilarity between the ECG data originating from two ventricular locations should be proportional to the distance between the two origins. Therefore, we modify the dissimilarity lower bound of l to be a function of the distance between two origins: , where is the Euclidean distance between a source origin (coordinate ) and a target origin (coordinate ) of interest, dst includes Euclidean distances between every pair of source and target data, and B and A are pre-defined ranges of lower bound in terms of the percentile values in dst. Here, we use 80th and 95th percentiles. In this way, the closer the pair is in the origin of activation, the smaller the lower bound will be for their dissimilarity measure.
For source and target ECG originating from the same location, the similarity upper bound u holds with the exception that we also take into account the simulation quality: if between and is lower than a certain threshold, we will remove it from the similarity constraint. This gives us a modified optimization problem:
| (5) |
where and N is the number of source data. This is solved as described in [20].
Progressive Prediction for Real-time Guidance:
The ultimate context in which we envision the application of the proposed regression model is to provide real-time, continuous guidance in the process of pace-mapping We thus present a scheme in which, at the beginning of the pace-mapping procedure, an initial prediction of the location of the origin of ventricular activation will be obtained using only the simulation data. The clinician will pace the predicted location and examine the morphology of the generated clinical 12-lead ECG. The model will be updated by the newly obtained 12-lead ECG data using the domain adaptation regression technique described above. A new prediction will be made and new pace-mapping data will be collected at the predicted site. This process will continue until the clinician finds a pace-matched site of interest. As more pace-mapping data become available for adapting the model from the simulated data, the presented model is expected to guide the clinician progressively toward the target site.
B. Classification-based Domain Adaptation
The classification setting involves localizing the origin of ventricular activation into one of several predefined anatomical segments of the ventricles – a problem frequently considered in previous studies [3]. In this setting, we use a classic domain adaptation technique known as the MMDT [9]. It simultaneously learns a linear transformation W between the source and target domain in a similar way to that described in [8], along with an SVM optimal for the source and transformed target data, formulated for a K-class problem as:
| (6) |
where the affine hyperplane θk and offset bk are parameters of the SVM, and k = 1, 2, · · · , K. ζ() is the hinge loss with the corresponding parameters CS and CT. In the standard MMDT, a predefined value of CS and CT is used for hinge losses across all source and target data, respectively. Here, we propose that the parameter controlling hinge losses from the source domain vary with each simulated ECG dataset. Specifically, we multiply CS by the quality measure that is associated with each individual as defined in section II-B. This gives us a modified cost function:
| (7) |
In this way, a high-quality simulation ECG signal with will be unaffected during the optimization, whereas a low-quality ECG signal with will have a reduced effect on the optimization of SVM parameters, until close to having no effect as approaches 0. Following [9], equation (7) is solved by an iterative procedure. In each iteration, SVM parameters are first estimated using both source data and target data transformed by the previously learned W. Then, W is updated as described in [9].
IV. Experiments and Results
In this section, we first describe the simulated and clinical data used in the experiments, as well as the data processing procedure. Next, we compare the performance of the presented method with three alternative patient-specific prediction models in terms of both classification and regression settings. Then, we present results from retrospectively emulating the use of the presented regression method in guiding ablation procedures. Finally, we compare the presented method with an alternative physics-based approach on the same dataset.
A. Data and Data Processing
The presented method is evaluated on 12-lead ECG data collected during endocardial pacing from three PVC patients, made available through the Experimental Data and Geometric Analysis Repository (EDGAR) database [10]. For each patient, there is a mean of 25±6 ECG data points from distinct sites of endocardial pacing with known coordinates. From each pacing site, a mean of 28 ± 8 ECG beats are available.
Patient-specific heart-torso geometry models are also available for each patient, from which the simulated 12-lead ECG is generated as described in section II-A. On average, 1637 35 ECG data are simulated for each patient, corresponding to origins of ventricular activation evenly distributed throughout the 3D myocardium at a resolution of 4.9 ± 0.8 mm.
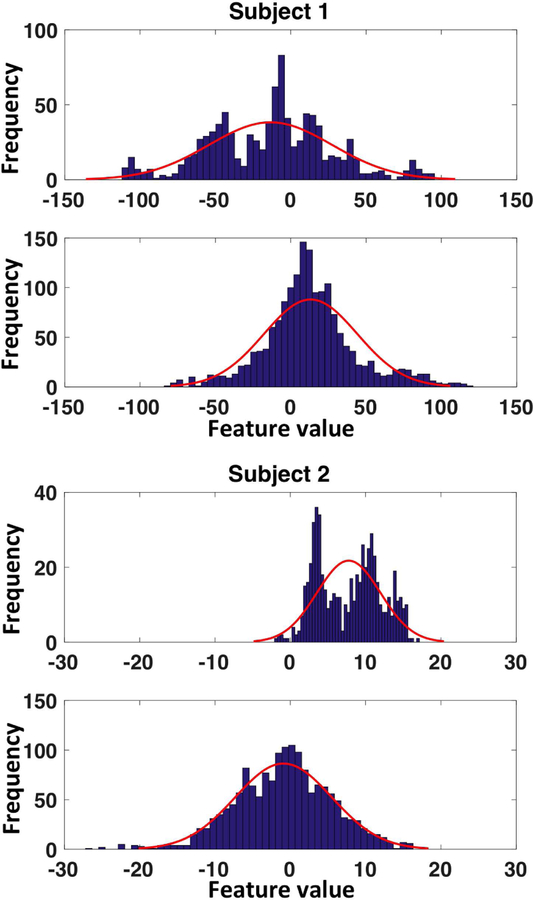
QRS integrals are extracted from each beat of the clinical ECG data and simulated ECG data. To capture the morphology of the QRS complex, we define features in the form of incremental integrals at 10-ms intervals until reaching a maximum of 120-ms. This results in a 12-dimensional feature vector on each ECG lead and, across 12 leads, a 144-dimensional feature vector. Fig.3 provides two representative examples of histograms of the extracted ECG features in simulated versus clinical data: Even though the amount of clinical data is limited, the shift in data distribution between the two domains is visible, underscoring the need for domain adaptation techniques.
Fig. 3.
Representative examples of histograms of features extracted from simulated versus clinical ECG data showing the discrepancy of distribution between the two datasets.
For classification, the origin of ventricular activation is assigned a label as one of the 26 segments, with 17 segments on the left ventricle following the American Heart Association standard [21] and 9 segments on the right ventricle as shown in Fig 4 following [22]. For regression, the 3D coordinates of the origin of ventricular activation are used.
Fig. 4.
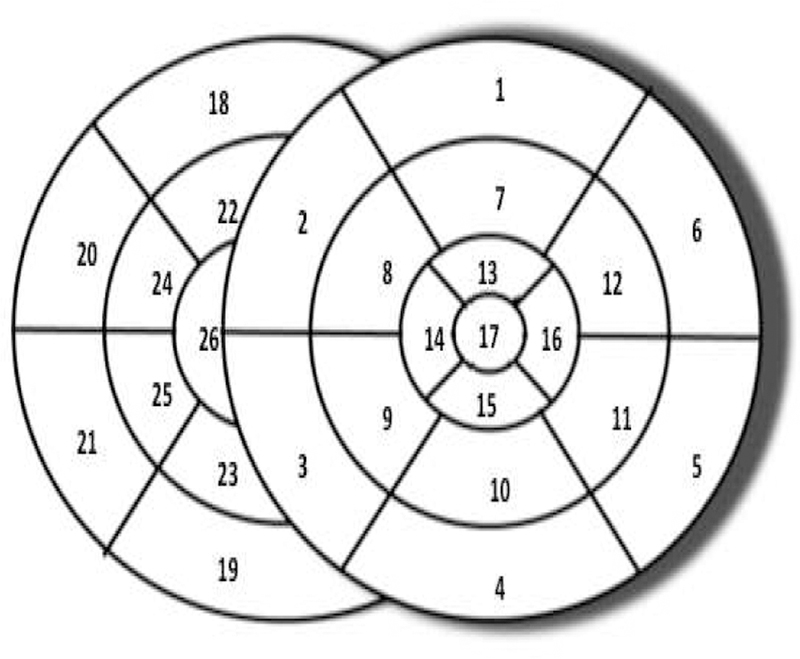
Schematics of the pre-defined 26-segment model.
B. Classification Results
In the classification setting, the presented model (referred to as MMDT with error modeling) is compared with three alternative patient-specific modeling approaches: a standard SVM trained on clinical data only, a standard SVM trained on combined simulation and clinical data without considering domain adaptation, and an SVM trained with the standard MMDT method for domain adaptation but without considering simulation errors. All four models are trained and tested using the same software package [23]. For the standard SVMs in the first two models, the parameter C for hinge losses is tuned using 5-fold cross-validation. Parameter C from the second model, tuned on simulation data, is then used as CT for the two MMDT-based models with CS set to be 0.05.
Intuitively, when a good number of clinical ECG data exist for training, a high accuracy can be expected from models based on clinical data. However, as the number of clinical data used for training decreases, this accuracy will decrease. Therefore, we repeat the comparison study as the number of clinical data for training decreases from 25 to 4 for subject 1, and from 15 to 4 for subject 2 and subject 3. In each experiment, the model is trained on a randomly selected set of the specified size, while another randomly selected set of approximately 15% subject-specific data is held out for testing. This process repeats 20 times for each specified training data set size to obtain a measure of mean accuracy with the associated variance.
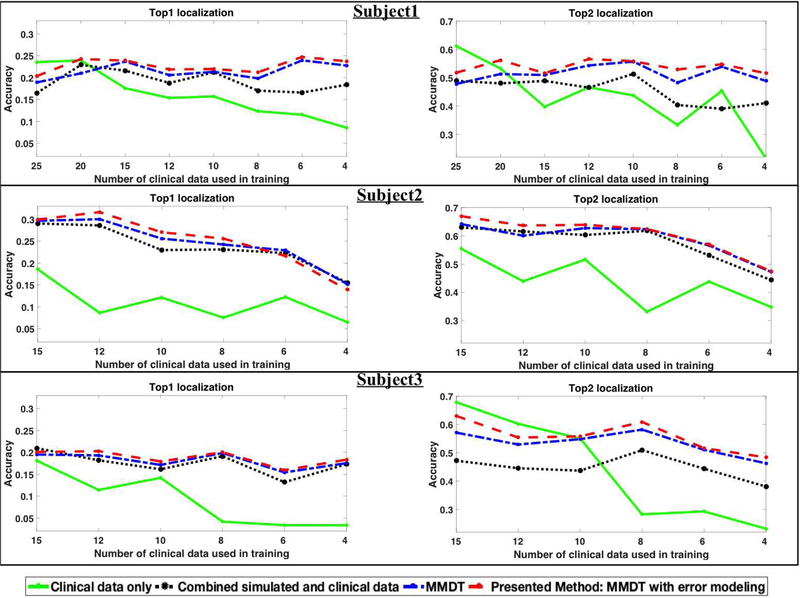
For each given model, the percentage of time that the prediction of the origin of ventricular activation is correct (i.e., that the origin is localized into the correct segment) is reported as the top-one hit. We have observed that, when the prediction of the origin of ventricular activation is incorrect, the predicted segment tends to lie immediately adjacent to the actual (correct) segment. Thus, we also report the percentage of time that the origin of ventricular activation is localized into the correct segment or into the segment immediately adjacent to the correct segment (top-two hit). Fig. 5 shows the mean localization accuracy of each model for the three subjects.
Fig. 5.
Comparison of classification results (top-one, top-two hits) among alternative models on each of the three subjects.
As shown, a model trained exclusively on clinical data has a reasonable accuracy when the number of training data is not too low (solid green line). However, this accuracy quickly drops as the number of clinical data decreases. By incorporating simulation data without considering the domain shift between simulation and clinical data (black dotted line), the classification accuracy shows a general improvement. However, the amount of improvement varies from subject to subject, which might be related to varying levels of agreement between simulation and clinical data. Note that the amount of improvement is significant when the number of clinical data is small. With modeling approaches that include domain adaptation (blue dotted line) and domain adaptation that accounts for the non-uniform simulation errors (the presented method; red dotted line), we see further improvements in accuracy. The presented method, in general, achieves the highest accuracy except in occasional cases. The improvement margins that these two methods yield, however, again vary from case to case.
C. Regression Results
In the regression setting, similarly, the presented method is compared with the following three models: a standard KNN using clinical ECG data only, a standard KNN using simulation data only, and a KNN based on the optimal distance metric learned between simulated and clinical domain using equation (5) but without removing data with low simulation quality from the similarity constraint. For all KNNs, no kernels are used and the number of neighbors is set empirically to be , where n is the number of samples in the training set.
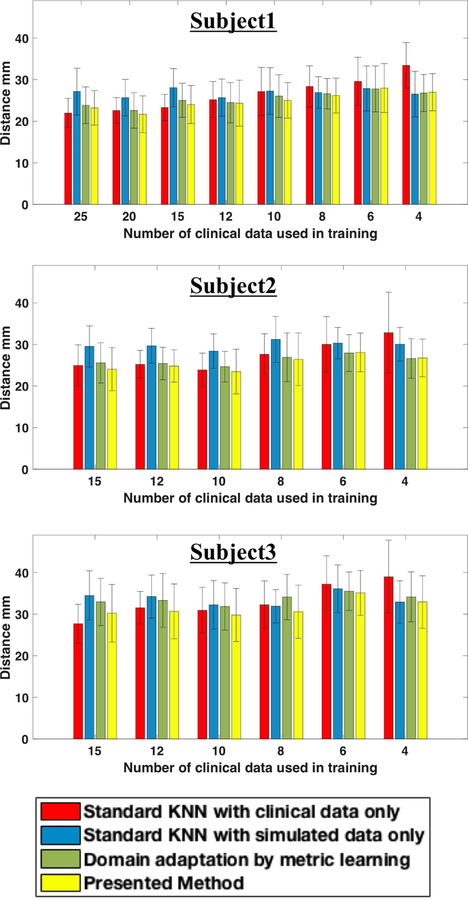
The comparison study is carried out in a similar setting to that described in section IV-B, repeated as the number of clinical data used in training decreases and repeated for random splitting of training and test data in each case. The regression accuracy is reported in terms of the Euclidean distance between the predicted and actual origin of activation. Fig. 6 shows the mean prediction error as a function of the number of clinical data used in training for each of the three subjects.
Fig. 6.
Comparison of regression results (mean and standard deviation) among alternative models on each subject.
Similar to the observation in the classification setting, when only clinical data are available for training (red bar), the mean prediction error increases substantially as the number of clinical data decreases. The incorporation of simulation data results in a moderate reduction in the prediction error when the number of clinical data is small (blue bar). However, when the number of training clinical data is not low, the prediction error is significantly higher. This demonstrates that the difference between simulated and clinical data may have a more significant effect on regression than on classification. Introducing domain adaptation results in a further reduction in prediction error in most of the cases (green bar), although the error is still higher or similar to that obtained by using clinical data only. This indicates that domain adaptation is able to address the shift between simulation and clinical data, but only to a limited extent.
By considering nonuniform simulation error during domain adaptation, the presented method (yellow bar) further reduces the prediction error, to the extent that it yields the lowest prediction error in all but three cases. Considering the rather limited performance of the other three models, this significant improvement highlights the importance of considering the discrepancy between simulated and clinical data in a regression setting.
Similar to the observation in the classification setting, the performance improvement of the presented method is not as good when the number of clinical data for training is low. This again may be attributed to the difficulty in obtaining a good estimate of the simulation error when the number of clinical data is limited.
D. Emulation of Clinical Procedures
Next, we utilize the available pace-mapping data on each patient to retrospectively emulate how the proposed scheme of progressive prediction would guide a pace-mapping procedure. For each subject and each target site for testing, as the model makes a prediction, from all available pace-mapping sites we identify the one nearest to the predicted location. Clinical ECG data from the selected site are added to the training data and the model will be re-trained. This process repeats until reaching the following criterion: the correlation coefficient between the newly-collected ECG and the target ECG is ≥ 0.9 (successful termination), or no available pace-mapping site lies within 15-mm of the predicted site (premature termination).
We carried out the emulation on a total of 75 clinical pacing sites available from all three subjects. Successful completion of an emulation largely depends on whether retrospective pace-mapping data are available within a 15-mm distance from a predicted site. As a results, only 43 cases continued beyond the first prediction and many cases were terminated prematurely. Fig. 7 illustrates the mean reduction in prediction error with each added pacing site, along with the number of cases that are not yet terminated at that step. Generally, the mean reduction in prediction error with each added pacing site is ≥ 2-mm. Considering two cases that are successfully terminated and those that have continued beyond four steps, the presented model has an initial localization error of 31.9± 12.4 mm that is reduced to 18.5± 8.8 mm within 3.2± 1.4 steps. Fig. 8 shows two examples where a final localization error of 7.6-mm and 10-mm are achieved using 3 and 5 pacing sites, respectively, after the initial prediction.
Fig. 7.

Results of retrospective emulation of the presented scheme of progressive prediction. This schematic shows the mean reduction in prediction error with each added clinical data point, along with the number of cases (N) tested in each step.
Fig. 8.
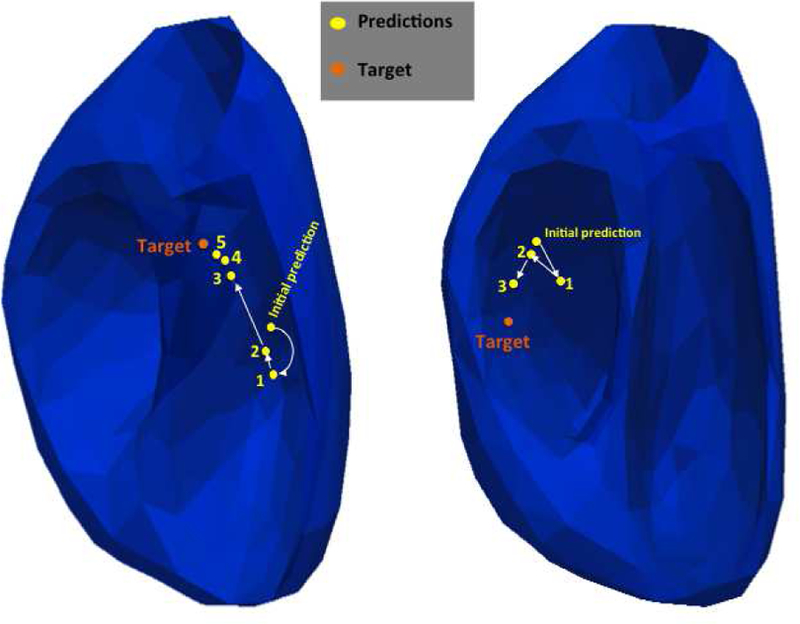
Two examples emulating how the presented scheme of progressive prediction would guide pace-mapping. Orange dots mark the targets, and yellow dots mark the models predictions in the annotated order.
E. Localization of Pacing Sites: Comparison of Data-Driven Approach to Physics-based Electrocardiographic Imaging Approach
A physics-based approach is an alternative to a data-driven approach in the localization of the origin of ventricular activation. Known as electrocardiographic imaging (ECGI), this type of approach is built on the construction of a forward biophysical model between cardiac electrical sources and body-surface ECG data, on which the inverse solution of cardiac source activity can be obtained. Many existing ECGI approaches have been evaluated on their ability to localize the origin of ventricular activation, in application contexts such as pacing sites [11], [24], PVC [25], [26], and scar-related VT [24], [27]. In [11], an ECGI method based on spline parameterization and transmural regularization was applied to localize the origin of ventricular activation on the same dataset used in this paper.
Here, we present a detailed case-by-case comparison of the localization accuracy obtained by the ECGI method and the presented method. The ECGI solution was obtained from each beat of 120-lead ECG data for each pacing site. The presented method is tested on 12-lead ECG data. Specifically, for each unique pacing site to be localized, we consider 20 trials, each with ten randomly selected clinical ECG data points as the training data to adapt the simulated data. ECG data from the same pacing site as the test case are excluded from the training data. These 20 trials are repeated for each ECG beat from the same pacing site.
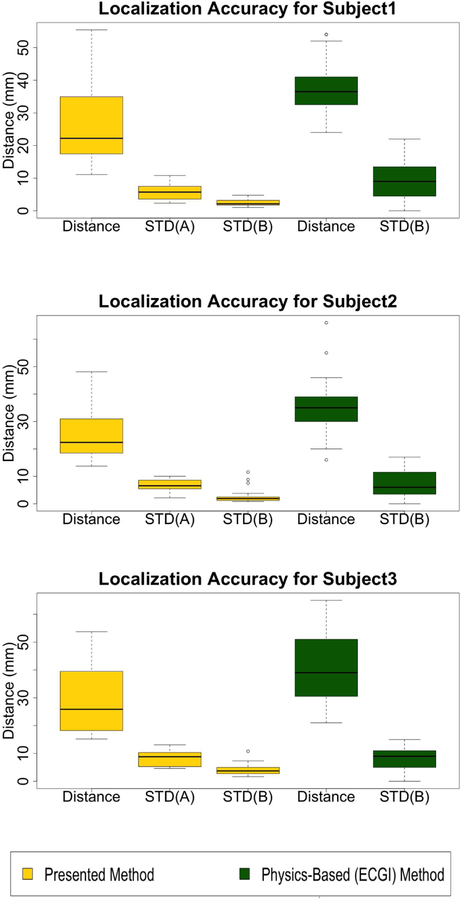
The results are summarized in the box plots shown in Figs. 9. For ECGI solutions, the localization accuracy is reported as the Euclidean distance between the true pacing site and the earliest site of activation determined from the ECGI-reconstructed activation pattern. The mean and standard deviation are calculated from the solutions from all ECG beats from the same pacing site. For the presented method, the mean localization accuracy for each pacing site is calculated from the Euclidean distance between the actual and predicted pacing sites from 20 random trials on all beats of ECG data.
Fig. 9.
Comparison of localization accuracy between the presented method and the ECGI method in [11] (Subject 1, 2 and 3 respectively). STD(A): standard deviation of localization accuracy associated with different ECG beats when the same training data are used (i.e., the same trial), averaged across all 20 trials. STD(B): standard deviation of localization accuracy associated with the use of different training data (all 20 trials) for each beat, averaged across all ECG beats from the same pacing site.
Compared with the ECGI method, the presented method provides a smaller localization error in 85%, 80%, and 73% of the pacing sites in Subjects 1, 2, and 3, respectively. The mean localization errors with the presented method are significantly lower than with the ECGI approach (p < 0.01 for each subject, paired student-t test). In addition, while a large beat-to-beat variation in the localization accuracy was noted in [11], the beat-to-beat variations obtained by the presented method are significantly smaller than those obtained with the ECGI method (STD(B), p < 0.01, paired student-t test).
V. Discussion
A. Segment Resolution and Prediction Accuracy
The accuracy in localizing the origin of ventricular activation to a predefined anatomical segment can be affected by the total number of segments being used. The results presented in section IV-B are obtained on a 26-segment model with an approximately 4 cm2 resolution, which is higher than that used in most existing work that uses a range of 10–16 segments [3]. This may explain the relatively low classification accuracy as reported in Fig. 5. Fig. 10 shows the change in classification accuracy if 14 rather than 24 ventricular segments are used for Subject 1. As expected, the overall accuracy is substantially higher, and the top-two hit reaches 0.80 when domain adaptation is considered. Further decreasing the resolution may further improve the classification accuracy, but an optimal definition of anatomical segments should rely on the clinical question of interest.
Fig. 10.
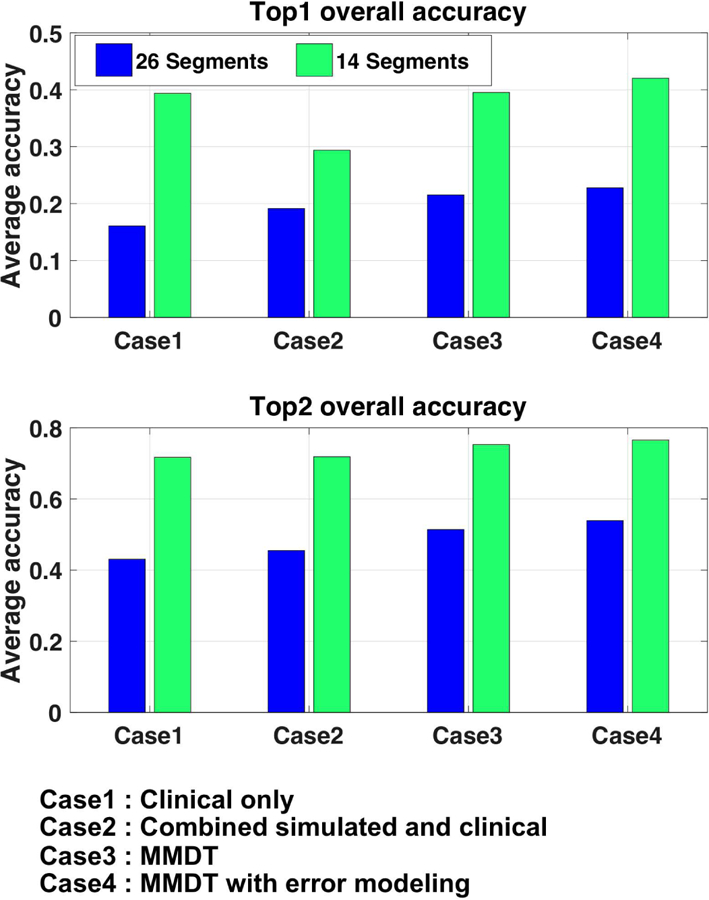
Comparison of classification accuracy when 14 versus 26 segments are used for localizing the activation origin.
B. Data-driven versus Physics-based Methods
On a technical level, the presented data-driven models and physics-based ECGI approaches are drastically different. On a conceptual level, they can be considered as inverse approaches to inferring the origin of ventricular activation from ECG data. For ECGI approaches, the inversion is based on a biophysical forward model. For data-driven approaches, the inversion is learned from data. On the presented dataset, the data-driven approach appears to yield a significantly smaller localization error using 12-lead ECG data, compared with the ECGI method using 120-lead ECG data. This may be rationalized from the following two standpoints:
First, the presented data-driven approach utilizes the QRS morphology of the 12-lead ECG to extract a small number of unknowns specific to the task at hand: the 3D coordinate of the origin of ventricular activation. In comparison, the unknown in the ECGI approach presented in [11] is in the form of the spatiotemporal potential signals throughout the epicardial and endocardial surface - a general-purpose solution from which different information can be extracted, including the origin of ventricular activation. Therefore, the improvement in performance by the data-driven models on this specific task comes at the expense of generalizability. This may also suggest that, if accuracy is favored over generalizability in certain clinical applications, future ECGI approaches may consider customizing the formulation of their solutions to a smaller number of unknowns specific to the clinical questions at hand.
Second, the accuracy of the inverse solution be it obtained using a data-driven or physics-based approach is highly affected by the choice of model between the unknown in the heart and body-surface ECG. In ECGI approaches, the accuracy of the biophysical forward model is affected by many modeling assumptions and simplifications. For example, the effect of respiration may contribute to the large beat-to-beat variations in the localization accuracy observed in [11]. In addition, the thorax models of the three subjects can be associated with errors in geometry due to limited chest scans [11] as well as errors in conductivity values due to adoption of literature values and limited incorporation of anisotropy. These factors may further decrease the accuracy of ECGI solutions. While the presented data-driven model is learned from the same simulation setup, it is further adapted to available clinical data. This process of adaptation may play the role of correcting the error in a biophysical model that is not accommodated by most ECGI approaches.
C. Effect of Extremity Leads on the Similarity Map
As described in section II-B, all 12 leads of ECG data were included in the calculation of the similarity score between the simulated and clinical data. Because extremity leads are located farther away from the heart, it is possible that extremity leads are less affected by the origin of ventricular activation and, therefore, play an insignificant role in quantifying how the similarity between simulated and clinical ECG data varies with the origin of ventricular activation. To investigate the effect of incorporating these extremity leads into the calculation of the similarity score, we removed them from the calculation of the similarity score as described in section II-B, and repeated the experiments in section IV-B. Fig 11 shows the exact segment localization on Subject 1 and Subject 2, when excluding extremity leads from the calculation of similarity scores (green dotted line), compared with the original results (red dotted line). The predictions appear to be comparable in each case. This suggests that extremity leads have a negligible effect when evaluating how similarity between simulated and clinical data may change with the origin of ventricular activation. Further, it suggests that extremity leads may be left out of the calculation of similarity scores in future studies.
Fig. 11.
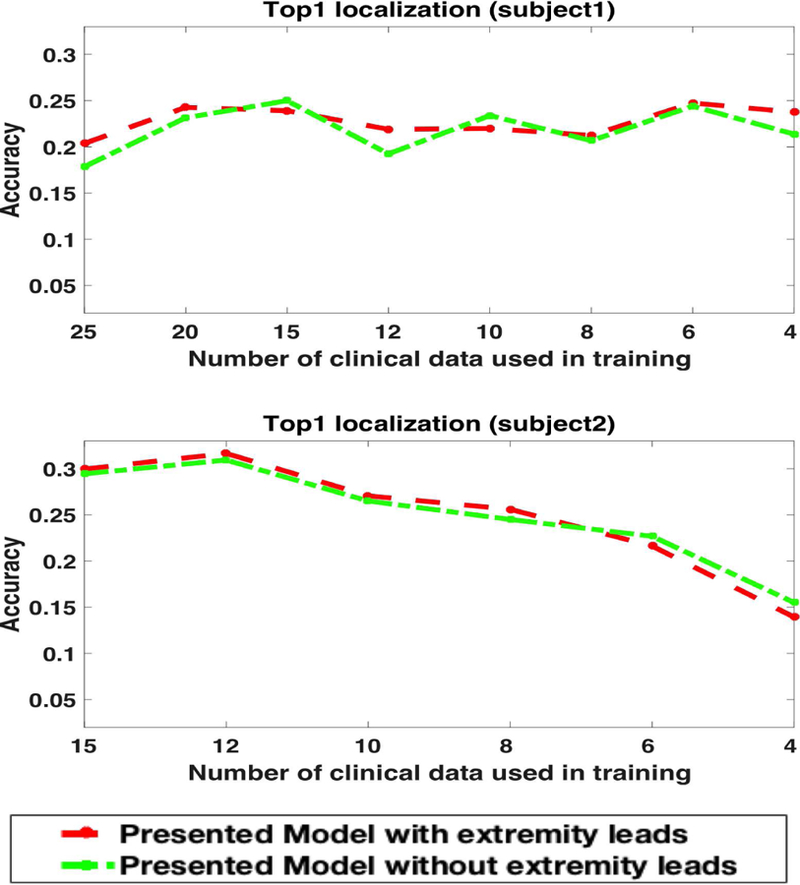
The effect of keeping or removing extremity leads from the calculation of similarity scores on exact segment prediction for subject 1 and subject 2.
D. The Feasibility and Limit of Domain Adaptation
This paper provides a proof of concept that transferring knowledge from simulation data to clinical data can address the challenge of scarce clinical data in certain applications. The main focus and innovation is the finding that by learning the shift between the simulation and clinical data, we can better utilize the simulation data in the presence of simulation errors. In general, different levels of shifts exist between simulation and clinical data. At one end of the spectrum, where minimal shift exists, there are high-fidelity patient-specific models that are fully personalized to a patient, including not only in geometry but in electrophysiological properties. This, however, is often not possible and is not the focus of this paper.
We moved farther down the spectrum and considered a setting where simulation data were generated on a patient-specific geometrical model, but without further personalization on electrophysiological parameters. In addition, instead of a cellular biophysical model for electrophysiological simulation, we chose a simplified but well-accepted two-variable macroscopic model [15]. Similarly, for the propagation to the torso surface, we also made simplified assumptions on the thorax geometry and assumed conductivity homogeneity, even though it has been reported that the latter may affect both the amplitude [14] and morphology [28] of the simulated ECG. We consider this a good initial test ground for the presented concept, and the experimental results demonstrated its feasibility in this setting. Even though our method requires training data generated from each subject, we consider this a practical setup in applications because it involves only standard image-based modeling of the heart and torso, as well as simulation models that are computationally efficient without needing to be perfectly customized to a subject.
If we move farther to the other end of the spectrum, we make two primary hypotheses. First, as the simulation data and clinical data diverge, we hypothesize that the role of domain adaptation may become more important. Second, we hypothesize that there will be a limit to which the presented method will be able to adapt the shift between the two types of data. To test this, we intentionally degraded the quality of the simulation data and increased its shift from the clinical data. Specifically, instead of a patient-specific simulation, we trained our models on the simulation data from a different subject. Fig. 12 shows the results of the presented classification method when the model was trained on simulation data from Subject 2 or Subject 3 but adapted to clinical data from Subject 1. In comparison with using simulation data without the proposed domain adaptation, the presented method achieved an improvement in accuracy by 0.041 ± 0.023 with a mean relative improvement of 0.322 ± 0.21. This margin is higher than that obtained in section III-B (0.035 ± 0.024 with an average relative improvement of 0.201 ± 0.15) when patient-specific simulation data were used for adaptation. The overall accuracy, as expected, was lower than with the use of patient-specific simulation.
Fig. 12.
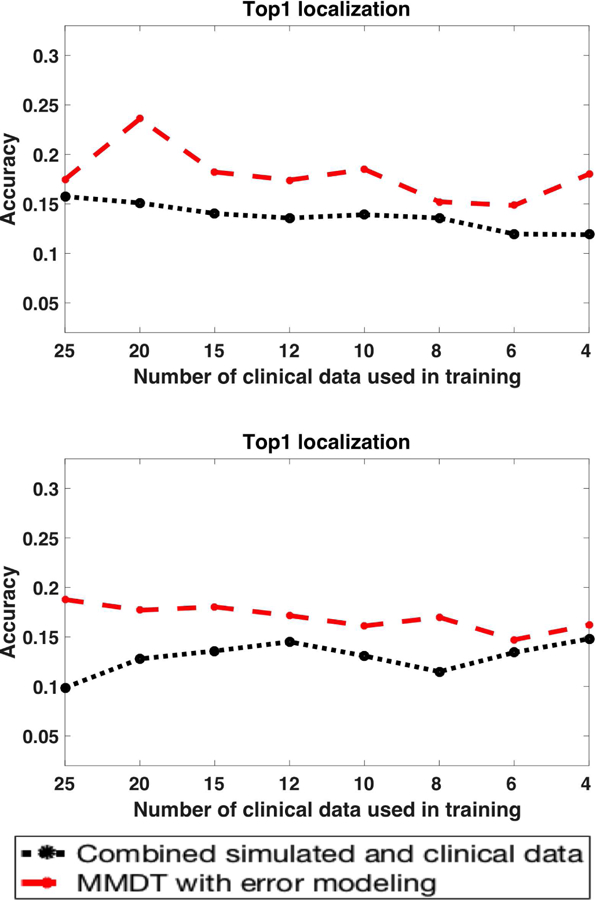
Improvement in accuracy achieved by the presented domain adaptation methods when simulation data from Subject 2 or Subject 3 are adapted to clinical data from Subject 1.
This confirms our hypotheses that domain adaptation plays an increasingly important role as the simulation data degrades, but there is a limit to how much it can adapt. This suggests that – for reliable clinical use – it may be most advantageous to combine the presented domain adaptation method with high-fidelity patient-specific simulation data. While simulation data of low fidelity is used to augment clinical data, more advanced domain adaptation techniques may be needed in order to prevent most of the simulation data from being filtered out by the adaptation process. Furthermore, if it is desired to train the model using generic or population simulation data, significant challenges need to be resolved to adapt not only the domain shift between simulation and clinical data, but also the shift among individuals [29].
E. Practical Considerations and Other Limitations
1). Customization to Predictions on Specific Ventricular Surfaces:
In the experiments that emulated how the presented method would guide pace-mapping, the prediction of the origin of ventricular activation considers the 3D myocardium of both ventricles. In clinical practice, because only one cardiac surface (left endocardium, right endocardium, or epicardium) can be accessed at a time, it may be more desirable to restrict the prediction within the surface being accessed. This can be done by including only simulated ECG data originating from the specific surface of interest for training. In this case, because the search space is reduced in size, the localization accuracy may be further improved.
2). Relationship to Recent Work in the Literature:
In [30], patient-specific simulation data are used to predict excitation sites from ECG data using kernel ridge regression, which is then used to achieve personalization of a cardiac model from clinical surface ECG data. In [31], offline simulation data on a reference thorax anatomy is used to learn to regress myocardial activation times from body-surface ECG data, which is then transferred to patient-specific anatomies to achieve fast, personalized prediction online. Both studies share a similar motivation to the present work in transfering knowledge learned from simulation data to clinical ECG data, albeit in a different application context that considers the personalization of a computer model. In [29], a population-based prediction model is built for localizing the origin of ventricular activation from ECG data. To address the challenge of inter-subject variations, novel deep learning models are developed to disentangle the individual-level variations from ECG data. The presented approach of domain adaptation may provide an alternative to transfer the knowledge from population data to a small number of subject-specific data.
3). Other Limitations:
The presented work is based upon the long hypothesized relationship between an origin of ventricular activation and the QRS morphology on 12-lead ECG [2]. Therefore, it is intended for rhythms arising from a single onset, such as in monomorphic VT. When a rhythm is known to arise from multiple sites of ventricular onset, the presented method does not apply.
As a proof of concept, we have considered the classic methods of SVM and KNN in this paper. A next step is to realize the presented concept using more sophisticated machine learning models.
Finally, though promising results are obtained, the presented methods was evaluated on a small series of three patients with a moderate number of clinical pacing sites available that needed to be split between training and testing data. This prevented a quantitative evaluation of the similarity map built in section II, and limited the statistical significance of the results. In addition, the dataset used in this paper included pre-extracted heart-torso surface meshes and pre-registered clinical pacing sites to these meshes, excluding the evaluation of image-based subject-specific anatomical modeling and registration of imaging and pace-mapping data in the presented pipeline. Future evaluations are warranted on a large number of patients with raw tomographic scans and clinical pace-mapping data.
VI. Conclusion
To address the problem of the scarcity of clinical data in building a patient-specific model to predict the origin of ventricular activation from 12-lead ECG data, we introduced a novel concept to transfer the knowledge from simulation data to a small amount of clinical data while addressing the shift between the two domains. We demonstrated the feasibility of this concept and its potential to guide pace-mapping procedures by progressively improving the prediction of the origin of ventricular activation with each added clinical data point. Our future work will focus on integration with high-fidelity simulation models, development of more advanced machine learning models, and expansion beyond the patient-specific setting.
Acknowledgment
The authors would like to thank Dr. Dana Brooks and Jaume Coll-Font for sharing and troubleshooting their code to reproduce the ECGI results reported in their previous work [11]. This work is supported by the National Science Foundation under CAREER Award ACI-1350374 and the National Institute of Heart, Lung, and Blood of the National Institutes of Health under Award R15HL140500.
Contributor Information
Mohammed Alawad, King Abdullah International Medical Research Center, Riyadh, Saudi Arabia; B. Thomas Golisano College of Computing and Information Sciences, Rochester Institute of Technology, Rochester, NY 14623 USA.
Linwei Wang, B. Thomas Golisano College of Computing and Information Sciences, Rochester Institute of Technology, Rochester, NY 14623 USA.
References
- [1].Stevenson WG, “Current treatment of ventricular arrhythmias: state of the art,” Heart Rhythm, vol. 10, no. 12, pp. 1919–1926, 2013. [DOI] [PubMed] [Google Scholar]
- [2].Park KM, Kim YH, and Marchlinski FE, “Using the surface electrocardiogram to localize the origin of idiopathic ventricular tachycardia,” Pacing and Clinical Electrophysiology, vol. 35, no. 12, pp. 1516–1527, 2012. [DOI] [PubMed] [Google Scholar]
- [3].Yokokawa M, Liu TY, Yoshida K, Scott C, Hero A, Good E, Morady F, and Bogun F, “Automated analysis of the 12-lead electrocardiogram to identify the exit site of postinfarction ventricular tachycardia,” Heart Rhythm, vol. 9, no. 3, pp. 330–334, 2012. [Online]. Available: 10.1016/j.hrthm.2011.10.014 [DOI] [PubMed] [Google Scholar]
- [4].Sapp JL, Bar-Tal M, Howes AJ, Toma JE, El-Damaty A, Warren JW, MacInnis PJ, Zhou S, and Horáček BM, “Real-time localization of ventricular tachycardia origin from the 12-lead electrocardiogram,” JACC: Clinical Electrophysiology, vol. 3, no. 7, pp. 687–699, 2017. [DOI] [PubMed] [Google Scholar]
- [5].Potse M, Linnenbank AC, Peeters HAP, SippensGroenewegen A, and Crimbergen CA, “Continuous localization of cardiac activation sites using a database of multichannel ECG recordings,” IEEE transactions on biomedical engineering, vol. 47, no. 5, pp. 682–689, 2000. [DOI] [PubMed] [Google Scholar]
- [6].Hren R and Horacek MB, “Value of simulated body surface potential maps as templates in localizing sites of ectopic activation for radiofrequency ablation.” Physiological measurement, vol. 18, no. 4, pp. 373–400, 1997. [Online]. Available: http://www.ncbi.nlm.nih.gov/pubmed/9413870 [DOI] [PubMed] [Google Scholar]
- [7].Patel VM, Gopalan R, Li R, and Chellappa R, “Visual Domain Adaptation,” IEEE Signal Processing Magazine, vol. 32, no. 3, pp. 53–69, 2015. [Google Scholar]
- [8].Saenko K, Kulis B, Fritz M, and Darrell T, “Adapting Visual Cateogry Models to New Domains,” European Conference on Computer Vision, pp. 213–226, 2010.
- [9].Hoffman J, Rodner E, Donahue J, Darrell T, and Saenko K, “Efficient Learning of Domain-invariant Image Representations,” International Conference on Learning Representations, pp. 1–9, 2013. [Online]. Available: http://arxiv.org/abs/1301.3224 [Google Scholar]
- [10].Aras K, Good W, Tate J, Burton B, Brooks D, Coll-Font J, Doessel O, Schulze W, Potyagaylo D, Wang L, and Others, “Experimental Data and Geometric Analysis Repository?EDGAR,” Journal of electrocardiology, vol. 48, no. 6, pp. 975–981, 2015. [DOI] [PMC free article] [PubMed] [Google Scholar]
- [11].Erem B, Coll-Font J, Orellana RM, St’Ovicek P, and Brooks DH, “Using transmural regularization and dynamic modeling for noninvasive cardiac potential imaging of endocardial pacing with imprecise thoracic geometry,” IEEE transactions on medical imaging, vol. 33, no. 3, pp. 726–738, 2014. [DOI] [PMC free article] [PubMed] [Google Scholar]
- [12].Nash M, “Mechanics and material properties of the heart using an anatomically accurate mathematical model,” Ph.D. dissertation, ResearchSpace@ Auckland, 1998. [Google Scholar]
- [13].Nielsen PM, Le Grice IJ, Smaill BH, and Hunter PJ, “Mathematical model of geometry and fibrous structure of the heart,” American Journal of Physiology-Heart and Circulatory Physiology, vol. 260, no. 4, pp. H1365–H1378, 1991. [DOI] [PubMed] [Google Scholar]
- [14].Bradley CP, Pullan AJ, and Hunter PJ, “Effects of material properties and geometry on electrocardiographic forward simulations,” Annals of biomedical engineering, vol. 28, no. 7, pp. 721–741, 2000. [DOI] [PubMed] [Google Scholar]
- [15].Aliev RR and Panfilov AV, “A simple two-variable model of cardiac excitation,” Chaos, Solitons & Fractals, vol. 7, no. 3, pp. 293–301, 1996. [Google Scholar]
- [16].Wang L, Zhang H, Wong KCL, Liu H, and Shi P, “Physiological-model-constrained noninvasive reconstruction of volumetric myocardial transmembrane potentials,” IEEE Transactions on Biomedical Engineering, vol. 57, no. 2, pp. 296–315, 2010. [DOI] [PubMed] [Google Scholar]
- [17].De Chillou C, Groben L, Magnin-Poull I, Andronache M, Abbas MM, Zhang N, Abdelaal A, Ammar S, Sellal J-M, Schwartz J, and Others, “Localizing the critical isthmus of postinfarct ventricular tachycardia: the value of pace-mapping during sinus rhythm,” Heart Rhythm, vol. 11, no. 2, pp. 175–181, 2014. [DOI] [PubMed] [Google Scholar]
- [18].Drucker H, Burges CJC, Kaufman L, Smola AJ, and Vapnik V, “Support vector regression machines,” in Advances in neural information processing systems, 1997, pp. 155–161.
- [19].Cortes C and Mohri M, Domain Adaptation in Regression Berlin, Heidelberg: Springer Berlin Heidelberg, 2011, pp. 308–323. [Online]. Available: 10.1007/978-3-642-24412-4{\_}25 [DOI] [Google Scholar]
- [20].Davis JV, Kulis B, Jain P, Sra S, and Dhillon IS, “Information-theoretic metric learning,” in Proceedings of the 24th international conference on Machine learning. ACM, 2007, pp. 209–216. [Google Scholar]
- [21].Cerqueira MD, Weissman NJ, Dilsizian V, Jacobs AK, Kaul S, Laskey WK, Pennell DJ, Rumberger JA, Ryan T, Verani MS, and Others, “Standardized myocardial segmentation and nomenclature for tomographic imaging of the heart,” Circulation, vol. 105, no. 4, pp. 539–542, 2002. [DOI] [PubMed] [Google Scholar]
- [22].Relan J, Sermesant M, Pop M, Delingette H, Sorine M, Wright G, and Ayache N, “Volumetric prediction of cardiac electrophysiology using a heart model personalised to surface data,” in CI2BM09-MICCAI Workshop on Cardiovascular Interventional Imaging and Biophysical Modelling, 2009, pp. 9—-pages.
- [23].Chang C-C and Lin C-J, “{LIBSVM}: A library for support vector machines,” ACM Transactions on Intelligent Systems and Technology, vol. 2, no. 3, pp. 27:1–27:27, 2011. [Google Scholar]
- [24].Sapp JL, Dawoud F, Clements JC, and Horáček BM, “Inverse solution mapping of epicardial potentials: quantitative comparison to epicardial contact mapping,” Circulation: Arrhythmia and Electrophysiology, pp. CIRCEP–111, 2012. [DOI] [PubMed]
- [25].Lai D, Sun J, Li Y, and He B, “Usefulness of ventricular endocardial electric reconstruction from body surface potential maps to noninvasively localize ventricular ectopic activity in patients,” Physics in medicine and biology, vol. 58, no. 11, p. 3897, 2013. [DOI] [PMC free article] [PubMed] [Google Scholar]
- [26].van Dam PM, Tung R, Shivkumar K, and Laks M, “Quantitative localization of premature ventricular contractions using myocardial activation ECGI from the standard 12-lead electrocardiogram,” Journal of electrocardiology, vol. 46, no. 6, pp. 574–579, 2013. [DOI] [PubMed] [Google Scholar]
- [27].Wang L, Gharbia OA, Horáček BM, and Sapp JL, “Noninvasive epicardial and endocardial electrocardiographic imaging of scar-related ventricular tachycardia,” Journal of electrocardiology, vol. 49, no. 6, pp. 887–893, 2016. [DOI] [PMC free article] [PubMed] [Google Scholar]
- [28].Van Oosterom A and Huiskamp GJ, “The effect of torso inhomogeneities on body surface potentials quantified using tailored geometry,” Journal of electrocardiology, vol. 22, no. 1, pp. 53–72, 1989. [DOI] [PubMed] [Google Scholar]
- [29].Gyawali Prashnna, Horacek Milan, Sapp John and Wang L, “Learning Disentangled Representation from 12-lead Electrocardiograms: Application in Localizing the Origin of Ventricular Tachycardia,” 2017.
- [30].Giffard-Roisin S, Jackson T, Fovargue L, Lee J, Delingette H, Razavi R, Ayache N, and Sermesant M, “Noninvasive Personalization of a Cardiac Electrophysiology Model From Body Surface Potential Mapping,” IEEE Transactions on Biomedical Engineering, vol. 64, no. 9, pp. 2206–2218, 2017. [DOI] [PubMed] [Google Scholar]
- [31].Giffard-Roisin S, Delingette H, Jackson T, Webb J, Fovargue L, Lee J, Rinaldi CA, Razavi R, Ayache N, and Sermesant M, “Transfer Learning from Simulations on a Reference Anatomy for ECGI in Personalised Cardiac Resynchronization Therapy,” IEEE Transactions on Biomedical Engineering, 2018. [DOI] [PubMed]


