

Abstract
Epilepsy is a chronic disorder characterized by spontaneous recurrent seizures. Brain inflammation is increasingly recognized as a critical factor for seizure precipitation, but the molecular mediators of such proconvulsant effects are only partly understood. The chemokine CCL2 is one of the most elevated inflammatory mediators in patients with pharmacoresistent epilepsy, but its contribution to seizure generation remains unexplored. Here, we show, for the first time, a crucial role for CCL2 and its receptor CCR2 in seizure control. We imposed a systemic inflammatory challenge via lipopolysaccharide (LPS) administration in mice with mesial temporal lobe epilepsy. We found that LPS dramatically increased seizure frequency and upregulated the expression of many inflammatory proteins, including CCL2. To test the proconvulsant role of CCL2, we administered systemically either a CCL2 transcription inhibitor (bindarit) or a selective antagonist of the CCR2 receptor (RS102895). We found that interference with CCL2 signaling potently suppressed LPS-induced seizures. Intracerebral administration of anti-CCL2 antibodies also abrogated LPS-mediated seizure enhancement in chronically epileptic animals. Our results reveal that CCL2 is a key mediator in the molecular pathways that link peripheral inflammation with neuronal hyperexcitability.
SIGNIFICANCE STATEMENT Substantial evidence points to a role for inflammation in epilepsy, but currently there is little insight as to how inflammatory pathways impact on seizure generation. Here, we examine the molecular mediators linking peripheral inflammation with seizure susceptibility in mice with mesial temporal lobe epilepsy. We show that a systemic inflammatory challenge via lipopolysaccharide administration potently enhances seizure frequency and upregulates the expression of the chemokine CCL2. Remarkably, selective pharmacological interference with CCL2 or its receptor CCR2 suppresses lipopolysaccharide-induced seizure enhancement. Thus, CCL2/CCR2 signaling plays a key role in linking systemic inflammation with seizure susceptibility.
Keywords: systemic inflammation, temporal lobe epilepsy, CCL2, EEG, seizures
Introduction
Inflammatory processes within the brain parenchyma are well-known determinants of seizure propensity (Fabene et al., 2008; Friedman and Dingledine, 2011; Pernot et al., 2011; de Vries et al., 2012; Devinsky et al., 2013; Vezzani et al., 2013). In particular, seizures upregulate inflammatory mediators in animal models, and increased levels of many cytokines/chemokines such as interleukin-1β (IL-1β) and C-C motif ligand 2 (CCL2; also known as monocyte chemoattractant protein-1, MCP-1) can be detected in brain tissue of patients with intractable epilepsy (Aronica and Gorter, 2007; Choi et al., 2009). Importantly, brain inflammatory pathways play a key role in recurrence and precipitation of seizures (Vezzani et al., 2000; Maroso et al., 2010). For example, IL-1β causes potent proconvulsant effects by mediating enhanced calcium influx through NMDA receptors (Vezzani et al., 2013).
Peripheral inflammatory stimuli can also impact on seizure propensity. Clinical and experimental data provide solid evidence for a role of systemic infection in triggering or sustaining seizures (Cross, 2012; Marchi et al., 2014). Specifically, systemic inflammation reduces the threshold for pharmacologically induced acute seizures in animals (Sayyah et al., 2003; Riazi et al., 2008), and this has been linked to upregulation of proinflammatory cytokines (Riazi et al., 2008).
A systemic inflammatory challenge during a critical period in early development leaves a lasting impact on brain excitability and seizure susceptibility later in life (Galic et al., 2008). Peripheral inflammatory stimuli trigger a local brain inflammatory “mirror” reaction (i.e., cytokine and chemokine production) similar to the response elicited in the periphery (Perry and Holmes, 2014). The diseased brain displays an amplified, exaggerated response to a systemic inflammatory challenge, as a result of glial activation and “priming” (Perry and Holmes, 2014).
We have exploited a systemic inflammatory challenge in animals with chronic mesial temporal lobe epilepsy (MTLE) to identify novel molecular pathways involved in seizure regulation. Microarray and ELISA analyses indicated a potential role for the chemokine CCL2 in mediating seizure upregulation following systemic LPS. Accordingly, functional blocking experiments highlighted a crucial role for CCL2 in inflammation-induced seizures.
Materials and Methods
Animals.
Experiments were conducted in accord with the European Community Directive 2010/63/EU and were approved by the Italian Ministry of Health. Animals were housed in a 12 h light/dark cycle with food and water available ad libitum. Adult (8–12 weeks old) C57BL/6N male mice were used in all experiments. All efforts were made to minimize animal suffering.
Kainic acid (KA) injection and placement of electrodes.
Mice were unilaterally injected with 50 nl of a 20 mm solution of KA in PBS into the left dorsal hippocampus under Hypnorm/Hypnovel anesthesia (Antonucci et al., 2008, 2009). Stereotaxic injections into the dorsal blade of the dentate gyrus were made at the following coordinates with respect to bregma: anteroposterior −2.0, mediolateral 1.5, 1.7 mm below dura. Mice were then implanted with a bipolar electrode inserted into the injected hippocampus. The bipolar electrode was formed of two enamel-insulated nichrome wires (120 μm). A ground electrode was placed over the cerebellum. Electrodes were connected to a multipin socket and secured to the skull by acrylic dental cement. In a subset of animals, a guide cannula was glued to the bipolar electrode and positioned on top of dura for anti-CCL2 or control IgG injection.
EEG recordings.
EEG recordings were performed in freely moving mice during the chronic phase of epilepsy. In all animals, recordings began between 15 and 21 d after KA. All mice were recorded for 1 h daily during baseline periods. Mice were then intraperitoneally injected with LPS (L5886, Sigma; from Salmonella enterica, serotype abortus equi; 100 μg/kg in PBS, n = 7) or saline (n = 7). Additional EEG recording sessions (2 h long) were made 2 and 24 h after treatment. For bindarit experiments, after a baseline recording period (4–5 d), bindarit (100 mg/kg in 0.5% methylcellulose [MC]; n = 10 mice) or MC (0.5% in aqueous solution; n = 11 mice) was daily intraperitoneally injected for 4 d. Thirty minutes after the third and the fourth injection, EEG activity was recorded for 30 min. On the fourth day, mice received an intraperitoneal injection of LPS, and EEG recordings were performed between 2 and 4 h after the systemic challenge. The choice of bindarit dose (100 mg/kg) was based on our previous studies, showing that a similar dose was able to reduce CCL2 expression in the brain and suppress neuropathological signs of experimental autoimmune encephalomyelitis in vivo (Ge et al., 2012).
To interfere with signaling via the CCL2 receptor, we injected systemically a selective CCR2 antagonist (RS102895; 5 mg/kg, Tocris Bioscience; n = 7) or vehicle (4% DMSO in saline; n = 7) as control. Injections of RS102895/vehicle were given twice (i.e., immediately after and 1.5 h following LPS delivery in chronically epileptic animals). RS102895 has been previously used as a potent and specific antagonist of CCR2 (Hung et al., 2013; Ren et al., 2015).
In anti-CCL2 experiments, after a baseline recording period (2–3 d), mice were injected with goat anti-CCL2 (1 μl of a 100 μg/ml solution; AF-479-NA, R&D Systems; n = 7) or control goat IgG (AB-108-C, R&D Systems; n = 6) via the implanted microcannula. This blocking antibody has been previously shown to efficiently neutralize the biological activity of CCL2 in vitro and in vivo (e.g., Stamatovic et al., 2006; Fujimoto et al., 2009). One hour after injection, mice received an intraperitoneal LPS injection and EEG recordings were performed between 2 and 4 h after the systemic challenge.
All recordings were performed between 10:00 A.M. and 6:00 P.M., and care was taken to record from each animal at the same time of the day. Signals were amplified (10,000-fold), bandpass filtered (0.3–100 Hz), digitized (National Instruments card), and conveyed to a computer for storage and analysis (Antonucci et al., 2008, 2009; Mainardi et al., 2012). Detection of seizures was performed with custom software written in LabView (National Instruments). The program first identified spikes in the EEG using a voltage threshold. This voltage threshold was set to 4.5 times the SD of the EEG signal (determined in a period devoid of spike activity). Spontaneous recurrent seizures (SRSs) were defined as spike clusters lasting for >4 s, whereas clusters lasting <4 s and isolated spikes were considered as interictal events. For each recording session, we determined the frequency and duration of SRS and interictal clusters, the number of single spikes, and the total time spent in seizures or in interictal activity (calculated by adding together the duration of either ictal or interictal episodes) (Antonucci et al., 2008, 2009; Mainardi et al., 2012; Vannini et al., 2015). For histological controls, naive and chronically epileptic animals were deeply anesthetized and perfused with 4% PFA. Serial coronal sections (40 μm) throughout the dorsal hippocampus were processed for Nissl staining.
Tissue dissections for molecular analyses.
To analyze mRNA expression changes by microarray and qRT-PCR, KA-injected hippocampi were dissected from epileptic mice during the chronic phase, 4 and 24 h after LPS or saline intraperitoneal administration. For CCL2 mRNA in situ hybridization and CCL2/CCR2 immunohistochemistry, brains were dissected from KA-treated epileptic mice during the chronic phase, 4 h after LPS administration. For ELISA experiments, hippocampi were dissected from chronically epileptic and naive animals, 4 h after LPS or saline administration; at the same time, serum was collected by cardiac puncture from each animal. For ELISA experiments, two additional groups of nonepileptic, naive animals received LPS (100 μg/kg in PBS) or saline and tissues were collected 4 h after treatment. In bindarit experiments, epileptic mice received daily intraperitoneal injection of bindarit or MC for 4 d. On the fourth day, 1 h after bindarit or MC administration, mice were challenged with LPS. Hippocampal tissues and blood were collected 4 h after LPS delivery. RS102895 was administered immediately after and 1.5 h following LPS delivery in chronically epileptic animals (see above) and hippocampi were collected 4 h after LPS.
Microarray analysis.
RNAs from dissected hippocampi (n = 4 per experimental group) were purified using standard column purification according to the manufacturer's protocol (RNAeasy Mini Kit, QIAGEN). RNA quality was analyzed by microfluidic gel electrophoresis on RNA 6000 NanoChips using the Agilent 2100 Bioanalyzer. Only RNA with a high (>9) RNA integrity number was selected and used for subsequent retrotranscription, labeling, and array hybridization according to Agilent protocols. Mouse gene expression arrays (Agilent 4 × 44K slides) were hybridized and scanned with the Agilent microarray station. Intensity values were processed with GeneSpring GX software (Agilent) using default parameters to remove low-quality probes (Sgadò et al., 2013). Signals were then normalized by means of the quantile normalization method, and data were statistically filtered by two-way ANOVA imposing a fold change ≥2 for each gene in at least one of the four experimental data groups. Differentially expressed genes were classified by DAVID software, applying Benjamini-corrected p value cutoff of 0.05. Gene classification was performed according the Kyoto Encyclopedia of Genes and Genomes (KEGG; http://www.genome.jp/kegg/), Panther Molecular Function (http://www.pantherdb.org/panther/ontologies.jsp), and GOterm Molecular Function (http://geneontology.org) databases.
qRT-PCR.
Total RNAs were extracted by Trizol reagent (Invitrogen) from explanted hippocampi (n = 4 mice per experimental group). DNase-treated RNAs were purified by RNA extraction RNAeasy Kit (QIAGEN). cDNA was synthesized from pooled RNAs by SuperScript VILO cDNA Synthesis Kit (Invitrogen) according to the manufacturer' instructions. qRT-PCR was performed in a C1000 Thermal Cycler (Bio-Rad) with real-time detection of fluorescence, using the KAPA SYBR FAST Master Mix reagent (KAPA Biosystems). Mouse mitochondrial ribosomal protein L41 (mRPL41) was used as a standard for quantification. Primer sequences (Sigma Genosys) are reported in Table 1. Ratios of comparative concentrations of each mRNA with respect to L41 mRNA were then calculated and plotted as the average of three independent reactions (technical replicates) obtained from each RNA. Expression analyses were performed using the CFX3 Manager (Bio-Rad) software (Sgadò et al., 2013).
Table 1.
Primers used for qRT-PCR experiments
| Gene | Forward primer (5′-3′) | Reverse primer (5′-3′) | GenBank # |
|---|---|---|---|
| CCL12 | CTACCACCATCAGTCCTC | TGAATCTTCTGCTTAACAACAT | NM011331 |
| CCL2 | GAGTAGGCTGGAGAGCTACAAGAG | AGGTAGTGGATGCATTAGCTTCAG | NM11333 |
| CCL4 | CTCTCTCCTCTTGCTCGT | GGTCTCATAGTAATCCATCACAA | NM013652 |
| CCL5 | AGAATACATCAACTATTTGGAGA | CCTTGCATCTGAAATTTTAATGA | NM013653 |
| CCR2 | CCAGTAAATGCCATGCAAGTTC | CCGTGGATGAACTGAGGTAAC | NM009915 |
| CXCL10 | GACCATCAAGAATTTAATGAAAGCG | CCATCCACTGGGTAAAGGG | NM021274 |
| IL1β | ACGGACCCCAAAAGATGAAG | TTCTCCACAGCCACAATGAG | NM008361 |
| TLR2 | TGATGGTGAAGGTTGGACG | CGGAGGGAATAGAGGTGAAAG | NM011905 |
| TLR4 | TTCAGAACTTCAGTGGCTGG | TGTTAGTCCAGAGAAACTTCCTG | NM021297 |
ELISA.
Hippocampi (n = 4–6 mice per experimental group) were homogenized in a Tris buffer containing a protease inhibitor mixture (150 mm NaCl, 25 mm Tris, 1% Triton X-100 pH 7.4, complete protease inhibitor mixture; Roche Diagnostics). Samples were centrifuged for 30 min at 15,000 × g, and supernatants assayed for total protein content using a Pierce BCA protein assay kit (Thermo Fisher Scientific). Cytokine levels in tissue and serum samples (n = 4–6 mice per experimental group, each sample in triplicate) were assessed using MSD multiplex kit for mouse proinflammatory cytokines (K15012B; Meso Scale Discovery). CCL2 protein quantitation in blood and hippocampal extracts was performed using CCL2 ready-set-go ELISA kit (eBioscience), according to the manufacturer's instructions.
CCL2 mRNA in situ hybridization.
Brains from 3 chronically epileptic mice were rapidly removed and frozen on dry ice, 4 h after LPS challenge. Coronal cryostat sections (20 μm thick) were fixed in 4% PFA. Nonradioactive in situ hybridization was performed as previously described (Tripathi et al., 2009) using a mix containing a CCL2 (GenBank ID: NM 011333.1) digoxigenin-labeled riboprobe. Signal was detected by alkaline phosphatase-conjugated anti-digoxigenin antibody followed by alkaline phosphatase staining. The specificity of the results was confirmed by the use of sense riboprobes (data not shown). Images were acquired using a Zeiss Axio Observer z1 microscope.
Immunostaining.
Immunohistochemical characterization of CCL2 and CCR2 protein expression was performed on brains from 3 chronically epileptic mice treated with LPS. Brains were fixed by transcardial perfusion with 4% PFA followed by 1 h postfixation at 4°C, and coronal sections (40 μm thick) were cut on a vibratome. Serial sections at the level of the dorsal hippocampus were incubated overnight with appropriate antibodies (all from Abcam: CCL2, 1:200 dilution; CCR2, 1:200 dilution; CD68, 1:400 dilution). Signals were revealed with biotin-conjugated secondary antibody and streptavidin conjugated to appropriate fluorophores (AlexaFluor-488/-594, Invitrogen). Images were acquired using a Zeiss Axio Observer z1 microscope.
Immunoblotting.
To assess NF-kB phosphorylation, hippocampal proteins from LPS (n = 4) and LPS+RS (n = 6) treated mice were extracted with lysis buffer (1% Triton X-100, 10% glycerol, 20 mm Tris HCl, pH 7.5, 150 mm NaCl, 10 mm EDTA, 1 μg/ml leupeptin, 1 mg/ml aprotinin, 1 mm PMSF, PhosSTOP Roche phosphatase inhibitors mixture). Protein concentration was determined through BCA protein assay kit (Euroclone). Equal amounts of each sample (30 μg) were separated on 4%–12% precast gels (Invitrogen), transferred to nitrocellulose membranes, blocked, and then incubated with primary antibody overnight at 4°C (p65, 1:1000, Cell Signaling Technology; phospho p65 S536, 1:1000, Cell Signaling Technology; and actin 1:8000, Sigma-Aldrich). Secondary antibodies (anti-rabbit Ly-Cor IRDye800RD; anti-mouse Ly-Cor IRDye680RD) were used at 1:10,000 dilution for 1 h at room temperature.
The membranes were dried overnight in the dark at room temperature and the signal was measured using an Odyssey CLx-Infrared Imaging System. The signal intensity of immunoblotting bands was quantified using iStudio software. Data are mean ± SEM.
Statistical analyses.
For EEG experiments, statistical analysis was performed by two-way repeated-measures ANOVA followed by Holm–Sidak test for post hoc comparisons. Two-way ANOVA followed by Tukey test was used for comparing gene expression at 4/24 h following LPS/saline treatment. One-way ANOVA (followed by Dunn's or Holm–Sidak test) was used for comparing mean seizure duration and cytokine/chemokine concentrations in blood and hippocampi. Differences between two groups were assessed with Student's t test because our data were normally distributed. For microarray data analysis, DAVID (http://david.abcc.ncifcrf.gov) was used to assess for functional categories overrepresented in the differentially expressed 533 common genes between 4 and 24 h dataset. Pairwise comparisons of qRT-PCR and immunoblotting data were assessed by a two-tailed Student's t test. Level of significance was set at p < 0.05.
Results
Systemic inflammation enhances spontaneous seizures
MTLE was induced by unilateral injection of KA into the adult mouse hippocampus (Riban et al., 2002; Antonucci et al., 2008). All experiments were conducted during the chronic phase of epilepsy (i.e., starting from 2 weeks after KA), when the injected side presents typical hippocampal sclerosis (Fig. 1A), and EEG recordings show frequent SRSs, interictal clusters, and isolated spikes (Fig. 1B).
Figure 1.

Histopathological changes and EEG seizures in the KA model of MTLE. A, Nissl staining in coronal sections from a naive mouse (top) and from a mouse killed 21 d after intrahippocampal KA (bottom). In the epileptic hippocampus, note the typical granule cell dispersion and extensive neuronal loss in CA1 and CA3. Scale bar, 500 μm. B, Representative EEG recordings displaying activity in the hippocampus during the chronic phase of epilepsy. Three types of epileptiform events are distinguished: seizures (spike clusters lasting for >4 s; a, red), interictal clusters (spike clusters lasting <4 s; b, green), and isolated spikes (c, blue).
We first examined the impact of a systemic inflammatory challenge on seizure activity. Baseline SRS were recorded for 4–5 d before intraperitoneal treatment with LPS (100 μg/kg) or saline (SAL) as control. EEG recordings were performed 2–4 h after systemic challenge (i.e., when the behavioral response to LPS is highest, Teeling et al., 2007) and at 24 h. We found that injection of saline had no effect on SRS at either time point, whereas injection of LPS clearly increased seizure incidence within 4 h (two-way repeated-measures ANOVA followed by Holm–Sidak test, p < 0.05; Fig. 2A,B). Total time spent in ictal and interictal activity was also significantly increased by LPS (p < 0.05; Fig. 2C,E). Interestingly, the inflammatory challenge did not impact on mean seizure duration and frequency of isolated spikes (one way ANOVA, p = 0.6; Fig. 2D,F). LPS effects were transient, as mice recorded 24 h after treatment showed a return to the baseline, pre-LPS level of seizures and interictal discharges (post-ANOVA Holm–Sidak test, p > 0.05; Fig. 2B,C,E).
Figure 2.

Impact of LPS challenge on the epileptic brain. A, Representative intrahippocampal EEG recordings from chronically epileptic mice, before and 2–4 h after saline/LPS administration. LPS clearly increases SRS frequency. B, Number of EEG seizures per 10 min of recording in epileptic mice, before and after saline (black circles) or LPS (red circles). Seizure frequency is significantly enhanced by LPS (two-way repeated-measures ANOVA followed by Holm–Sidak test, p < 0.05). C, Total time spent in ictal activity per 10 min of recording. Epileptic animals treated with LPS significantly spent more time in ictal activity than saline-injected mice (two-way repeated-measures ANOVA followed by Holm–Sidak test, p < 0.05). D, Mean duration of EEG seizures in saline- and LPS-treated mice (one way ANOVA; p = 0.7). E, Total time spent in interictal activity per 10 min of recording. Epileptic animals treated with LPS (red circles) significantly spent more time in interictal activity than saline-injected mice (black circle) 2–4 h following the systemic challenge (two-way repeated-measures ANOVA followed by Holm–Sidak test, p < 0.05). F, Number of isolated spikes per 10 min of recordings. No difference was found between LPS and saline-injected epileptic mice (two-way repeated-measures ANOVA followed by Holm–Sidak test, p = 0.5). Data are ± SEM. *p < 0.05.
CCL2 upregulation in the epileptic hippocampus following LPS
We then performed a microarray analysis to investigate the gene expression pathways activated by LPS in KA-injected hippocampi. To this purpose, we compared the transcriptomic profile of chronically epileptic hippocampi in LPS- versus saline-treated mice. The expression profile of epileptic hippocampi markedly differed between LPS- and saline-treated animals, at both 4 and 24 h after treatment (Fig. 3A). A total of 533 genes were differentially expressed in epileptic hippocampi at both 4 and 24 h after LPS, compared with saline-treated animals; pathway analysis revealed that most of these differentially expressed genes belong to chemokine/cytokine pathways (Fig. 3B). We next used qRT-PCR to validate nine of these differentially expressed genes. Compared with saline-treated epileptic mice, CCL2 and IL-1β mRNA were 10-fold and 8-fold, respectively, upregulated in LPS-treated epileptic mice 4 h after LPS administration, significantly decreasing at 24 h (two-way ANOVA followed by Tukey's test, p < 0.0001; Fig. 4). CCL4 mRNA was only 1.9-fold upregulated in LPS-treated mice at 4 h and returned to basal levels 24 h after LPS administration (two-way ANOVA followed by Tukey's test, p = 0.02). The chemokines CCL5, CCL12, and CXCL10 showed a stronger upregulation at 24 h with respect to 4 h (two-way ANOVA followed by Tukey's test, p < 0.0001). The CCL2 receptor CCR2 as well as the Toll-like receptors TLR4 and TLR2 showed modest changes in LPS-treated mice (Fig. 4). Together, the strong increase of CCL2 and IL-1β expression at the time of LPS-induced seizure aggravation (4 h) points to a possible involvement of these molecules in mediating LPS effects.
Figure 3.

Gene expression changes triggered by systemic LPS in the epileptic hippocampus. A, Microarray heat map of the 533 genes differentially expressed at both 4 and 24 h in the hippocampus of LPS- versus saline-treated epileptic mice. A color code scale was used to show gene expression differences in logarithmic fold change units between the groups (blue represents lowest expression; red represents higher expression). B, Overrepresented gene ontology categories of genes differentially expressed in the hippocampus of LPS- versus saline-treated chronically epileptic mice, at both 4 and 24 h after treatment. Differentially expressed genes (533 in total) were classified by DAVID software, applying Benjamini-corrected p value cutoff of 0.05. The most significant categories are displayed at the top of the graph to downward (p value, gray line) and gene number arranged horizontally by the length of the bars (gene counts, colored bars). KEGG PATH, PANTHER MF, and GOTERM MF indicate the databases used for gene classification (KEGG, Panther Molecular Function, and GOterm Molecular Function, respectively; for details, see Materials and Methods).
Figure 4.

CCL2 and other inflammatory genes are upregulated in the hippocampus of LPS-treated epileptic mice. qRT-PCR validation of microarray experiments; plots represent the mRNA expression of 9 inflammatory genes differentially expressed (upregulated) in the hippocampus of LPS-treated epileptic mice. Values are plotted as the fold increase in LPS- versus saline-treated chronically epileptic mice (LPS/SAL ratio). CCL2 mRNA was 10-fold upregulated in LPS-treated epileptic hippocampus 4 h after LPS administration, with a significant decrease of 44.5% at 24 h (two-way ANOVA followed by Tukey's test, p < 0.001). *p < 0.05; ***p < 0.001.
We then analyzed CCL2 and IL-1β protein levels 4 h following LPS challenge (Fig. 5A,B) using ELISA. LPS increased CCL2 and IL-1β levels in the blood of both epileptic and naive mice (Fig. 5A,B). Analysis of hippocampal samples revealed a strong “priming” effect, with CCL2 expression more robustly upregulated in the hippocampus of epileptic versus naive mice (one-way ANOVA followed by Holm–Sidak test, p < 0.05; Fig. 5A). Similar results were obtained for IL-1β in the blood, whereas IL-1β levels did not differ significantly in the hippocampus of epileptic or naive mice treated with LPS (Fig. 5B). Multiplex ELISA revealed a robust upregulation of TNFα, interferon-γ, and IL-10 in the blood of LPS-treated mice, but increases in the brain were extremely modest and independent of the epileptic phenotype (Fig. 5C–E). These data indicate selectivity in the “mirror” inflammatory cascades triggered by a systemic challenge within the epileptic brain, and a potential role of CCL2 in translating the CNS effects of systemic inflammation.
Figure 5.

Cytokine/chemokine concentrations in blood and hippocampus of epileptic and naive mice, 4 h after LPS/saline treatment. A, B, LPS increased the levels of CCL2 and IL-1β in the blood of both epileptic and naive mice (one-way ANOVA, p < 0.05). A, In the hippocampus, CCL2 expression was more robustly upregulated in epileptic versus naive mice (one-way ANOVA followed by Holm–Sidak test, p < 0.05). B, IL-1β showed a similar but nonsignificant trend (one way ANOVA followed by Dunn's test p > 0.05). C–E, TNFα, interferon-γ, and IL-10 were upregulated in the blood of LPS-treated mice (one-way ANOVA followed by Dunn's test, p < 0.01), but no consistent mirror response was observed in hippocampal samples of either naive or epileptic animals (one-way ANOVA, p > 0.4). *p < 0.05; **p < 0.01.
We next examined the cell populations expressing CCL2 and its receptor CCR2 in the epileptic hippocampus. CCL2 mRNA in situ hybridization and immunostaining indicated expression of CCL2 in pyramidal neurons and dispersed granule cells of the dentate gyrus following LPS challenge (Fig. 6A–C). Several small, likely glial cells of stratum oriens, stratum radiatum, stratum lacunosum moleculare, and hilus were also labeled (Fig. 6A,B). Immunohistochemical localization of CCR2 was found predominantly in activated microglia/macrophages within the sclerotic tissue (Fig. 6D,E), consistent with a role for CCR2 in microglia and monocyte recruitment (Shi and Pamer, 2011; Cunningham, 2013).
Figure 6.
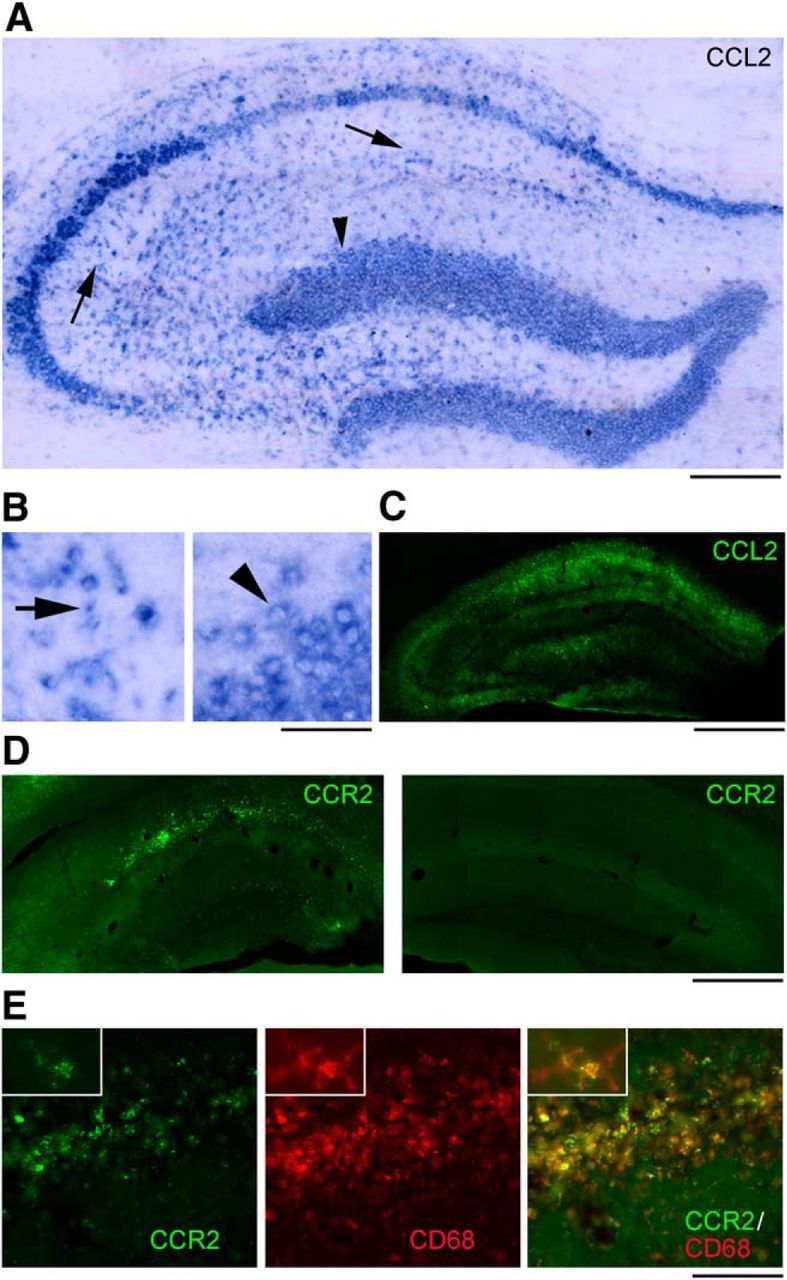
Cellular localization of CCL2 and CCR2 in the sclerotic hippocampus after LPS. A–C, CCL2 mRNA (A, B) and protein (C) staining on representative sections from the dorsal hippocampus of an epileptic mouse, 4 h after LPS. CCL2 staining is present in pyramidal neurons, dispersed granule cells of the dentate gyrus (A, B, arrowhead) and several small, likely glial cells of stratum oriens, stratum radiatum (A, B, arrows), stratum lacunosum moleculare, and hilus. Details of labeled cells are shown in B. Left, CA1 stratum radiatum. Right, Dentate granule cells. Scale bars: A, 200 μm; B, 40 μm; C, 600 μm. D, Immunostainings of CCR2 on representative sections from the epileptic (left) and contralateral (right) hippocampus, 4 h after LPS. CCR2 staining is mainly restricted to the CA1 subfield and dentate gyrus of the epileptic hippocampus and is absent from the contralateral side. Scale bar, 600 μm. E, Immunostainings of CCR2 (green), CD68 (red), and their colocalization (yellow) on a representative section from the CA1 subfield of an epileptic mouse, 4 h after LPS. Expression of CCR2 in activated microglia/macrophages, as indicated by CCR2/CD68 colocalization (yellow), is evident in high-magnification figures shown in insets. Scale bar: 150 μm; insets, 30 μm.
Interference with CCL2/CCR2 signaling abrogates LPS-induced seizure enhancement
We next asked whether interfering with CCL2 would prevent the enhancement of chronic seizures following systemic LPS treatment. We first used the anti-inflammatory drug bindarit that preferentially inhibits transcription of the monocyte chemoattractant subfamily of CC chemokines, including CCL2 (Mirolo et al., 2008; Ge et al., 2012; Mora et al., 2012). We recorded baseline EEG seizure activity; then epileptic animals received daily intraperitoneal injections of bindarit (100 mg/kg) (Ge et al., 2012) or vehicle solution (MC) for 4 d. EEG recording sessions were performed 30 min after the third and the fourth daily injection. At the end of the recording session on the fourth day, mice were challenged with LPS and recorded 2–4 h later (Fig. 7A). Recordings performed before LPS challenge showed that seizure frequency and total time spent in seizures were unaltered by either bindarit or vehicle with respect to baseline (two-way repeated-measures ANOVA followed by Holm–Sidak test, p > 0.05; Fig. 7B,C). Importantly, LPS triggered the expected seizure upregulation in controls but failed to do so in animals treated with bindarit (two-way repeated-measures ANOVA, bindarit vs control, 2–4 h after LPS, p < 0.01; Fig. 7B,C). Mean seizure duration following LPS administration was unaffected by either bindarit or vehicle treatment (one-way ANOVA, p = 0.3; Fig. 7D). The LPS-induced increase in interictal discharges was also abolished by bindarit (Fig. 7E), whereas the number of isolated interictal spikes did not vary between bindarit- and vehicle-treated epileptic mice (Fig. 7F). Thus, treatment with bindarit abolishes the seizure-enhancing effect of systemic inflammation.
Figure 7.

Treatment with bindarit abolishes the seizure-enhancing effect of LPS. A, Experimental protocol. After baseline assessment of SRS, animals were treated daily with either bindarit (Bin) or vehicle (MC) and injected systemically with LPS on the fourth day. B, C, Frequency of seizures and total time spent in ictal activity per 10 min of recording (normalized to the baseline period). Before LPS treatment (3–4 d), seizure frequency and total time spent in seizures were unaltered by either bindarit or vehicle with respect to baseline (two-way repeated-measures ANOVA followed by Holm–Sidak test, p > 0.05). After LPS challenge (post LPS), seizure frequency and total duration of ictal activity were significantly higher in controls with respect to bindarit-treated animals (p < 0.01). D, Mean seizure duration in bindarit (Bin) and control animals (MC) before (baseline) and after LPS administration. Mean seizure duration was unaffected by LPS + bindarit or LPS + MC treatment (one-way ANOVA, p = 0.7). E, Total time spent in interictal activity per 10 min of recordings (normalized to the baseline period). Before LPS treatment (3–4 d), total time spent in interictal activity was unaltered by either bindarit or vehicle with respect to baseline (two-way repeated-measures ANOVA, p > 0.05). After LPS (2–4 h after treatment), the total duration of interictal activity was significantly higher in controls with respect to bindarit-treated animals (two-way repeated-measures ANOVA, p < 0.001). F, Number of isolated spikes per 10 min of recording (normalized to the baseline period). Bindarit- and vehicle-treated epileptic mice showed the same range of isolated spike frequency 2–4 h after LPS administration (two-way repeated-measures ANOVA followed by Holm–Sidak test, p = 0.3). **p <0.01; ***p < 0.001.
To probe the effects of bindarit at the molecular level, we collected epileptic hippocampi and blood samples from bindarit-and vehicle-treated mice, 4 h after LPS delivery. ELISA showed that CCL2 protein was reduced by 77.4% in blood of bindarit-treated animals, compared with control mice (t test, p = 0.01; Fig. 8A). qRT-PCR confirmed this reduction at the mRNA level (p < 0.001; Fig. 8B). In blood samples, bindarit also dampened CCL5 mRNA levels (t test, p < 0.01) and robustly increased CCR2 mRNA (t test, p = 0.0017), suggesting a compensatory response to pharmacological suppression of CCL2 availability (Fig. 8B). No statistically significant differences were found for IL-1β and TLR2 mRNA expression levels in blood following bindarit treatment (Fig. 8B). qRT-PCR revealed a more widespread reduction of proinflammatory pathways in the hippocampus of bindarit-treated mice: CCL2, CCL5, IL1β, and TLR2 mRNAs were robustly downregulated, whereas CCR2 mRNA expression was increased (t test, p < 0.01 for all comparisons; Fig. 8C).
Figure 8.
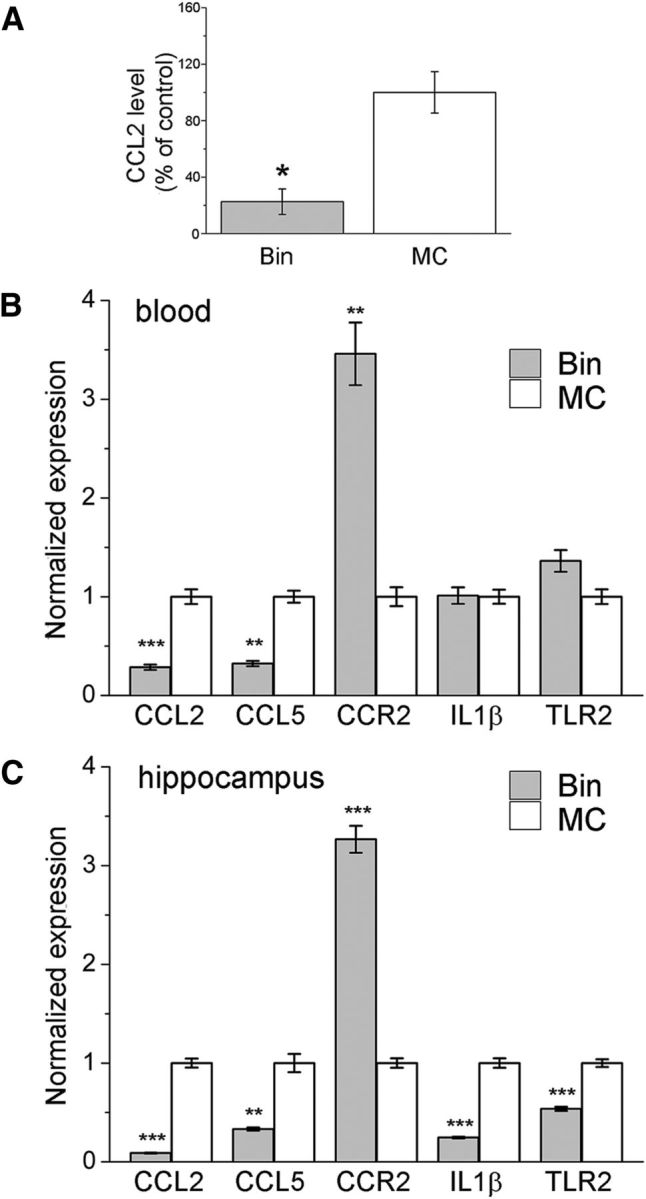
Effect of bindarit on CCL2, CCL5, CCR2, IL-1β, and TLR2 expression. A, CCL2 protein levels were reduced by −77.4% in serum of bindarit-treated animals compared with control mice (t test, p = 0.01), 4 h after LPS challenge. B, C, CCL2, CCL5, CCR2, IL-1β, and TLR2 mRNA levels measured by qRT-PCR in blood (B) and in the hippocampus (C) of control (MC) or bindarit (Bin) treated epileptic mice, 4 h after LPS injection. In the blood, bindarit dampened CCL2 and CCL5 mRNA levels (t test, p < 0.01) and increased CCR2 expression (t test, p < 0.01; B). In the hippocampus, bindarit downregulated CCL2, CCL5, IL- 1β, and TLR2 mRNAs while increasing CCR2 mRNA (t test, p < 0.0001 for CCL2, p < 0.02 for CCL5, p < 0.0001 for IL-1β, p < 0.0005 for TLR2, and p < 0.0001 for CCR2; C). *p < 0.05; **p < 0.01; ***p < 0.001.
CCL2 acts mainly through the G-protein-coupled receptor CCR2 to exert its biological effects (Semple et al., 2010). Therefore, we tested the effects of a potent and selective CCR2 antagonist, RS102895 (Hung et al., 2013; Ren et al., 2015) on LPS-induced seizures (Fig. 9A). We found that systemic RS102895 treatment, but not vehicle, abolished the increase of epileptiform discharges triggered by LPS (t test, p < 0.01; Fig. 9B). The enhancement of interictal activity was also counteracted by RS102895 (t test, p = 0.01; Fig. 9C). To examine molecular correlates of LPS-induced CCR2 signaling, we tested whether phosphorylation of the transcription factor NF-κB (Yang et al., 2003; Mora et al., 2012) is impacted by RS102895. We used immunoblotting to quantify levels of total (p65) and phosphorylated NF-κB (S536 phospho p65) in sclerotic hippocampi from LPS+vehicle and LPS+RS102895 mice (Fig. 9D). We found that, although total levels of p65 were comparable in the two groups (t test, p = 0.76), RS102895 treatment significantly reduced the fraction of phosphorylated p65 (t test, p = 0.01; Fig. 9E).
Figure 9.

Systemic delivery of a CCR2 receptor antagonist prevents the LPS-induced enhancement of epileptic activity. A, Experimental protocol. B, Frequency of epileptiform discharges (normalized to the baseline period) in animals treated with vehicle (veh) or RS102895 (RS), 2–4 h after LPS challenge. RS102895 prevents the enhancement of epileptic activity (t test, p < 0.01). C, Total time spent in interictal activity (normalized to the baseline period) in LPS-injected animals treated with vehicle or RS102895. CCR2 antagonism prevents the LPS-induced increase in interictal discharges (t test, p = 0.01). D, Immunoblotting showing the levels of total p65, phosphorylated (phospho) p65, and β-actin (loading control) in the sclerotic hippocampus of a representative LPS+vehicle (veh) and LPS+RS102895 (RS) mouse. E, Quantification of the immunoblotting data. The statistical analysis (t test, p = 0.01) indicates consistent reduction of the fraction of phosphorylated p65 in LPS+RS102895 (RS) mice compared with LPS+vehicle (veh). **p ≤ 0.01.
To selectively interfere with CCL2 signaling within the epileptic focus, we injected a CCL2 neutralizing antibody (or control IgG) directly into the hippocampus of chronic epileptic animals 30 min before the LPS challenge (Fig. 10A). As expected, LPS increased SRS frequency and total time spent in ictal activity in control-injected hippocampi (Fig. 10B,C). Blocking CCL2 locally within the hippocampus completely abolished the LPS-induced increase in seizures (two-way ANOVA followed by Holm–Sidak test, control IgG vs anti-CCL2, p < 0.01; Fig. 10B,C), whereas mean seizure duration was unaffected (Fig. 10D). LPS-mediated increase of total time spent in interictal activity was also prevented by anti-CCL2 injection (p < 0.05; Fig. 10E), whereas the number of isolated interictal spikes did not differ between anti-CCL2-treated and control epileptic mice (Fig. 10F).
Figure 10.

Intrahippocampal injection of a CCL2 neutralizing antibody completely abrogates the increase in seizures following LPS. A, Experimental protocol. B, Seizure frequency in anti-CCL2 or control IgG-injected animals (Ctrl), 2–4 h after LPS administration. In control animals, seizure frequency is significantly higher than in anti-CCL2 injected animals (two-way ANOVA followed by Holm–Sidak test, p < 0.01). C, Total time spent in seizures in anti-CCL2 or control IgG-injected (Ctrl) animals, 2–4 h after LPS administration. In control IgG-injected animals (Ctrl), total duration of ictal activity is significantly higher than in anti-CCL2 injected animals (two-way ANOVA followed by Holm–Sidak test, p < 0.001). D, Mean seizure duration in anti-CCL2-injected and control animals before (baseline) and after LPS administration. Mean seizure duration was unaffected by anti-CCL2 + LPS treatment (one way ANOVA, p = 0.3). E, Total time spent in interictal activity (normalized to the baseline period). Anti-CCL2 prevented the LPS-mediated increase of interictal activity (two-way repeated-measures ANOVA followed by Holm–Sidak test, p < 0.01). F, Number of isolated spikes per 10 min of recording (normalized to the baseline period). No difference was found between anti-CCL2 injected and control IgG-injected (Ctrl) epileptic mice, 2–4 h after LPS administration (two-way repeated-measures ANOVA, p = 0.7). **p < 0.01; ***p < 0.001.
Discussion
In this article, we exploited systemic inflammation to perform a molecular screening for the identification of novel inflammatory mediators involved in seizure precipitation. We first examined the functional effect of a LPS challenge in chronically epileptic animals. As a model of chronic seizures, we chose a well-established mouse model based on a single intrahippocampal injection of KA, which induces nonconvulsive status epilepticus (SE) followed by the occurrence of SRS and extensive hippocampal damage (Riban et al., 2002; Gouder et al., 2004; Antonucci et al., 2008, 2009; Maroso et al., 2010; Pallud et al., 2011). Importantly, intracerebral KA administration induces blood–brain barrier disruption and triggers local inflammatory responses (Zattoni et al., 2011). We found that a systemic inflammatory challenge exacerbates the epileptic phenotype, enhancing SRS frequency in KA-injected, chronically epileptic mice. This is in agreement with previous studies showing a proconvulsant effect of a systemic inflammatory stimulus (Sayyah et al., 2003; Galic et al., 2008; Riazi et al., 2008; Friedman and Dingledine, 2011; Zattoni et al., 2011; de Vries et al., 2012; Györffy et al., 2014; Marchi et al., 2014), such as LPS (Sayyah et al., 2003; Galic et al., 2008; Györffy et al., 2014). In particular, LPS administration produces convulsions in rats treated with a normally subconvulsant dose of KA (Heida et al., 2005). Systemic LPS also enhances baseline hippocampal excitability and increases progression of rapid kindling, an effect that is counteracted by neutralization of IL-1β (Auvin et al., 2010). In addition, a growing body of evidence indicates that pilocarpine, one of the most widely used proconvulsant agents, does not require brain access to induce SE, apparently acting as a peripheral proinflammatory agent that triggers seizures (Marchi et al., 2014). Our data expand this notion, demonstrating, for the first time, that a systemic inflammatory challenge is able to worsen SRS occurrence in the intracerebral KA model of MTLE. The present data also add a novel mechanistic insight because LPS increased frequency of ictal events with no effect on seizure duration. Thus, peripheral inflammation appears to target specifically the mechanisms responsible for seizure onset, leaving seizure termination unaffected.
Microarray and protein analysis provided us with an overview of molecular factors regulated by LPS challenge in chronic epileptic animals. Among these factors, CCL2 emerged as a potential mediator of the functional effects of LPS. CCL-2 mRNA was upregulated at the time of LPS-induced seizure aggravation (4 h) and significantly decreased at the time at which seizure frequency returned to the baseline (24 h). We found that IL-1β mRNA also showed a similar behavior, in line with the well-known proconvulsant actions of this cytokine (Vezzani et al., 2013). CCL2 protein levels were rapidly upregulated by LPS both in the blood and in the sclerotic hippocampus. Interestingly, we found a significantly more robust rise of CCL2 levels in the epileptic versus naive hippocampus, likely due to a “priming” effect as a consequence of the KA-induced neurodegeneration (Perry and Holmes, 2014). Given the alterations in the blood–brain barrier typical of the KA-lesioned hippocampus (Zattoni et al., 2011), we cannot exclude the possibility that LPS-induced CCL2 upregulation is a consequence of blood–brain barrier disruption and associated cellular recruitment. However, several other inflammatory mediators, such as TNFα, interferon-γ, and IL-10, were upregulated by LPS only in blood but not in hippocampus (Fig. 5), indicating selectivity of the “mirror” response within the epileptic focus. Other studies using much higher doses of LPS (i.e., 2 mg/kg) found a more generalized increase in the expression of various proinflammatory genes in the hippocampus (Cazareth et al., 2014). Together, our data show that LPS triggers an exaggerated CCL2 upregulation in the epileptic brain, tightly coupled to seizure precipitation.
To test the functional role of CCL2 in inflammation-induced seizures, we used systemic delivery of bindarit, an indazolic derivative that acts as a powerful modulator of the inflammatory response. In particular, it is known that bindarit inhibits transcription of monocyte chemoattractant subfamily of CC chemokines (Cioli et al., 1992; Mirolo et al., 2008), and this is consistent with the decreased levels of both CCL2 and CCL5 mRNA in the blood and hippocampus of bindarit-treated animals (Fig. 8B,C). Interestingly, our data suggest a compensatory upregulation of the CCL2 receptor (CCR2) at both the peripheral and central levels (Fig. 8B,C), indicating cellular supersensitivity to CCL2 following its depletion. It is also interesting to note that the hippocampus of bindarit-treated mice displayed a reduced expression of additional inflammatory factors (i.e., IL-1β and TLR2), whose levels were unaffected in the blood. These data suggest that chronic downregulation of CCL2 by bindarit makes brain structures less responsive to the LPS challenge. This is consistent with the notion that CCL2 can prime microglial cells (Bhattacharyya et al., 2002; Rankine et al., 2006; Perry and Holmes, 2014). Indeed, CCL2 modulates the responsiveness of microglia to acute inflammation, and CCL2−/− mice display a dampened synthesis of proinflammatory cytokines (e.g., IL-1β, TNFα) following intraparenchymal LPS (Rankine et al., 2006).
To further corroborate the results obtained with systemic depletion of CCL2, we used parenteral administrations of a potent and selective CCR2 antagonist, RS102895, which has been previously used to interfere with CCR2 signaling in the brain (Hung et al., 2013; Ren et al., 2015). We found that administration of RS102895 blocked the enhancement of epileptiform activity and the phosphorylation of NF-κB (p65 subunit) induced by LPS. These data suggest the potential of CCR2 antagonists for the treatment of inflammation-induced seizures. We also targeted CCL2 directly into the epileptic focus, using blocking antibodies delivered at the time of LPS delivery. Results were clear in indicating a marked suppression of the LPS-induced seizure enhancement with the functionally blocking, but not control, antibodies. In conclusion, both systemic and local interference with CCL2/CCR2 signaling yields potent anticonvulsant effects following systemic inflammation. These data show a previously unrecognized role for CCL2 in mediating seizure upregulation following systemic inflammation.
Several mechanisms may account for the seizure-promoting action of CCL2. First, CCL2 may exert direct effects on neuronal excitability. Indeed, CCL2 alters electrophysiological properties and Ca2+ signaling in cerebellar neurons (van Gassen et al., 2005), reduces inhibitory responses in spinal cord neurons (Gosselin et al., 2005), and potentiates excitatory post synaptic currents in the Schaffer collateral pathway of the hippocampus in vitro (Zhou et al., 2011). These latter effects are mediated by activation of the p38 MAP kinase pathway (Cho and Gruol, 2008). Second, CCL2 may also increase seizure frequency indirectly, acting as a priming stimulus for the synthesis of other proinflammatory factors in the brain. As described above, depletion of CCL2 may result in lowered synthesis and signaling of IL-1β, whose involvement in seizure precipitation is well documented (Balosso et al., 2008; Maroso et al., 2011; Vezzani et al., 2011). Here, we have demonstrated that CCR2 is expressed in activated microglia/macrophages within the sclerotic hippocampus (Fig. 6). As activated microglial cells are prominently involved in the production and release of IL-1β in epileptic tissue (Vezzani et al., 1999), these data suggest that CCL2 may increase seizures via IL-1β. Thus, the CCL2 pathway may act as a master regulator of inflammatory processes in the epileptic brain by both directly promoting hyperexcitability and regulating the activity of downstream inflammatory effectors. Finally, CCL2 might also be involved in neuropathological changes that accompany seizures, as indicated by a recent study (Hung et al., 2013). After pilocarpine-induced SE, CCL2 mRNA and protein were significantly upregulated in the dentate gyrus, whereas the CCL2 receptor CCR2 was expressed in ectopic progenitors of hilar neurons. Systemic blockade of CCR2 with RS102895 attenuated the ectopic migration of neuronal progenitors into the hilus, indicating a crucial role of CCL2/CCR2 interaction in neuronal migration following seizures (Hung et al., 2013).
CCL2 elevations have been previously demonstrated in the brain of patients with intractable epilepsy (Choi et al., 2009) and following experimental seizures in animals (Foresti et al., 2009). Here, we provide the first demonstration of a key functional role for CCL2 in seizure precipitation. Drugs interfering with CCL2 signaling are currently under development for several inflammatory brain disorders (Semple et al., 2010) and may be tested in epileptic syndromes that remain resistant to currently available medications.
Footnotes
This work was supported by Italian Ministry of Health Grant RF-TAA-2008-1141282 to Y.B. and M.C. and Fondazione Pisa Grant 158/2011 to M.C. C.C. and M.A. are supported by fellowships from Accademia dei Lincei (Rome, Italy). F.P. was supported by a postdoctoral fellowship from Fondazione Veronesi (Milan, Italy). We thank Valentina Adami (High-Throughput Screening Facility, Centre for Integrative Biology, University of Trento, Trento, Italy) and Tarcisio Fedrizzi (Bioinformatics Facility, Centre for Integrative Biology, University of Trento, Trento, Italy) for help with microarray experiments; and Francesca Biondi (National Research Council, Pisa, Italy) for excellent animal care.
A.G. is an Angelini employee. The remaining authors declare no competing financial interests.
References
- Antonucci F, Di Garbo A, Novelli E, Manno I, Sartucci F, Bozzi Y, Caleo M. Botulinum neurotoxin E (BoNT/E) reduces CA1 neuron loss and granule cell dispersion, with no effects on chronic seizures, in a mouse model of temporal lobe epilepsy. Exp Neurol. 2008;210:388–401. doi: 10.1016/j.expneurol.2007.11.012. [DOI] [PubMed] [Google Scholar]
- Antonucci F, Bozzi Y, Caleo M. Intrahippocampal infusion of botulinum neurotoxin E (BoNT/E) reduces spontaneous recurrent seizures in a mouse model of mesial temporal lobe epilepsy. Epilepsia. 2009;50:963–966. doi: 10.1111/j.1528-1167.2008.01983.x. [DOI] [PubMed] [Google Scholar]
- Aronica E, Gorter JA. Gene expression profile in temporal lobe epilepsy. Neuroscientist. 2007;13:100–108. doi: 10.1177/1073858406295832. [DOI] [PubMed] [Google Scholar]
- Auvin S, Shin D, Mazarati A, Sankar R. Inflammation induced by LPS enhances epileptogenesis in immature rat and may be partially reversed by IL1RA. Epilepsia. 2010;51(Suppl 3):34–38. doi: 10.1111/j.1528-1167.2010.02606.x. [DOI] [PMC free article] [PubMed] [Google Scholar]
- Balosso S, Maroso M, Sanchez-Alavez M, Ravizza T, Frasca A, Bartfai T, Vezzani A. A novel non-transcriptional pathway mediates the proconvulsive effects of interleukin-1beta. Brain. 2008;131:3256–3265. doi: 10.1093/brain/awn271. [DOI] [PMC free article] [PubMed] [Google Scholar]
- Bhattacharyya S, Ghosh S, Dasgupta B, Mazumder D, Roy S, Majumdar S. Chemokine-induced leishmanicidal activity in murine macrophages via the generation of nitric oxide. J Infect Dis. 2002;185:1704–1708. doi: 10.1086/340820. [DOI] [PubMed] [Google Scholar]
- Cazareth J, Guyon A, Heurteaux C, Chabry J, Petit-Paitel A. Molecular and cellular neuroinflammatory status of mouse brain after systemic lipopolysaccharide challenge: importance of CCR2/CCL2 signaling. J Neuroinflammation. 2014;11:132. doi: 10.1186/1742-2094-11-132. [DOI] [PMC free article] [PubMed] [Google Scholar]
- Cho J, Gruol DL. The chemokine CCL2 activates p38 mitogen-activated protein kinase pathway in cultured rat hippocampal cells. J Neuroimmunol. 2008;199:94–103. doi: 10.1016/j.jneuroim.2008.05.011. [DOI] [PMC free article] [PubMed] [Google Scholar]
- Choi J, Nordli DR, Jr, Alden TD, DiPatri A, Jr, Laux L, Kelley K, Rosenow J, Schuele SU, Rajaram V, Koh S. Cellular injury and neuroinflammation in children with chronic intractable epilepsy. J Neuroinflammation. 2009;6:38. doi: 10.1186/1742-2094-6-38. [DOI] [PMC free article] [PubMed] [Google Scholar]
- Cioli V, Ciarniello MG, Guglielmotti A, Luparini MR, Durando L, Martinelli B, Catanese B, Fava L, Silvestrini B. A new protein antidenaturant agent, bindarit, reduces secondary phase of adjuvant arthritis in rats. J Rheumatol. 1992;19:1735–1742. [PubMed] [Google Scholar]
- Cross JH. Fever and fever-related epilepsies. Epilepsia. 2012;53(Suppl 4):3–8. doi: 10.1111/j.1528-1167.2012.03608.x. [DOI] [PubMed] [Google Scholar]
- Cunningham C. Microglia and neurodegeneration: the role of systemic inflammation. Glia. 2013;61:71–90. doi: 10.1002/glia.22350. [DOI] [PubMed] [Google Scholar]
- Devinsky O, Vezzani A, Najjar S, De Lanerolle NC, Rogawski MA. Glia and epilepsy: excitability and inflammation. Trends Neurosci. 2013;36:174–184. doi: 10.1016/j.tins.2012.11.008. [DOI] [PubMed] [Google Scholar]
- de Vries HE, Kooij G, Frenkel D, Georgopoulos S, Monsonego A, Janigro D. Inflammatory events at blood-brain barrier in neuroinflammatory and neurodegenerative disorders: implications for clinical disease. Epilepsia. 2012;53(Suppl 6):45–52. doi: 10.1111/j.1528-1167.2012.03702.x. [DOI] [PMC free article] [PubMed] [Google Scholar]
- Fabene PF, Navarro Mora G, Martinello M, Rossi B, Merigo F, Ottoboni L, Bach S, Angiari S, Benati D, Chakir A, Zanetti L, Schio F, Osculati A, Marzola P, Nicolato E, Homeister JW, Xia L, Lowe JB, McEver RP, Osculati F, et al. A role for leukocyte-endothelial adhesion mechanisms in epilepsy. Nat Med. 2008;14:1377–1383. doi: 10.1038/nm.1878. [DOI] [PMC free article] [PubMed] [Google Scholar]
- Foresti ML, Arisi GM, Katki K, Montañez A, Sanchez RM, Shapiro LA. Chemokine CCL2 and its receptor CCR2 are increased in the hippocampus following pilocarpine-induced status epilepticus. J Neuroinflammation. 2009;6:40. doi: 10.1186/1742-2094-6-40. [DOI] [PMC free article] [PubMed] [Google Scholar]
- Friedman A, Dingledine R. Molecular cascades that mediate the influence of inflammation on epilepsy. Epilepsia. 2011;52(Suppl 3):33–39. doi: 10.1111/j.1528-1167.2011.03034.x. [DOI] [PMC free article] [PubMed] [Google Scholar]
- Fujimoto H, Sangai T, Ishii G, Ikehara A, Nagashima T, Miyazaki M, Ochiai A. Stromal MCP-1 in mammary tumors induces tumor-associated macrophage infiltration and contributes to tumor progression. Int J Cancer. 2009;125:1276–1284. doi: 10.1002/ijc.24378. [DOI] [PubMed] [Google Scholar]
- Galic MA, Riazi K, Heida JG, Mouihate A, Fournier NM, Spencer SJ, Kalynchuk LE, Teskey GC, Pittman QJ. Postnatal inflammation increases seizure susceptibility in adult rats. J Neurosci. 2008;28:6904–6913. doi: 10.1523/JNEUROSCI.1901-08.2008. [DOI] [PMC free article] [PubMed] [Google Scholar]
- Ge S, Shrestha B, Paul D, Keating C, Cone R, Guglielmotti A, Pachter JS. The CCL2 synthesis inhibitor bindarit targets cells of the neurovascular unit, and suppresses experimental autoimmune encephalomyelitis. J Neuroinflammation. 2012;9:171. doi: 10.1186/1742-2094-9-171. [DOI] [PMC free article] [PubMed] [Google Scholar]
- Gosselin RD, Varela C, Banisadr G, Mechighel P, Rostene W, Kitabgi P, Melik-Parsadaniantz S. Constitutive expression of CCR2 chemokine receptor and inhibition by MCP-1/CCL2 of GABA-induced currents in spinal cord neurones. J Neurochem. 2005;95:1023–1034. doi: 10.1111/j.1471-4159.2005.03431.x. [DOI] [PubMed] [Google Scholar]
- Gouder N, Scheurer L, Fritschy JM, Boison D. Overexpression of adenosine kinase in epileptic hippocampus contributes to epileptogenesis. J Neurosci. 2004;24:692–701. doi: 10.1523/JNEUROSCI.4781-03.2004. [DOI] [PMC free article] [PubMed] [Google Scholar]
- Györffy B, Kovács Z, Gulyássy P, Simor A, Völgyi K, Orbán G, Baracskay P, Szabó Z, Janáky T, Dobolyi A, Juhász G, Czurkó A, Kékesi KA. Brain protein expression changes in WAG/Rij rats, a genetic rat model of absence epilepsy after peripheral lipopolysaccharide treatment. Brain Behav Immun. 2014;35:86–95. doi: 10.1016/j.bbi.2013.09.001. [DOI] [PubMed] [Google Scholar]
- Heida JG, Teskey GC, Pittman QJ. Febrile convulsions induced by the combination of lipopolysaccharide and low-dose kainic acid enhance seizure susceptibility, not epileptogenesis, in rats. Epilepsia. 2005;46:1898–1905. doi: 10.1111/j.1528-1167.2005.00286.x. [DOI] [PubMed] [Google Scholar]
- Hung YW, Lai MT, Tseng YJ, Chou CC, Lin YY. Monocyte chemoattractant protein-1 affects migration of hippocampal neural progenitors following status epilepticus in rats. J Neuroinflammation. 2013;10:11. doi: 10.1186/1742-2094-10-11. [DOI] [PMC free article] [PubMed] [Google Scholar]
- Mainardi M, Pietrasanta M, Vannini E, Rossetto O, Caleo M. Tetanus neurotoxin-induced epilepsy in mouse visual cortex. Epilepsia. 2012;53:e132–e136. doi: 10.1111/j.1528-1167.2012.03510.x. [DOI] [PubMed] [Google Scholar]
- Marchi N, Granata T, Janigro D. Inflammatory pathways of seizure disorders. Trends Neurosci. 2014;37:55–65. doi: 10.1016/j.tins.2013.11.002. [DOI] [PMC free article] [PubMed] [Google Scholar]
- Maroso M, Balosso S, Ravizza T, Liu J, Aronica E, Iyer AM, Rossetti C, Molteni M, Casalgrandi M, Manfredi AA, Bianchi ME, Vezzani A. Toll-like receptor 4 and high-mobility group box-1 are involved in ictogenesis and can be targeted to reduce seizures. Nat Med. 2010;16:413–419. doi: 10.1038/nm.2127. [DOI] [PubMed] [Google Scholar]
- Maroso M, Balosso S, Ravizza T, Iori V, Wright CI, French J, Vezzani A. Interleukin-1beta biosynthesis inhibition reduces acute seizures and drug resistant chronic epileptic activity in mice. Neurotherapeutics. 2011;8:304–315. doi: 10.1007/s13311-011-0039-z. [DOI] [PMC free article] [PubMed] [Google Scholar]
- Mirolo M, Fabbri M, Sironi M, Vecchi A, Guglielmotti A, Mangano G, Biondi G, Locati M, Mantovani A. Impact of the anti-inflammatory agent bindarit on the chemokinome: selective inhibition of the monocyte chemotactic proteins. Eur Cytokine Netw. 2008;19:119–122. doi: 10.1684/ecn.2008.0133. [DOI] [PubMed] [Google Scholar]
- Mora E, Guglielmotti A, Biondi G, Sassone-Corsi P. Bindarit: an anti-inflammatory small molecule that modulates the NFkappaB pathway. Cell Cycle. 2012;11:159–169. doi: 10.4161/cc.11.1.18559. [DOI] [PMC free article] [PubMed] [Google Scholar]
- Pallud J, Häussler U, Langlois M, Hamelin S, Devaux B, Deransart C, Depaulis A. Dentate gyrus and hilus transection blocks seizure propagation and granule cell dispersion in a mouse model for mesial temporal lobe epilepsy. Hippocampus. 2011;21:334–343. doi: 10.1002/hipo.20795. [DOI] [PubMed] [Google Scholar]
- Pernot F, Heinrich C, Barbier L, Peinnequin A, Carpentier P, Dhote F, Baille V, Beaup C, Depaulis A, Dorandeu F. Inflammatory changes during epileptogenesis and spontaneous seizures in a mouse model of mesiotemporal lobe epilepsy. Epilepsia. 2011;52:2315–2325. doi: 10.1111/j.1528-1167.2011.03273.x. [DOI] [PubMed] [Google Scholar]
- Perry VH, Holmes C. Microglial priming in neurodegenerative disease. Nat Rev Neurol. 2014;10:217–224. doi: 10.1038/nrneurol.2014.38. [DOI] [PubMed] [Google Scholar]
- Rankine EL, Hughes PM, Botham MS, Perry VH, Felton LM. Brain cytokine synthesis induced by an intraparenchymal injection of LPS is reduced in MCP-1-deficient mice prior to leucocyte recruitment. Eur J Neurosci. 2006;24:77–86. doi: 10.1111/j.1460-9568.2006.04891.x. [DOI] [PubMed] [Google Scholar]
- Ren F, Jiao H, Cai H. Analgesic effect of intrathecal administration of chemokine receptor CCR2 antagonist is related to change in spinal NR2B, nNOS, and SIGIRR expression in rat with bone cancer pain. Cell Biochem Biophys. 2015 doi: 10.1007/s12013-014-0510-7. doi: 10.1007/s12013-014-0510-7. Advance online publication. Retrieved Feb. 5, 2015. [DOI] [PubMed] [Google Scholar]
- Riazi K, Galic MA, Kuzmiski JB, Ho W, Sharkey KA, Pittman QJ. Microglial activation and TNFalpha production mediate altered CNS excitability following peripheral inflammation. Proc Natl Acad Sci U S A. 2008;105:17151–17156. doi: 10.1073/pnas.0806682105. [DOI] [PMC free article] [PubMed] [Google Scholar]
- Riban V, Bouilleret V, Pham-Lê BT, Fritschy JM, Marescaux C, Depaulis A. Evolution of hippocampal epileptic activity during the development of hippocampal sclerosis in a mouse model of temporal lobe epilepsy. Neuroscience. 2002;112:101–111. doi: 10.1016/S0306-4522(02)00064-7. [DOI] [PubMed] [Google Scholar]
- Sayyah M, Javad-Pour M, Ghazi-Khansari M. The bacterial endotoxin lipopolysaccharide enhances seizure susceptibility in mice: involvement of proinflammatory factors: nitric oxide and prostaglandins. Neuroscience. 2003;122:1073–1080. doi: 10.1016/j.neuroscience.2003.08.043. [DOI] [PubMed] [Google Scholar]
- Semple BD, Kossmann T, Morganti-Kossmann MC. Role of chemokines in CNS health and pathology: a focus on the CCL2/CCR2 and CXCL8/CXCR2 networks. J Cereb Blood Flow Metab. 2010;30:459–473. doi: 10.1038/jcbfm.2009.240. [DOI] [PMC free article] [PubMed] [Google Scholar]
- Sgadò P, Provenzano G, Dassi E, Adami V, Zunino G, Genovesi S, Casarosa S, Bozzi Y. Transcriptome profiling in engrailed-2 mutant mice reveals common molecular pathways associated with autism spectrum disorders. Mol Autism. 2013;4:51. doi: 10.1186/2040-2392-4-51. [DOI] [PMC free article] [PubMed] [Google Scholar]
- Shi C, Pamer EG. Monocyte recruitment during infection and inflammation. Nat Rev Immunol. 2011;11:762–774. doi: 10.1038/nri3070. [DOI] [PMC free article] [PubMed] [Google Scholar]
- Stamatovic SM, Keep RF, Mostarica-Stojkovic M, Andjelkovic AV. CCL2 regulates angiogenesis via activation of Ets-1 transcription factor. J Immunol. 2006;177:2651–2661. doi: 10.4049/jimmunol.177.4.2651. [DOI] [PubMed] [Google Scholar]
- Teeling JL, Felton LM, Deacon RM, Cunningham C, Rawlins JN, Perry VH. Sub-pyrogenic systemic inflammation impacts on brain and behavior, independent of cytokines. Brain Behav Immun. 2007;21:836–850. doi: 10.1016/j.bbi.2007.01.012. [DOI] [PubMed] [Google Scholar]
- Tripathi PP, Sgadò P, Scali M, Viaggi C, Casarosa S, Simon HH, Vaglini F, Corsini GU, Bozzi Y. Increased susceptibility to kainic acid-induced seizures in Engrailed-2 knockout mice. Neuroscience. 2009;159:842–849. doi: 10.1016/j.neuroscience.2009.01.007. [DOI] [PubMed] [Google Scholar]
- van Gassen KL, Netzeband JG, de Graan PN, Gruol DL. The chemokine CCL2 modulates Ca2+ dynamics and electrophysiological properties of cultured cerebellar Purkinje neurons. Eur J Neurosci. 2005;21:2949–2957. doi: 10.1111/j.1460-9568.2005.04113.x. [DOI] [PubMed] [Google Scholar]
- Vannini E, Restani L, Pietrasanta M, Panarese A, Mazzoni A, Rossetto O, Middei S, Micera S, Caleo M. Altered sensory processing and dendritic remodeling in hyperexcitable visual cortical networks. Brain Struct Funct. 2015 doi: 10.1007/s00429-015-1080-1. doi: 10.1007/s00429-015-1080-1. Advance online publication. Retrieved Jul. 12, 2015. [DOI] [PubMed] [Google Scholar]
- Vezzani A, Conti M, De Luigi A, Ravizza T, Moneta D, Marchesi F, De Simoni MG. Interleukin-1beta immunoreactivity and microglia are enhanced in the rat hippocampus by focal kainate application: functional evidence for enhancement of electrographic seizures. J Neurosci. 1999;19:5054–5065. doi: 10.1523/JNEUROSCI.19-12-05054.1999. [DOI] [PMC free article] [PubMed] [Google Scholar]
- Vezzani A, Moneta D, Conti M, Richichi C, Ravizza T, De Luigi A, De Simoni MG, Sperk G, Andell-Jonsson S, Lundkvist J, Iverfeldt K, Bartfai T. Powerful anticonvulsant action of IL-1 receptor antagonist on intracerebral injection and astrocytic overexpression in mice. Proc Natl Acad Sci U S A. 2000;97:11534–11539. doi: 10.1073/pnas.190206797. [DOI] [PMC free article] [PubMed] [Google Scholar]
- Vezzani A, Maroso M, Balosso S, Sanchez MA, Bartfai T. IL-1 receptor/Toll-like receptor signaling in infection, inflammation, stress and neurodegeneration couples hyperexcitability and seizures. Brain Behav Immun. 2011;25:1281–1289. doi: 10.1016/j.bbi.2011.03.018. [DOI] [PubMed] [Google Scholar]
- Vezzani A, Aronica E, Mazarati A, Pittman QJ. Epilepsy and brain inflammation. Exp Neurol. 2013;244:11–21. doi: 10.1016/j.expneurol.2011.09.033. [DOI] [PubMed] [Google Scholar]
- Yang F, Tang E, Guan K, Wang CY. IKK beta plays an essential role in the phosphorylation of RelA/p65 on serine 536 induced by lipopolysaccharide. J Immunol. 2003;170:5630–5635. doi: 10.4049/jimmunol.170.11.5630. [DOI] [PubMed] [Google Scholar]
- Zattoni M, Mura ML, Deprez F, Schwendener RA, Engelhardt B, Frei K, Fritschy JM. Brain infiltration of leukocytes contributes to the pathophysiology of temporal lobe epilepsy. J Neurosci. 2011;31:4037–4050. doi: 10.1523/JNEUROSCI.6210-10.2011. [DOI] [PMC free article] [PubMed] [Google Scholar]
- Zhou Y, Tang H, Liu J, Dong J, Xiong H. Chemokine CCL2 modulation of neuronal excitability and synaptic transmission in rat hippocampal slices. J Neurochem. 2011;116:406–414. doi: 10.1111/j.1471-4159.2010.07121.x. [DOI] [PMC free article] [PubMed] [Google Scholar]