

Abstract
The clustered architecture of the brain for different visual stimulus categories is one of the most fascinating topics in the cognitive neurosciences. Interestingly, recent research suggests the existence of additional regions for newly acquired stimuli such as letters (letter form area; LFA; Thesen et al., 2012) and numbers (visual number form area; NFA; Shum et al., 2013). However, neuroimaging methods thus far have failed to visualize the NFA in healthy participants, likely due to fMRI signal dropout caused by the air/bone interface of the petrous bone (Shum et al., 2013). In the current study, we combined a 64-channel head coil with high spatial resolution, localized shimming, and liberal smoothing, thereby decreasing the signal dropout and increasing the temporal signal-to-noise ratio in the neighborhood of the NFA. We presented subjects with numbers, letters, false numbers, false letters, objects and their Fourier randomized versions. A group analysis showed significant activations in the inferior temporal gyrus at the previously proposed location of the NFA. Crucially, we found the NFA to be present in both hemispheres. Further, we could identify the NFA on the single-subject level in most of our participants. A detailed analysis of the response profile of the NFA in two separate experiments confirmed the whole-brain results since responses to numbers were significantly higher than to any other presented stimulus in both hemispheres. Our results show for the first time the existence and stimulus selectivity of the NFA in the healthy human brain.
SIGNIFICANCE STATEMENT This fMRI study shows for the first time a cluster of neurons selective for visually presented numbers in healthy human adults. This visual number form area (NFA) was found in both hemispheres. Crucially, numbers have gained importance for humans too recently for neuronal specialization to be established by evolution. Therefore, investigations of this region will greatly advance our understanding of learning and plasticity in the brain. In addition, these results will aid our knowledge regarding related neurological illnesses (e.g., dyscalculia). To overcome the fMRI signal dropout in the neighborhood of the NFA, we combined high spatial resolution with liberal smoothing. We believe that this approach will be useful to the broad neuroimaging community.
Keywords: high-resolution fMRI, inferior temporal gyrus, letter, number, signal-to-noise ratio, vision
Introduction
The ability to process numbers efficiently is crucial to our daily lives. Simply consider how many numbers you encounter in a typical day—between checking the time on your alarm clock to choosing the right exit on your way home from work. Still, similar to reading, this skill likely gained importance too recently to be supported by human evolution (Dehaene and Cohen, 2011). In this prospect, it is particularly remarkable that neuronal regions selective for the processing of letters (Thesen et al., 2012), words (Cohen et al., 2000), and numbers (Shum et al., 2013; Abboud et al., 2015) have recently been described in the human brain (for a recent review, see Hannagan et al. (2015)). The development and specificity of these areas could provide tremendous insight into the plastic processes of the brain. Unfortunately, as of today, fMRI studies have failed to localize the number-selective visual number form area (NFA) reliably in healthy participants. The reason behind this failure is most probably related to the assumed location of the area: artifacts caused by the air/bone interface of the petrous bone lead to a strong signal dropout in this region (Shum et al., 2013). Circumventing this problem, using electrocorticography (ECoG), Shum et al. (2013) described a region in the inferior temporal gyrus (ITG) responding significantly stronger to numbers than to false numbers or letters. The investigators focused their analysis on the right hemisphere, although in two participants, left hemispheric electrodes showed a comparable response pattern as well. More recently, Abboud et al. (2015) tested in an fMRI study whether an auditory task involving numerical symbols could induce number form activations in the visual system of congenitally blind participants. To compensate for the strong signal dropout in the region, they excluded those voxels with the lowest signal strength. Although this approach condones the loss of data, Abboud et al. (2015) could successfully identify activations in the right ITG at the proposed location of the NFA. They also detected activations of a homologous region in the left ITG, which, however, did not survive the correction for multiple comparisons. Interestingly, the presence of a representation for visual Arabic number form has already been predicted by the triple-code model of number processing published much earlier (Dehaene and Cohen, 1995). The same group even predicted the NFA to be present bilaterally while speculating that the two hemispheres might be specialized to support different tasks (Cohen and Dehaene, 1995).
The current work is the first neuroimaging study focusing on number form processing in healthy participants. We propose a novel approach to overcome the fMRI signal dropout that improves signal quality at the source and thus works without any loss of data. By combining a 64-channel head coil with high spatial resolution, GRAPPA acceleration, localized shimming, and spatial smoothing, we were able to increase the signal strength and the temporal signal-to-noise ratio (tSNR), thereby increasing the detectability of the NFA. In contrast to previous studies (Polk et al., 2002), this approach also allowed us to locate the NFA on an individual subject level. This, in turn, enabled us to perform region of interest (ROI) analyses to visualize the selectivity of the NFA in more detail. To briefly anticipate our results, we found bilateral activations of the ITG at the proposed location of the NFA when contrasting numbers with false numbers or with several non-numerical stimuli. The ROI analysis, in two separate experiments, confirmed the number specificity of these bilateral clusters in the sense that numbers elicited significantly higher responses than any other category. To test the specificity of these results, we also performed similar analyses for the letter form area (LFA), an area previously described to respond to letter form (Thesen et al., 2012), and confirmed its response selectivity for letters. The detailed description of number-selective (and letter-selective) clusters will greatly facilitate our understanding of visual processing and neuronal plasticity.
Materials and Methods
Experiment 1
This experiment was designed to visualize the NFA in a group of healthy human subjects and to describe the response selectivity of the NFA is a detailed fashion.
Participants.
Twenty-four right-handed, healthy volunteers (16 female; mean age 25 ± 4 years) participated in the experiment. One subject was excluded due to technical difficulties during the data acquisition and another subject was excluded due to excessive head movement during the recording (i.e., translation/rotation of >7 mm/degrees). All subjects had normal or corrected to normal vision and gave informed written consent in accordance with the protocols approved by the ethical committees of the Friedrich Schiller University Jena.
Stimulation and procedure.
Participants were presented with 7 different stimulus categories. Arabic numbers (N), false numbers (FN), Fourier randomized versions of numbers (noise numbers; NN), Roman letters (L), false letters (FL), Fourier randomized versions of letters (noise letters; NL), and objects (O) were presented in 20-s-long blocks containing 40 images each. Three 12-min-long runs were presented, each containing 28 blocks and thus four presentations of each of the stimulus categories. The blocks were presented in a pseudorandomized order so that subsequent blocks did not contain the same category. Each block was followed by a 10-s-long break. Within each block, stimuli were presented for 300 ms, with a 200 ms interstimulus interval. The task of the participants was to detect immediate stimulus repetitions (1-back task) while the number of targets within each block was randomized between 0 and 2. The number stimuli consisted of 40 Arabic numbers between 0 and 99. All one-digit numbers were presented; the remaining numbers were two-digit numbers chosen in a way that each numeral occurred with identical probability. These stimuli were presented in 4 different font styles (Times New Roman, Britannic Bold, Comic Sans, and Bradley Hand ITC) so that they had different shapes and were trial unique during a run. Similarly, 24 capital and 16 small letters of the Roman alphabet were chosen (in particular, I, O, g, l, o, q, s, and u–y were excluded due to their apparent similarity to other letters/numbers) and presented in the same fonts as the numbers. The false characters were created from these numbers and letters similarly to Grotheer and Kovács (2014). In short, one to four components of a particular character in a given font were moved randomly to a different position, using Gimp 2.6 (for examples, see Fig. 1). Fourier randomization of the original characters yielded the random noise stimuli. Object stimuli were taken from the Bank of Standardized Stimuli (BOSS; Brodeur et al., 2010). Stimuli were presented with a 3° visual angle in the center of the screen on a uniform gray background and back-projected via an LCD video projector onto a translucent circular screen placed inside the scanner bore. Stimulus presentation was controlled via Matlab (The MathWorks) using Psychtoolbox (version 3.0.9).
Figure 1.

Stimuli used in Experiment 1. N, L, O, FN, FL, NN, and NL were presented.
Imaging parameters and data analysis.
A 3 T MR scanner (Siemens MAGNETOM Prisma fit) with a 64-channel head coil was used. To obtain a 3D structural scan, high-resolution sagittal T1-weighted images were acquired using a magnetization prepared rapid gradient echo sequence (MP-RAGE, TR = 2300 ms, TE = 3.03 ms, 1 mm isotropic voxel size). During stimulus presentation, we continuously acquired high-resolution functional images of the ventral parts of the occipital and temporal lobes (29 slices, T2*-weighted EPI sequence, TR = 2500 ms, TE = 31 ms, flip angle = 90°, in-plane resolution: 1.0*1.0 mm2, slice thickness: 1.0 mm, partial Fourier factor 7/8). Previous studies (Shum et al., 2013; Abboud et al., 2015) predicted the NFA to be located in close proximity to the tissue–air boundaries of the petrous bone and thus in an area greatly affected by susceptibility changes. These susceptibility changes are responsible for the commonly observed fMRI signal dropout in the caudal–ventral part of the temporal lobes because they cause complete magnetization dephasing within single voxels (Robinson et al., 2004). We compensated for this signal loss by enhancing our functional resolution to very small (1.0*1.0*1.0 mm3) isotropic voxels, which, in turn, reduces intravoxel dephasing (Merboldt et al., 2000; Wadghiri et al., 2001; Bellgowan et al., 2006). This high spatial resolution was facilitated by the enhanced SNR of the 64-channel head coil and by the 80 mT/m gradient performance available in the Prisma fit system. The tSNR was further increased during preprocessing by smoothing of the data; a Gaussian kernel of 8 mm was used as this kernel size was suggested as optimum (Mikl et al., 2008). Susceptibility-based image distortions were reduced using GRAPPA (Griswold et al., 2002) with an acceleration factor of 3. In addition, before the EPI sequences, for a localized shimming approach, a map of the static magnetic field (B0) was calculated based on 4 mm isotropic multiecho gradient echo data. Based on this B0 map, a least-square optimization of shim currents was performed locally for the proposed location of the NFA while taking care to always include the steep B0 gradient at the caudal–ventral portions of the temporal lobes into the shim volume. This additional shimming procedure took up to 5 min.
Details of preprocessing and statistical analysis were described previously (Cziraki et al., 2010). Briefly, the functional images were slice time corrected, realigned, normalized to the MNI-152 space, and spatially smoothed with a Gaussian kernel of 8 mm full width at half maximum (FWHM) using SPM12 (Welcome Department of Imaging Neuroscience, London). Whole-brain analyses were performed using the flexible factorial design of SPM12. To visualize the response selectivity of the NFA further, we additionally performed ROI analyses using the MARSBAR 0.42 toolbox for SPM (Brett et al., 2002). To avoid double-dipping (Kriegeskorte et al., 2009) during this analysis, the first run was used to determine the ROIs and the remaining two runs were used to extract the response profiles on a subject-by-subject basis. The NFA clusters were determined by contrasting numbers with all other stimulus categories (p < 0.001uncorrected) individually, whereas bilateral localization was successful in 17 of the 22 participants (77.3%) [average MNI coordinates (±SE) and cluster sizes (±SE): right hemisphere (n = 17): 55(2), −50(2), −15(1) and 65(20); left hemisphere (n = 19): −54(2), −55(2), −13(2) and 112(22)]. These coordinates are very similar to the coordinates reported in previous electrophysiological studies (right hemisphere: 51, −54, −24; Shum et al., 2013), studies of congenitally blind patients (right hemisphere: 53, −44, −12; Abboud et al., 2015), as well as to the peak coordinates of the whole-brain analysis of the current study (right hemisphere: 61, −46, −18; left hemisphere −61, −54, −18). The LFA cluster was determined by contrasting letters with all other stimuli (p < 0.001uncorrected). Consistent with previous studies showing a left hemispheric dominance for letter processing (Dehaene et al., 2010), the LFA could only be reliably identified in the left hemisphere in most participants [average MNI coordinates (±SE) and cluster size (±SE): left hemisphere (n = 17): −47(1), −56(2), −14(1) and 143(24)]. The seven experimental conditions (N, FN, NN, L, FL, NL, and O) were defined as separate regressors and convolved with the canonical hemodynamic response function (HRF) of SPM12 for a general linear model (GLM) analysis of the data. A time series of the mean voxel value within the areas of interest was calculated and extracted, using finite impulse response (FIR) models (Ollinger et al., 2001). The plateau (TR 3–10) of the HRF was averaged to perform repeated-measures ANOVAs. In the first ANOVA, we defined hemisphere (2) and stimulus (7) as factors and evaluated the number form area. To further understand the NFA results, we performed a second ANOVA in which we left out the object stimuli and used hemisphere (2), character type (2; number and letter), and stimulus type (3; standard, false, and noise) as factors. Similar analyses were performed for the LFA, but only for the left hemisphere. Post hoc analyses were performed using Fisher LSD tests.
Experiment 2
The second experiment of the current study focused on the differential response of the NFA to numbers and letters, particularly testing whether the previously obtained response-profile remains for single-digit numbers as well.
Participants.
For Experiment 2, 16 healthy volunteers (10 female; 15 right-handed, mean age 22 ± 3 years) were recruited. All subjects had normal or corrected to normal vision and gave informed written consent in accordance with the protocols approved by the ethical committees of the Friedrich Schiller University Jena.
Stimulation and procedure.
Four experimental runs were acquired and two of these runs were used to localize the NFA. These runs were similar to Experiment 1 in all aspects, with the only exception that only the single-digit numbers (0–9) and their corresponding false numbers and Fourier randomized images were presented. To ensure that the number of stimuli was matched across conditions, 10 capital letters were selected and presented together with their corresponding false versions and Fourier randomized images. All stimuli were presented in four different font styles so that they were trial unique during a block. Therefore, 40 different objects were presented in these runs. Because the main focus of this experiment was the differential response of the NFA to numbers and letters, in the remaining two runs, only numbers, letters, and false numbers were presented. Runs were presented in an alternating order, beginning with a run used for localization.
Imaging parameters and data analysis.
Imaging parameters and data preprocessing were similar to Experiment 1. The two localizer runs were used to determine the NFA on an individual subject level, whereas bilateral localization was successful in 14 of the 16 participants (87.5%) [p < 0.005; average MNI coordinates (±SE) and cluster sizes (±SE): right hemisphere (n = 14): 53(2), −63(3), −12(1) and 86(30); left hemisphere (n = 14): −54(2), −62(4), −12(2) and 119(25)]. The response profiles of these ROIs were extracted on a subject-by-subject basis from the remaining two runs. The three experimental conditions (N, FN, and L) were defined as separate regressors and convolved with the canonical HRF of SPM12, for a GLM analysis of the data. Similar to Experiment 1, a time series of the mean voxel value within the areas of interest was calculated and extracted using FIR models. The plateau (TR 3–10) of the HRF was averaged to perform a repeated-measures ANOVA with hemisphere (2) and stimulus (3) as factors. Post hoc analyses were performed using Fisher LSD tests. Every other detail was identical to those of Experiment 1.
Experiment 3
The third experiment was designed to test whether the special methodological and processing steps of the current study (such as the high spatial resolution of the recording, the localized shimming, and the spatial smoothing applied during preprocessing) are all mandatory to visualize the NFA.
Participants.
Thirteen healthy human volunteers (7 female; 13 right-handed, mean age 24 ± 1 years) participated in Experiment 3. One subject was excluded from the study due to inaccurate slice positioning and a resulting partial lack of data from the anterior temporal cortex. All subjects gave informed written consent in accordance with ethical committees of the Friedrich Schiller University Jena and had normal or corrected to normal vision.
Imaging parameters and data analysis.
In our aim to visualize the NFA in healthy participants, in the current study, we combined high-resolution imaging with liberal smoothing and a localized shimming approach in an attempt to compensate the previously described fMRI signal dropout near the ear canal (Shum et al., 2013). To test the validity of this approach, we recorded a group of participants and compared our parameters (29 slices, T2* weighted EPI sequence, TR = 2500 ms, TE = 31 ms, flip angle = 90°, in-plane resolution: 1.0*1.0 mm2, slice thickness: 1.0 mm, partial Fourier factor 7/8, GRAPPA with an acceleration factor of 3, localized shimming) with a commonly used lower-resolution scanning sequence (47 slices, T2* weighted EPI sequence, TR = 2500 ms, TE = 30 ms, flip angle = 90°, in-plane resolution: 3.0*3.0 mm2, slice thickness: 3.0 mm, GRAPPA with an acceleration factor of 2) with and without an additional localized shimming. Stimuli, paradigm, and task were identical to the runs used for localization in Experiment 2, as described above. Only one run was recorded for each of the sequences; the order of acquisition was counterbalanced across participants. We calculated images of the mean BOLD signal and the tSNR before and after the smoothing of the data. The mean BOLD signal is a measure of the overall signal intensity and was used to evaluate whether the fMRI signal dropout in the neighborhood of the NFA could be restricted successfully. It was calculated by averaging the realigned and normalized functional images. Conversely, the tSNR is a measure of image quality and particularly expresses the detectability of BOLD signal changes of interest (Murphy et al., 2007). tSNR was calculated by dividing the mean image by the SD of the images. Values were extracted from the peak voxel of the left and right NFA (defined on the basis of the group analysis in Experiment 1, MNI coordinates [x, y, z]: 61, −45, −17 and −60, −57, −17) to perform repeated-measures ANOVAs testing for the effect of hemisphere (2), sequence (3, high resolution, lower resolution with shimming and lower resolution without shimming), and smoothing (2) for both measures.
Results
Experiment 1
Behavioral data
The participants' performance and reaction times (RTs) were dependent on the presented stimulus (main effect of stimulus: F(6,126) = 13.61, p < 0.0001, ηp2 = 0.39 and F(6,120) = 3.08, p = 0.008, ηp2 = 0.13; for performance and RTs, respectively). This effect was, however, mainly driven by the Fourier randomized images for which, expectedly, performance dropped (p < 0.0004 for all comparisons) and RTs (NL: p < 0.11 for all comparisons) increased compared with all other stimuli. Interestingly, we also observed that participants performed better for letters than for false letters (p = 0.03) and objects (p = 0.04).
Whole-brain analyses
To determine whether an area selective for visually presented numbers could be detected, in Experiment 1, we contrasted numbers with false numbers or with all other stimulus categories in two separate analyses (pFWE = 0.05, cluster extend = 20 voxels). Contrasting numbers with false numbers revealed activations in the ITG in both hemispheres (MNI coordinates: 61, −46, −18 and −61, −54, −18; cluster sizes: 216 and 46 voxels for the right and left hemispheres, respectively; Fig. 2). These activations were also confirmed when numbers were contrasted against every other stimulus category (MNI coordinates: 61, −45, −17 and −60, −57, −17; cluster sizes: 175 and 3149 voxels). Contrasting numbers with all other stimuli showed additional bilateral activation in the fusiform gyrus (MNI coordinates: 42, −49, −17 and −46, −57, −15; cluster sizes: 597 and 3149 voxels), as well as in the early visual cortex (MNI coordinates: 5, −79, −0 and −8, −87, 2; cluster sizes: 424 and 26 voxels). The location of the observed number-selective activations was similar to those reported previously for the right hemisphere (51, −54, −24; Shum et al., 2013; and 53, −44, −12; Abboud et al., 2015).
Figure 2.

Group analysis in Experiment 1. Significant activations were found in the right and left inferior temporal gyri when numbers were contrasted with false numbers and with all other presented stimuli. Further, we found significant activations in the left fusiform gyrus when letters were contrasted with false letters and all other presented stimuli. p < 0.05(FWE), cluster extend = 20 voxels.
To test whether the LFA is present in both hemispheres as well, we performed similar analyses testing letters against false letters and against all other stimulus categories (pFWE = 0.05, cluster extend = 20 voxels). In contrast to the NFA, the LFA could only be determined reliably in the left hemisphere (Fig. 2). Contrasting letters with false letters revealed one cluster of activation in the left fusiform gyrus (MNI coordinates: −49, −59, −21; cluster size: 1033 voxels), which was confirmed when letters were contrasted with all other stimuli (MNI coordinates: −46, −59, −15; cluster size: 4389 voxels). Interestingly, contrasting letters with false letters also revealed a small cluster of activation in the right ITG (MNI coordinates: 64, −48, −16; cluster size: 386 voxels), which, however, could not be confirmed when comparing letters against all other stimuli. Conversely, contrasting letters with all other stimuli showed additional clusters in the right fusiform gyrus (MNI coordinates: 43, −47, −22; cluster size: 138 voxels), the right early visual cortex (MNI coordinates: 6, −73, −2; cluster size: 75 voxels), and an area in the left middle occipital gyrus (MNI coordinates: −43, −86, 0; cluster size: 169 voxels) closely related to the classical coordinates for the lateral occipital complex (Grill-Spector et al., 1999).
In summary, we could identify both the NFA and the LFA in our healthy participant group and, crucially, determined the NFA to be present in both hemispheres.
ROI analyses
We performed ROI analyses for the left LFA and the left and right NFAs to visualize their response selectivity in more detail. For this, we determined the NFA/LFA ROIs on an individual level by contrasting numbers/letters with all other stimuli (p < 0.001(uncorrected); Fig. 3A,B). To avoid double-dipping, we used only the first experimental run to determine the ROIs. This approach, however, rests upon the assumption that one run is sufficient to successfully identify the NFA. We tested this assumption empirically by superimposing on top of each other the results of the number versus all other stimuli contrast for the three runs (p < 0.005(uncorrected)). As Figure 3C shows, there is a strong and clear correspondence in the location of the NFA across runs, supporting the conclusion that one run is sufficient to identify the area. In the LFA, we found a main effect of stimulus (F(6,96) = 18.32, p < 0.0001, ηp2 = 0.53), whereas activations were higher for letters than for any other stimulus category (L > N: p = 0.04; L > FN: p = 0.004; L > NN: p < 0.0001; L > FL: p = 0.0007; L > NL: p < 0.0001; L > O: p = 0.02; see Fig. 3D). A main effect of stimulus (F(6,96) = 9.47, p < 0.0001, ηp2 = 0.37) was also found in the NFA. Crucially, this effect was similar in both hemispheres because neither a significant main effect of hemisphere (F(1,16) = 0.19, p = 0.67, ηp2 = 0.01) nor a significant interaction of stimulus and hemisphere (F(6,96) = 0.95, p = 0.47, ηp2 = 0.06) was observed. Post hoc analyses revealed larger activations for numbers than for any other stimulus category in the right (N > FN: p = 0.006; N > NN: p < 0.0001; N > L: p = 0.009; N > FL: p = 0.0002; N > NL: p < 0.0001; N > O: p = 0.02) and also in the left hemisphere (N > FN: p < 0.0001; N > NN: p < 0.0001; N > L: p = 0.05; N > FL: p < 0.0001; N > NL: p < 0.0001; N > O: p < 0.0001). Interestingly, letters also induced significantly larger neuronal responses than false stimuli and objects in the left hemisphere (L > FN: p = 0.01; L > NN: p < 0.0001; L > FL: p = 0.005; L > NL: p < 0.001; L > O: p = 0.02), but not in the right hemisphere (L > FN: p = 0.87; L > NN: p = 0.04; L > FL: p = 0.26; L > NL: p = 0.003; L > O: p = 0.79) of the NFA. To further understand these results, we performed a second ANOVA in which we used hemisphere (2), character type (2; number and letter), and stimulus type (3; standard, false and noise) as factors but left out the object stimuli. In the LFA, this analysis revealed no effect of character type (F(1,16) = 0.19, p = 0.67, ηp2 = 0.01), but a main effect of stimulus type (F(2,32) = 26.23, p < 0.0001, ηp2 = 0.62) and an interaction between character type and stimulus type (F(2,32) = 8.49, p = 0.001, ηp2 = 0.35). Post hoc analyses revealed a significant difference between numbers and letters only for the standard stimuli (standard: p = 0.001; false: p = 0.32; noise: p = 0.09). In the NFA, we observed a main effect of character type (F(1,16) = 39.59, p < 0.0001, ηp2 = 0.71) and stimulus type (F(2,32) = 11.40, p = 0.0002, ηp2 = 0.42), but no interaction between character type and stimulus type (F(2,32) = 1.53, p = 0.23, ηp2 = 0.09). Crucially, again, no main effect of hemisphere (F(1,16) = 0.11, p = 0.74, ηp2 = 0.007) and no interaction of hemisphere with any other factor (p < 0.28 for all comparisons) was observed. Therefore, the ROI analyses confirm the results of the whole-brain analyses regarding the bilateral nature of the NFA and suggest a similar function for both hemispheres.
Figure 3.
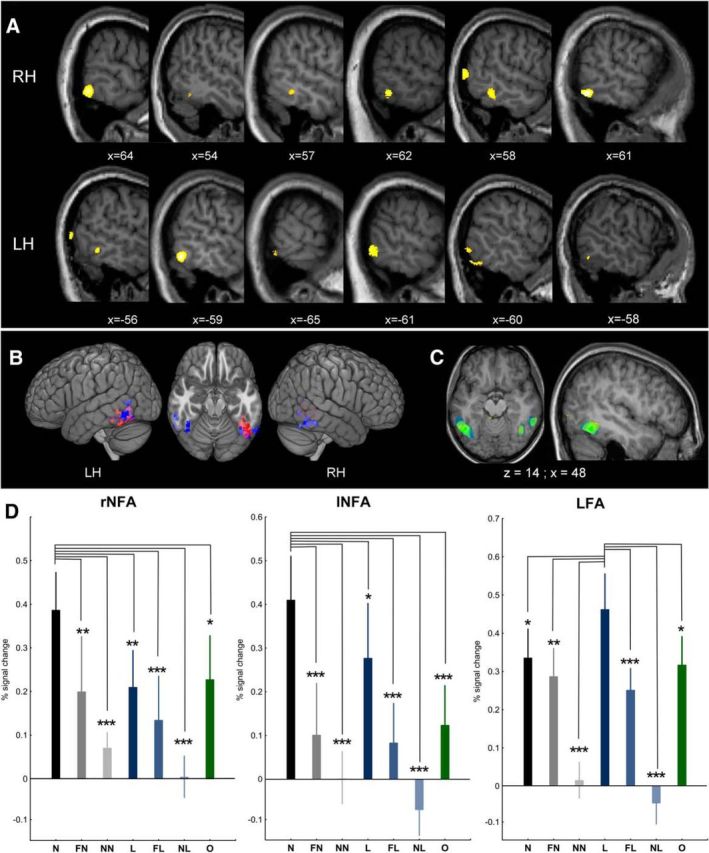
ROI analysis in Experiment 1. A, Examples of the individual subjects' number-selective responses in the left and the right hemisphere. Results are based on the first run (contrasting numbers with all other stimuli, p < 0.001(uncorrected)) and presented on the respective individual brain anatomy. B, All of the individual participants' NFA (blue) and LFA (red) clusters superimposed on each other. Purple marks the overlap of the two areas. Images were created using MRIcroGL (http://www.mccauslandcenter.sc.edu/mricrogl/). C, Comparison of the activations (p < 0.005(uncorrected)) induced when contrasting numbers with all other stimuli between the three experimental runs (first run in blue, second run in yellow, third run in green, overlap in intermediate colors). D, ROI results. The right and left NFA respond stronger to numbers than to all other characters; conversely, the left LFA responds stronger to letters than to all other stimuli. RH, right hemisphere; LH, left hemisphere. *p < 0.05; **p < 0.01; ***p < 0.001 (Fisher LSD).
Experiment 2
Behavioral data
In this experiment, we only presented numbers, letters, and false numbers. We did not observe a main effect of stimulus either on the participants' accuracy (F(2,30) = 2.08, p = 0.14, ηp2 = 0.12) or on their RTs (F(2,30) = 0.73, p = 0.49, ηp2 = 0.05).
ROI analysis
In Experiment 2 (Fig. 4), we could again identify the right and left NFA on an individual participant level by contrasting numbers with all other presented visual stimuli in two experimental runs (p < 0.005(uncorrected)). In the remaining two runs, we only presented numbers, letters, and false numbers to visualize the response selectivity of the NFA for these stimuli in more detail. Crucially, in contrast to Experiment 1, only single-digit numbers were used. Similar to Experiment 1, we found no main effect of hemisphere (F(1,13) = 2.85, p = 0.12, ηp2 = 0.18) and no interaction of hemisphere and stimulus (F(2,26) = 0.11, p = 0.90, ηp2 = 0.008). We again observed a main effect of stimulus (F(2,26) = 7.54, p = 0.003, ηp2 = 0.37) that was based on the fact that responses to numbers were significantly larger than responses to letters and false letters in both the right (N > FN: p = 0.008; N > L: p = 0.007) and the left hemisphere (N > FN: p = 0.006; N > L: p = 0.02). Therefore, Experiment 2 confirmed the number selectivity and the bilateral nature of the visual number form area found in Experiment 1.
Figure 4.

ROI analysis in Experiment 2. The right and left NFA respond stronger to single-digit numbers than to false numbers and letters. *p < 0.05; **p < 0.01; ***p < 0.001 (Fisher LSD).
Experiment 3
Mean BOLD signal within the NFA
Figure 5A depicts the average BOLD signal for the three different sequence conditions globally. Within the NFA, we observed a main effect of sequence (F(2,22) = 49.48, p < 0.0001, ηp2 = 0.82) on the mean BOLD signal, which was driven by the fact that high-resolution images had a higher signal intensity in the NFA compared with lower-resolution images with (p < 0.0001) and without (p < 0.0001) localized shimming (Fig. 6A). The lower-resolution images with and without localized shimming were not significantly different from each other (p = 0.92), suggesting that spatial resolution but not localized shimming influences the BOLD signal intensity. We further found an interaction between sequence and smoothing (F(2,22) = 4.43, p = 0.02, ηp2 = 0.29) because smoothing reduced the mean BOLD signal of the high-resolution images (p = 0.009) but not of the lower-resolution images with (p = 0.93) and without (p = 0.21) localized shimming. Crucially, however, even after smoothing, the high-resolution images showed a higher mean BOLD signal within the NFA than the lower-resolution images with (p < 0.0001) and without (p < 0.0001) localized shimming. No main effect of hemisphere (F(1,11) = 0.99, p = 0.34, ηp2 = 0.08) and no interaction of hemisphere with any other factor was found (p > 0.05 for all comparisons). Overall, these results confirm previous reports (Merboldt et al., 2000; Wadghiri et al., 2001; Bellgowan et al., 2006) suggesting that smaller voxels reduce intravoxel dephasing and thus fMRI signal dropout caused by susceptibility artifacts.
Figure 5.

A, Visualization of the impact of spatial resolution, localized shimming, and smoothing on the global mean BOLD signal intensity and tSNR. The mean BOLD response is increased in the neighborhood of the NFA (approximate NFA location is marked by black circles) by the higher spatial resolution. The tSNR is generally higher with the lower resolution; however, this effect is not as severe near the NFA. Smoothing increases the tSNR, particularly in the high-resolution images, so that, after preprocessing the tSNR near the NFA is largest in the high-resolution images. Images were created using Caret (Van Essen et al., 2001). B, Example of the position of the recorded volume (yellow box) and of the area where the localized shimming was performed (green box).
Figure 6.

Influence of spatial resolution, localized shimming, and smoothing on the mean BOLD signal intensity (A) and tSNR (B) within the NFA. The mean BOLD signal is largest in the high-resolution images. Before smoothing, the tSNR is similar in the high-resolution and the lower-resolution images with and without localized shimming. After spatial smoothing was applied, the tSNR is largest in the high-resolution images. LR, lower resolution (3*3*3 mm3); LRS, lower resolution with localized shimming; HRS, high resolution (1*1*1 mm3) with localized shimming. *p < 0.05; **p < 0.01; ***p < 0.001 (Fisher LSD).
tSNR within the NFA
For the tSNR, we again observed a main effect of sequence (F(2,22) = 14.90, p < 0.0001, ηp2 = 0.58) within the NFA, which expressed the fact that, overall, the high-resolution images had a larger tSNR than the lower-resolution images with (p = 0.0003) and without (p < 0.0001) localized shimming (Fig. 6B; for the global effects of sequence and smoothing on the tSNR, see Fig. 5A). Similar to the mean BOLD signal, the tSNR of the lower-resolution images with and without localized shimming were not significantly different (p = 0.51), suggesting that spatial resolution but not localized shimming influences the tSNR. Further, we found a main effect of smoothing (F(1,11) = 198.58, p < 0.0001, ηp2 = 0.95) because the tSNR was significantly larger in the high-resolution images (p < 0.0001), the lower-resolution images with localized shimming (p < 0.0001), and the lower-resolution images without localized shimming (p < 0.0001) after smoothing was applied. Crucially, we also observed an interaction of sequence and smoothing (F(2,22) = 26.08, p < 0.0001, ηp2 = 0.70). Before spatial smoothing was performed, the tSNR was similar in the high-resolution images and the lower-resolution images with (p = 0.71) and without (p = 0.61) localized shimming. After smoothing, however, the tSNR was significantly larger for the high-resolution images compared with the lower-resolution images with (p < 0.0001) and without (p < 0.0001) localized shimming. Similar to the mean BOLD signal, the tSNR was not different across hemispheres (F(1,11) = 0161, p = 0.23, ηp2 = 0.13) and no interaction of hemisphere with sequence (F(2,22) = 0.17, p = 0.84, ηp2 = 0.02) or with sequence and smoothing (F(2,22) = 0.09, p = 0.91, ηp2 = 0.008) was observed. We did, however, find an interaction between hemisphere and smoothing (F(1,11) = 8.90, p = 0.01, ηp2 = 0.45), suggesting that the beneficial effect of smoothing was particularly pronounced in the left hemisphere, even though smoothing significantly influenced the tSNR in both hemispheres (right hemisphere: p < 0.0001, left hemisphere: p < 0.0001). Overall, these results confirm those previous findings suggesting an improved tSNR when high-resolution images are smoothed to the desired lower spatial resolution relative to direct acquisition of lower-resolution data (Triantafyllou et al., 2006).
Discussion
In the current study, we investigated the processing of visually presented numbers in healthy human subjects. We identified an area in the ITG, which responds stronger to numbers than to false numbers, letters or everyday objects. This area, the NFA, was found at virtually identical coordinates, as indicated in previous patient studies (Shum et al., 2013; Abboud et al., 2015), with the important difference that we found the NFA to be present bilaterally.
Before the current study, the NFA could not be reliably identified in healthy human subjects. This is most probably due to artifacts caused by the air/bone interface of the petrous bone in the neighborhood of the NFA (Shum et al., 2013). To overcome these susceptibly artifacts, we combined the application of a 64-channel head coil with high spatial resolution, localized shimming, parallel imaging, and liberal smoothing at 3 T. All of these factors were designed to increase the signal strength and the tSNR and thereby the detectability of BOLD signal changes. There are three different noise contributions in fMRI which hinder the detection of meaningful signal changes—thermal noise, scanner noise and physiological noise. Signal detectability, as reflected by the tSNR, is proposed to be optimal when thermal/scanner noise is equal to the physiological noise (Bodurka et al., 2007). In our case, the usage of a multichannel head coil increased the signal strength but also the physiological noise contribution (Bodurka et al., 2004; de Zwart et al., 2004; Triantafyllou et al., 2011). Therefore, it allowed us to record images at a high spatial resolution and to use parallel imaging without severe losses in tSNR (Triantafyllou et al., 2006; Triantafyllou et al., 2011). After all, the increased resolution and GRAPPA acceleration are accompanied by an increase in thermal/scanner noise (Triantafyllou et al., 2006), which balances the physiological noise picked up by the multichannel head coil. This high spatial resolution and the parallel imaging were needed to prevent complete magnetization dephasing within single voxels and thus fMRI signal dropout caused by the susceptibility changes (Merboldt et al., 2000; Wadghiri et al., 2001; Bellgowan et al., 2006). To compensate for the increased thermal/scanner noise accompanying higher spatial resolution further, we smoothed our data with a quite liberal Gaussian kernel of 8 mm FWHM. Smoothing was shown to recover the tSNR of high-resolution images to the level of lower-resolution images (Molloy et al., 2014) or even beyond (Triantafyllou et al., 2006). Therefore, by combining all of these factors, we were able to optimize the signal strength and the tSNR, which allowed us to localize the NFA in healthy human subjects using fMRI.
Interestingly, in the current study, the NFA was found in both hemispheres. In contrast, a recent EEG study suggests a right-hemispheric lateralization of visual number processing (Park et al., 2014). It is, however, not clear where in the brain this lateralization originates. In fact, the same group found evidence for lateralized number processing in the right lateral occipital complex, but failed to find number-related activations along the ITG (Park et al., 2012). Further, in an EcoG study, Shum et al. (2013) presented their participants with numbers and various non-numerical stimuli and found number-selective activations in the ITG. However, they had only two patients with left and five patients with right hemispheric implants available and thus focused their analysis on the right hemisphere. Abboud et al. (2015) used an fMRI whole-brain approach and detected numerical task-related activations in congenitally blind participants in the right hemispheric ITG. These investigators also reported activations in the left hemisphere, which, however, did not survive familywise error corrections. There are many reasons that could account for the difference in lateralization observed in this and in the current study. First, Abboud et al. (2015) compensated for the fMRI signal loss described in close proximity to the NFA (Shum et al., 2013) by excluding those voxels with the lowest signal strengths. Therefore, it is possible that too few number-selective voxels remained in the left hemisphere. In contrast, our approach has the advantage that all voxels in the occipitotemporal cortex could be sampled. Nonetheless, it is crucial to point out that the approach of Abboud et al. (2015) is very useful, especially in an environment where high-resolution fMRI, parallel imaging techniques, and/or the shimming technique of the present study are not available. We achieved the necessary high spatial resolution partially by reducing the number of slices and by increasing the time of repetition (TR). The relatively long (2.5 s) TR reduced the temporal resolution of the measurements. Due to the reduced number of slices, we were also unable to cover the entire cerebrum of the participants. In particular, we could not simultaneously sample the intraparietal sulcus (IPS), a region indicated to be involved in numerosity processing (Eger et al., 2003). We accepted this constrain as our main focus of interest was the visual processing of number forms. Future studies should decide carefully which approach to take depending on the question at hand, whereas a combination of the two approaches might be particularly valuable, possibly even for other neuronal regions similarly affected by susceptibility artifacts (e.g., the anterior temporal face patch; Rajimehr et al., 2009).
Other obvious factors that could account for the differences in lateralization between previous work (Abboud et al., 2015) and the current study are the tested participants and the applied task. In the current study, we investigated healthy participants with a simple visual one-back task, Abboud et al. (2015) tested congenitally blind patients with a rather complex numerosity task. It seems plausible that the activations observed in the current study depend on simple bottom-up visual input (because number identification is not actually needed for the task at hand), whereas the study by Abboud et al. (2015) detects task-dependent top-down influences (because visual input is lacking in the patients). The interplay of top-down and bottom-up influences on the NFA will certainly be a fruitful topic for future studies. Interestingly, the presence of a bilateral Arabic number form area was suggested already 20 years ago, and the investigators even proposed the two hemispheres to be specialized for different tasks (Cohen and Dehaene, 1995). This task-dependent laterality for number processing has been supported empirically for the IPS and its connecting prefrontal regions (Chochon et al., 1999). This interaction of task and lateralization certainly deserve further investigation in future studies.
Interestingly, in Experiment 1, we observed a main effect of character type and stimulus type, but no interaction between these factors in the NFA. This suggests that the NFA prefers numbers over letters, but that it also generally prefers real over false characters and Fourier randomized images. The potential reasons behind this surprising preference are manifold. For instance, it is possible that the NFA is generally tuned to objects of expertise. Further, there might be an overlap in the spatial location of the NFA and the LFA, which expresses in overlapping selectivity. Finally, the real letters might simply be more similar to real numbers, and thus the preferred stimulus of the area, than false letters. Although our data clearly show real numbers to be the “optimal” stimulus for the NFA, future studies will be needed to investigate these issues in detail.
It is important to note that numbers (as well as letters and words) gained importance for human life too recently for specialized neuronal regions to be established by evolutionary processes. Rather, it seems that learning during the lifespan of the individual reorganizes the brain to support the processing of these stimuli (Dehaene and Cohen, 2007). Interestingly, in macaque monkeys, intensive early life training induces selective neuronal clusters for learned characters in the temporal lobe as well (Srihasam et al., 2012). These clusters, in turn, were shown to increase the monkeys' performance on a character discrimination task, thereby emphasizing the functional relevance of these acquired character-processing modules. Crucially, neuronal clusters for learned visual stimuli seem to develop in stable locations across subjects. In fact, in a very recent review, Hannagan et al. (2015) propose two constrains that determine the localization of the NFA and the LFA. On the one hand, number and letter form processing is dependent on invariant shape discrimination, a task fulfilled by the inferior temporal cortex (Sáry et al., 1993). On the other hand, these regions depend on different functional connectivities; that is, the LFA needs to be connected to other regions supporting reading, whereas the NFA should rather be connected to regions involved in representing quantities. These two constraints likely complement each other and thus explain the consistent localization of number form and letter form processing regions.
In summary, the current study demonstrates the existence of a bilateral visual number form area in healthy human adults. Further investigations into the neural representations of numbers and other newly acquired stimulus categories will greatly advance our understanding of learning-induced changes in the brain.
Footnotes
This work was supported by the Deutsche Forschungsgemeinschaft (Grant KO 3918/1-2 and 2-2).
References
- Abboud S, Maidenbaum S, Dehaene S, Amedi A. A number-form area in the blind. Nat Commun. 2015;6:6026. doi: 10.1038/ncomms7026. [DOI] [PMC free article] [PubMed] [Google Scholar]
- Bellgowan PS, Bandettini PA, van Gelderen P, Martin A, Bodurka J. Improved BOLD detection in the medial temporal region using parallel imaging and voxel volume reduction. Neuroimage. 2006;29:1244–1251. doi: 10.1016/j.neuroimage.2005.08.042. [DOI] [PubMed] [Google Scholar]
- Bodurka J, Ledden PJ, van Gelderen P, Chu R, de Zwart JA, Morris D, Duyn JH. Scalable multichannel MRI data acquisition system. Magn Reson Med. 2004;51:165–171. doi: 10.1002/mrm.10693. [DOI] [PubMed] [Google Scholar]
- Bodurka J, Ye F, Petridou N, Murphy K, Bandettini PA. Mapping the MRI voxel volume in which thermal noise matches physiological noise–implications for fMRI. Neuroimage. 2007;34:542–549. doi: 10.1016/j.neuroimage.2006.09.039. [DOI] [PMC free article] [PubMed] [Google Scholar]
- Brett M, Johnsrude IS, Owen AM. The problem of functional localization in the human brain. Nat Rev Neurosci. 2002;3:243–249. doi: 10.1038/nrn756. [DOI] [PubMed] [Google Scholar]
- Brodeur MB, Dionne-Dostie E, Montreuil T, Lepage M. The Bank of Standardized Stimuli (BOSS), a new set of 480 normative photos of objects to be used as visual stimuli in cognitive research. PLoS One. 2010;5:e10773. doi: 10.1371/journal.pone.0010773. [DOI] [PMC free article] [PubMed] [Google Scholar]
- Chochon F, Cohen L, van de Moortele PF, Dehaene S. Differential contributions of the left and right inferior parietal lobules to number processing. J Cogn Neurosci. 1999;11:617–630. doi: 10.1162/089892999563689. [DOI] [PubMed] [Google Scholar]
- Cohen L, Dehaene S. Number processing in pure alexia: The effect of hemispheric asymmetries and task demands. Neurocase. 1995;1:121–137. doi: 10.1080/13554799508402356. [DOI] [Google Scholar]
- Cohen L, Dehaene S, Naccache L, Lehéricy S, Dehaene-Lambertz G, Hénaff MA, Michel F. The visual word form area: spatial and temporal characterization of an initial stage of reading in normal subjects and posterior split-brain patients. Brain. 2000;123:291–307. doi: 10.1093/brain/123.2.291. [DOI] [PubMed] [Google Scholar]
- Cziraki C, Greenlee MW, Kovács G. Neural correlates of high-level adaptation-related aftereffects. J Neurophysiol. 2010;103:1410–1417. doi: 10.1152/jn.00582.2009. [DOI] [PubMed] [Google Scholar]
- Dehaene S, Cohen L. Towards an anatomical and functional model of number processing. Mathematical Cognition. 1995;1:83–120. [Google Scholar]
- Dehaene S, Cohen L. Cultural recycling of cortical maps. Neuron. 2007;56:384–398. doi: 10.1016/j.neuron.2007.10.004. [DOI] [PubMed] [Google Scholar]
- Dehaene S, Cohen L. The unique role of the visual word form area in reading. Trends Cogn Sci. 2011;15:254–262. doi: 10.1016/j.tics.2011.04.003. [DOI] [PubMed] [Google Scholar]
- Dehaene S, Pegado F, Braga LW, Ventura P, Nunes Filho G, Jobert A, Dehaene-Lambertz G, Kolinsky R, Morais J, Cohen L. How learning to read changes the cortical networks for vision and language. Science. 2010;330:1359–1364. doi: 10.1126/science.1194140. [DOI] [PubMed] [Google Scholar]
- de Zwart JA, Ledden PJ, van Gelderen P, Bodurka J, Chu R, Duyn JH. Signal-to-noise ratio and parallel imaging performance of a 16-channel receive-only brain coil array at 3.0 Tesla. Magn Reson Med. 2004;51:22–26. doi: 10.1002/mrm.10678. [DOI] [PubMed] [Google Scholar]
- Eger E, Sterzer P, Russ MO, Giraud AL, Kleinschmidt A. A supramodal number representation in human intraparietal cortex. Neuron. 2003;37:719–725. doi: 10.1016/S0896-6273(03)00036-9. [DOI] [PubMed] [Google Scholar]
- Grill-Spector K, Kushnir T, Edelman S, Avidan G, Itzchak Y, Malach R. Differential processing of objects under various viewing conditions in the human lateral occipital complex. Neuron. 1999;24:187–203. doi: 10.1016/S0896-6273(00)80832-6. [DOI] [PubMed] [Google Scholar]
- Griswold MA, Jakob PM, Heidemann RM, Nittka M, Jellus V, Wang J, Kiefer B, Haase A. Generalized autocalibrating partially parallel acquisitions (GRAPPA) Magnetic Resonance in Medicine. 2002;47:1202–1210. doi: 10.1002/mrm.10171. [DOI] [PubMed] [Google Scholar]
- Grotheer M, Kovács G. Repetition probability effects depend on prior experiences. J Neurosci. 2014;34:6640–6646. doi: 10.1523/JNEUROSCI.5326-13.2014. [DOI] [PMC free article] [PubMed] [Google Scholar]
- Hannagan T, Amedi A, Cohen L, Dehaene-Lambertz G, Dehaene S. Origins of the specialization for letters and numbers in ventral occipitotemporal cortex. Trends Cogn Sci. 2015;19:374–382. doi: 10.1016/j.tics.2015.05.006. [DOI] [PubMed] [Google Scholar]
- Kriegeskorte N, Simmons WK, Bellgowan PS, Baker CI. Circular analysis in systems neuroscience: the dangers of double dipping. Nat Neurosci. 2009;12:535–540. doi: 10.1038/nn.2303. [DOI] [PMC free article] [PubMed] [Google Scholar]
- Merboldt KD, Finsterbusch J, Frahm J. Reducing inhomogeneity artifacts in fMRI of human brain activation–thin sections vs gradient compensation. Journal of Magnetic Resonance. 2000;145:184–191. doi: 10.1006/jmre.2000.2105. [DOI] [PubMed] [Google Scholar]
- Mikl M, Marecek R, Hlustík P, Pavlicová M, Drastich A, Chlebus P, Brázdil M, Krupa P. Effects of spatial smoothing on fMRI group inferences. Magnetic Resonance Imaging. 2008;26:490–503. doi: 10.1016/j.mri.2007.08.006. [DOI] [PubMed] [Google Scholar]
- Molloy EK, Meyerand ME, Birn RM. The influence of spatial resolution and smoothing on the detectability of resting-state and task fMRI. Neuroimage. 2014;86:221–230. doi: 10.1016/j.neuroimage.2013.09.001. [DOI] [PMC free article] [PubMed] [Google Scholar]
- Murphy K, Bodurka J, Bandettini PA. How long to scan? The relationship between fMRI temporal signal to noise ratio and necessary scan duration. Neuroimage. 2007;34:565–574. doi: 10.1016/j.neuroimage.2006.09.032. [DOI] [PMC free article] [PubMed] [Google Scholar]
- Ollinger JM, Corbetta M, Shulman GL. Separating processes within a trial in event-related fMRI. Neuroimage. 2001;13:218–229. doi: 10.1006/nimg.2000.0711. [DOI] [PubMed] [Google Scholar]
- Park J, Hebrank A, Polk TA, Park DC. Neural dissociation of number from letter recognition and its relationship to parietal numerical processing. J Cogn Neurosci. 2012;24:39–50. doi: 10.1162/jocn_a_00085. [DOI] [PMC free article] [PubMed] [Google Scholar]
- Park J, Chiang C, Brannon EM, Woldorff MG. Experience-dependent hemispheric specialization of letters and numbers is revealed in early visual processing. J Cogn Neurosci. 2014;26:2239–2249. doi: 10.1162/jocn_a_00621. [DOI] [PMC free article] [PubMed] [Google Scholar]
- Polk TA, Stallcup M, Aguirre GK, Alsop DC, D'Esposito M, Detre JA, Farah MJ. Neural specialization for letter recognition. J Cogn Neurosci. 2002;14:145–159. doi: 10.1162/089892902317236803. [DOI] [PubMed] [Google Scholar]
- Rajimehr R, Young JC, Tootell RB. An anterior temporal face patch in human cortex, predicted by macaque maps. Proc Natl Acad Sci U S A. 2009;106:1995–2000. doi: 10.1073/pnas.0807304106. [DOI] [PMC free article] [PubMed] [Google Scholar]
- Robinson S, Windischberger C, Rauscher A, Moser E. Optimized 3 T EPI of the amygdalae. Neuroimage. 2004;22:203–210. doi: 10.1016/j.neuroimage.2003.12.048. [DOI] [PubMed] [Google Scholar]
- Sáry G, Vogels R, Orban GA. Cue-invariant shape selectivity of macaque inferior temporal neurons. Science. 1993;260:995–997. doi: 10.1126/science.8493538. [DOI] [PubMed] [Google Scholar]
- Shum J, Hermes D, Foster BL, Dastjerdi M, Rangarajan V, Winawer J, Miller KJ, Parvizi J. A brain area for visual numerals. J Neurosci. 2013;33:6709–6715. doi: 10.1523/JNEUROSCI.4558-12.2013. [DOI] [PMC free article] [PubMed] [Google Scholar]
- Srihasam K, Mandeville JB, Morocz IA, Sullivan KJ, Livingstone MS. Behavioral and anatomical consequences of early versus late symbol training in macaques. Neuron. 2012;73:608–619. doi: 10.1016/j.neuron.2011.12.022. [DOI] [PMC free article] [PubMed] [Google Scholar]
- Thesen T, McDonald CR, Carlson C, Doyle W, Cash S, Sherfey J, Felsovalyi O, Girard H, Barr W, Devinsky O, Kuzniecky R, Halgren E. Sequential then interactive processing of letters and words in the left fusiform gyrus. Nat Commun. 2012;3:1284. doi: 10.1038/ncomms2220. [DOI] [PMC free article] [PubMed] [Google Scholar]
- Triantafyllou C, Hoge RD, Wald LL. Effect of spatial smoothing on physiological noise in high-resolution fMRI. Neuroimage. 2006;32:551–557. doi: 10.1016/j.neuroimage.2006.04.182. [DOI] [PubMed] [Google Scholar]
- Triantafyllou C, Polimeni JR, Wald LL. Physiological noise and signal-to-noise ratio in fMRI with multi-channel array coils. Neuroimage. 2011;55:597–606. doi: 10.1016/j.neuroimage.2010.11.084. [DOI] [PMC free article] [PubMed] [Google Scholar]
- Van Essen DC, Drury HA, Dickson J, Harwell J, Hanlon D, Anderson CH. An integrated software suite for surface-based analyses of cerebral cortex. Journal of the American Medical Informatics Association. 2001;8:443–459. doi: 10.1136/jamia.2001.0080443. [DOI] [PMC free article] [PubMed] [Google Scholar]
- Wadghiri YZ, Johnson G, Turnbull DH. Sensitivity and performance time in MRI dephasing artifact reduction methods. Magnetic Resonance in Medicine. 2001;45:470–476. doi: 10.1002/1522-2594(200103)45:3<470::AID-MRM1062>3.0.CO;2-E. [DOI] [PubMed] [Google Scholar]