

Abstract
Acute cerebral ischemia and chronic neurovascular diseases share various common mechanisms with neurodegenerative diseases, such as disturbed cellular calcium and energy homeostasis and accumulation of toxic metabolites. A link between these conditions may be constituted by amyloid precursor protein (APP), which plays a pivotal role in the pathogenesis of Alzheimer′s disease, but has also been associated with the response to acute hypoxia and regulation of calcium homeostasis. We therefore studied hypoxia-induced loss of function and recovery upon reoxygenation in hippocampal slices of mice lacking APP (APP−/−) or selectively expressing its soluble extracellular domain (APPsα-KI). Transient hypoxia disrupted electrical activity at the network and cellular level. In mice lacking APP, these impairments were significantly more severe, showing increased rise of intracellular calcium, faster loss of function, and higher incidence of spreading depression. Likewise, functional recovery upon reoxygenation was much slower and less complete than in controls. Most of these deficits were rescued by selective expression of the soluble extracellular fragment APPsα, or by pharmacological block of L-type calcium channels. We conclude that APP supports neuronal resistance toward acute hypoxia. This effect is mediated by the secreted APPsα-domain and involves L-type calcium channels.
SIGNIFICANCE STATEMENT Amyloid precursor protein (APP) is involved in the pathophysiology of Alzheimer's disease, but its normal function in the brain remains elusive. Here, we describe a neuroprotective role of the protein in acute hypoxia. Functional recovery of mouse hippocampal networks after transient reduction of oxygen supply was strongly impaired in animals lacking APP. Most protective effects are mediated by the soluble extracellular fragment APPsα and involve L-type calcium channels. Thus, APP contributes to calcium homeostasis in situations of metabolic stress. This finding may shed light on the physiological function of APP and may be important for understanding mechanisms of neurodegenerative diseases.
Keywords: APP, hippocampus, hypoxia, L-type calcium channels, neuroprotection, nifedipine
Introduction
The mammalian hippocampus is a pivotal brain region for spatial and declarative memory formation (Burgess et al., 2002). It is among the first brain areas affected by Alzheimer's disease (AD) (Price et al., 2001) and is highly vulnerable to hypoxic insults (Schmidt-Kastner and Freund, 1991). Interestingly, patients who suffered hypoxic-ischemic brain injury have an increased risk of developing AD decades later in life (Zhang and Le, 2010). As a common mechanism, excessive intracellular calcium mediates both ischemia-induced neuronal death and neurodegeneration in AD (Berridge, 2010).
At the molecular level, multiple lines of evidence indicate a crucial role for the amyloid precursor protein (APP) in the pathogenesis of AD (O'Brien and Wong, 2011). The physiological function of this protein, however, is still poorly understood (Aydin et al., 2012). APP-deficient mice are largely healthy but show distinct cognitive deficits and altered synaptic plasticity in the hippocampus (Ring et al., 2007). Several lines of evidence suggest a neuroprotective role of APP in cellular stress response and aging (Kögel et al., 2012). Intracellular levels of APP rise under conditions of energy depletion (Hoyer et al., 2005), and the protein is upregulated following brain injury (Van den Heuvel et al., 1999). Moreover, APP-deficient mice show increased acute mortality following cerebral ischemia (Koike et al., 2012), whereas APP overexpression provides neuroprotection (Clarke et al., 2007). The soluble extracellular fragment APPsα, generated by α-secretase-mediated cleavage of APP, was shown to mediate protective effects in ischemic (Smith-Swintosky et al., 1994) and traumatic brain injury models (Thornton et al., 2006) and AD models in vivo (Fol et al., 2016), and to protect against hypoxic, hypoglycemic, and excitotoxic damage in vitro (Mattson et al., 1993; Milosch et al., 2014).
Although these data point toward some neuroprotective function of APP, the underlying mechanisms at the molecular, cellular, and network level remain unknown. Importantly, it is not clear whether this ubiquitously expressed protein exerts its protective effects via the vascular system or by direct interaction with neuronal functions (e.g., hypoxia-induced intracellular calcium increase). Also, the relative contribution of full-length APP versus its cleavage products remains debated. Most previous studies have focused on cell death, whereas the immediate impact of APP on cellular and network-level functions during metabolic stress is largely unknown. We therefore studied neuronal and network function of hippocampal networks in a model of transient hypoxia in vitro (Schurr et al., 1999), where cerebrovascular and other systemic factors are excluded. We report that functional recovery after transient hypoxia is strongly impaired in APP−/− mice, indicating a direct neuroprotective role for APP in healthy brain tissue. This protective effect involves the soluble extracellular fragment of the protein (APPsα) and reduction of calcium influx through L-type calcium channels. Our data shed light onto the enigmatic function of APP and constitute a new link between memory-related network activity, hypoxia, and neuronal calcium dynamics.
Materials and Methods
Animal handling and slice preparation.
Procedures were in accordance with the German animal protection law and were approved by the state government of Baden-Wurttemberg (T-08/10). Wild-type (WT), APP−/−, and APPsα-KI mice of both sexes at an age of 33–66 weeks were used for experiments. APP−/− and APPsα-KI mice were backcrossed at least six times onto a C57BL6 background. WT littermates were obtained from the last backcross of APP-KO mice. At this age, APP−/− mice show deficits in long-term potentiation (Ring et al., 2007). Generation of APP−/− and APPsα-KI mice was described previously (Li et al., 1996; Ring et al., 2007). Mice were anesthetized with CO2 (60%), decapitated, and the brain was quickly transferred into cooled ACSF (1°C–4°C; saturated with 95% O2/5% CO2 [carbogen]). Composition of ACSF was (in mm) as follows: 124 NaCl, 3.0 KCl, 1.8 MgSO4, 1.6 CaCl2, 10 glucose, 1.25 NaH2PO4, and 26 NaHCO3, pH 7.4. Horizontal slices of 450 μm thickness from the mid to ventral portion of the hippocampus were cut on a Leica VT1000s or Leica V1200s vibratome (Leica Microsystems). Slices were maintained at 32°C–33°C in a modified Haas-type interface chamber for 3–4 h before starting recordings and were perfused with carbogen-saturated ACSF at 1.5–2 ml/min. In electrophysiological experiments, the duration of hypoxia was 5 min. For this period, gas supply was switched from carbogen to 95% N2/5% CO2. This hypoxic period was followed by a 40 min recovery with carbogen. Mouse tales were kept at −20°C and used for genotyping. All assessed genotypes matched the putative genotype.
Local field potential (LFP) recordings.
LFPs were recorded with ACSF-filled borosilicate glass electrodes (Hilgenberg, tip diameter ∼9 μm) from the CA3 pyramidal cell layer (CA3p), CA1 pyramidal and dendritic cell layers (CA1p and CA1r, respectively). The Schaffer collateral was stimulated with 100 μs electrical pulses using a bipolar platinum/iridium stimulation electrode (Science Products). Electrode position was optimized for maximal population spike (PSs) at CA1p, and for a field EPSP (fEPSP) with as little contamination by the PS as possible at CA1r. Slices with insufficient sharp wave-ripple activity (frequency <1 Hz), PS amplitude <2 mV, multiple PS responses to stimulation, variation in PS amplitude > 20% or continuously decreasing/increasing amplitude during baseline recording were discarded. There was no difference between genotypes in the incidence of insufficient baseline spontaneous activity or evoked responses. For monitoring effects of hypoxia, stimulation strength was adjusted to 50% of the maximum PS. During baseline and recovery, PS were elicited every 60 s, whereas during the hypoxic period we stimulated every 30 s for higher temporal resolution. We also assessed paired pulse ratios with interspike intervals (ISIs) of 10, 50, and 280 ms. The maximal PS amplitude was measured during baseline conditions and after 40 min of recovery from hypoxia.
Intracellular recordings.
Intracellular recordings from CA1 pyramidal cells were performed using 60–110 mΩ borosilicate glass electrodes (Science Products) filled with 2 m potassium acetate and 1,5% neurobiotine (Vector Laboratories). Following a stabilization period of 10 min current-free recording, the cell was characterized by 500-ms-long current injections starting at −400 pA and increasing in steps of 100 pA up to a current, which elicited a train of action potentials (APs). Only cells with a stable resting membrane potential, overshooting APs, stable AP amplitude, firing adaptation, AP waveforms with width >600 μs, and low after-hyperpolarization (AHP) were classified as putative CA1 pyramidal neurons suitable for recording (Bähner et al., 2011). Notably, for intracellular recordings, more APP−/− than WT cells had to be screened to find a “healthy” neuron according to these criteria, such that we cannot exclude a slight selection bias masking more severe deficits of APP−/− cells. Morphology and location of some of the recorded cells were evaluated using neurobiotine staining. All stained cells were located in CA1p and classified as pyramidal cells by microscopy. Input resistance and membrane time constant were calculated by 10 current pulses of −200 pA (duration 500 ms, frequency 0.2 Hz) under baseline conditions. Test pulses were repeated every 30 s during the time course of the experiment. AP properties were assessed by positive current injections. After 20 min of recovery following hypoxia, AP trains were elicited once again by positive current injection. Bridge balance was repeatedly adjusted during the experiment. Offset potentials were determined at the end of the experiment and subtracted from the recorded values.
Drugs.
Drugs were applied into the bath solution 30 min before hypoxia induction. Experiments were continued if slices reached a steady state after drug application and aborted following spreading depression. Nifedipine (Sigma-Aldrich), and Bay K8644 (Tocris Bioscience) were aliquoted in DMSO (final concentration of 0.1%) at 10 mm and stored at 4°C before final dilution in ACSF. All steps of the preparation, storage, and experiment were performed under light-protected conditions due to photosensitivity of the drugs. Similarly, APV (Tocris Bioscience) was stored in 60 mm aliquots at −20°C before final dilution.
Data acquisition and analysis.
LFP signals were amplified 100× (EXT 10–2F differential amplifier, NPI Electronic), low-pass filtered at 10 kHz, DC-filtered, and digitized at 20 kHz for off-line analysis (1401 interface and Spike-2 data acquisition program; CED). Intracellular recordings were performed using an Axoclamp 900A amplifier (Molecular Devices). Sharp waves were detected in CA1p and CA3p and analyzed using custom-written MATLAB routines (Bähner et al., 2011). After automatized analysis, results underwent manual control.
Population spike amplitude was measured as the difference between the maximal negative peak (spike) and the mean of the positive peaks before and after the spike. fEPSP slope was calculated as the minimum first derivative of the evoked voltage response in CA1r and multiplied with −1.
Intracellular data were analyzed using custom-written MATLAB routines. AP properties were calculated from current-evoked APs and analyzed as described by Bähner et al. (2011), with small alterations. The input resistance of cells was calculated from the difference between the median membrane potential at 100–450 ms of the 500-ms-long, −200 pA current injections and the resting median membrane potential before the current injection according to Ohm's law. All values were manually controlled for stimulation artifacts and spontaneous synaptic events.
Calcium imaging.
For calcium measurements, the CA1 region was loaded with 1.5 mm Oregon Green BAPTA 1-AM (OGB-1-AM, Invitrogen) dye by multicell bolus pressure loading into the pyramidal layer of CA1 (Garaschuk et al., 2006). OGB-1 was dissolved in Pluronic F-127 (20% solution in DMSO, Invitrogen) and diluted in Ca2+-free Ringer's solution (in mm as follows: 150 NaCl, 2.5 KCl, 10 HEPES). Dye solution was pressure-injected into the pyramidal layer of CA1 for ∼5 min, using a patch electrode (borosilicate glass, ∼3 μm tip diameter). Calcium imaging was started following 60 min incubation time after dye loading. During the loading process and imaging procedure, hippocampal network activity was monitored by field potential recordings. Images of a large field of view (410 × 410 μm) were collected using a custom-built fluorescence microscope with a CSU-X1 Nipkow-type spinning-disk (1800 rpm, Yokogawa) and sampled through a dry objective with long working distance (Olympus LM Plan FL N, 20 ×, 0.4 NA) by an electron-multiplying charge-coupled device (EMCCD) camera (Image EM C9100–13, Hamamatsu) at 31.9 Hz. The combination of this type of microscope and the use of a Haas-type interface chamber enabled stable recording conditions over time (Reichinnek et al., 2010; Pfeiffer et al., 2014). OGB-1-AM was excited by 489 nm light generated by a laser (TopticaiBeam Smart). A dichroic mirror (486–491 nm, Yokogawa) and an emission filter (525 ± 18 nm, Chroma) allowed separation between excitation and emission light. Imaging was performed under hypoxia until spreading depression occurred. The data were analyzed using ImageJ plug-ins (National Institutes of Health) and custom-written MATLAB routines (The MathWorks). We defined a region of interest (ROI) of 40 × 40 μm in the CA1 pyramidal cell layer and obtained the average pixel intensity per image across each image sequence. Baseline fluorescence intensity was subtracted, and intensity values were calculated as percentage change from baseline conditions. Baseline was defined as average values from 60 s of continuous imaging time before induction of hypoxia. Significance of differences was tested by Wilcoxon's signed-rank test.
Histology.
Slices were fixed at different time points after the experiment (see Results) using 4% PFA for 24–48 h on a shaker at 4°C. They were then incubated in a 30% sucrose solution and cut into sections of 25 μm thickness on a cryotome (Leica CM1850, Leica Biosystems) at −20°C. For analysis, we chose 6–8 slices from the middle portion of the specimen to exclude effects of the cutting procedure and of hypoxia at the surface/bottom of the original slice (Kann, 2011; Huchzermeyer et al., 2013). After cutting, slices were stored in a solution of v/v 31% ethylene glycol, 29% glycerin in PBS at −20°C. Stainings were performed after blocking background fluorescence with 0.3 m glycine for 1 h. Before application of the primary antibodies (monoclonal mouse anti-NeuN, 1:500, mouse anti-parvalbumin, 1:500, both from EMD Millipore; and polyclonal rabbit anti-annexin V, 1:250, from Abcam), the sections were washed in PBS and treated with 10% normal goat serum/0.3% Triton X-100. Incubation with primary antibodies was continued for 36 h at 4°C under light protection. Before application of the secondary antibodies (Alexa-488 donkey anti-mouse, 1:500, from Invitrogen; and Cy3 goat anti-rabbit, 1:500, from Jackson ImmunoResearch Laboratories), the sections were washed in PBS and treated with 0.2% bovine albumin/0.3% Triton X-100. Incubation with secondary antibodies was continued for 12 h at 4°C under light protection. For nuclear staining, sections were mounted with Fluoroshield (Sigma-Aldrich), containing DAPI. Widefield fluorescent microscopy was performed on a BX-61 system (Olympus), equipped with a 2-axis computer-controlled stepping motor system (MicroBrightField), a mercury burner U-RFL-T (Olympus), a CCD camera F-View II (Olympus Soft Imaging Solutions), and a set of Olympus Uplan FI 49/NA 0.13, 109/NA 0.30, 209/NA 0.50, and 409/NA 0.75 objective lenses. In a custom-written MATLAB routine, a ROI was selected in the proximal CA1p. The experimenter was presented with 20 random, automatically detected nuclei from the ROI per section. For detection of the nuclei from the DAPI signal, a thresholding algorithm was applied (Smith et al., 1979). Then, cross-sectional areas of 20 randomly selected nuclei from the ROI were assessed by manually applying a circular fit to each nucleus' borders. Cells were evaluated for NeuN and annexin V stainings, respectively, and proportions of NeuN− and annexin+ cells in the section were calculated. The mean value for each recorded slice was calculated from the median values of 20 nuclei in each of the 6–8 sections generated from this slice. During image acquisition and analysis, the experimenter was blinded toward experimental condition and genotype.
Statistics.
Comparisons between the three genotypes were performed using one-way ANOVA with post hoc Tukey's Multiple Comparison Test used in case of p < 0.05 in ANOVA. Comparisons between two groups (e.g., untreated slices vs drug-treated slices) were performed using the two-sided Mann–Whitney U Test. To test for differences between two conditions within one group (e.g., baseline vs recovery), the Wilcoxon test for paired samples was applied. In these cases, data are presented as mean ± SEM. For group comparisons, data are given as number of slices in different genotypes and number of mice from each genotype (e.g., n = a/b slices from c/d WT and APP−/− mice, respectively). Probabilities of spreading depression were compared using the χ2 test for comparison of two proportions and Tukey's multiple comparison of proportions for more than two proportions. These data are presented as mean probability ± Clopper–Pearson CIs. Linear correlations were analyzed using the least-squares linear regression and Pearson's linear correlation coefficient. Values after hypoxia were normalized by dividing through baseline values.
Results
APP−/− slices show severely impaired excitability in CA1 after hypoxia
Synaptic transmission between CA3 and CA1 was tested by stimulating the Schaffer collaterals in 44 slices from 14 wild-type mice (WT), 46 slices from 18 animals lacking APP (APP−/−), and 11 slices from 4 mice expressing only the extracellular fragment of APP (APPsα-KI). Waveform and amplitude of fEPSP and PSs were largely identical between all groups (Fig. 1A,B). We then withdrew oxygen supply for 5 min. Transient hypoxia rapidly suppressed PS (Fig. 1C) and fEPSPs (Fig. 1F) in all three genotypes. In some slices, a hypoxia-induced spreading depression (HSD) (Somjen, 2001) occurred under these conditions (see below). Although the acute effects of hypoxia were largely similar, recovery upon reoxygenation revealed striking differences between genotypes. In WT slices, amplitudes of PS, and slopes of fEPSPs recovered within ∼15–20 min, followed by a potentiation of responses to ∼125 ± 11% of baseline values (mean ± SEM, n = 13 slices from 7 mice). In contrast, slices from APP−/− mice expressed a lasting deficit in recovery of PS (Fig. 1C,D), which remained at ∼57 ± 9% of baseline after ∼20 min of reoxygenation (n = 21 slices from 9 mice; p = 0.00007, one-way ANOVA). After 40 min of recovery, the maximum PS amplitude was assessed (Fig. 1E). Maximum PS in WT slices regained ∼99 ± 6% of baseline values, whereas APP−/− slices showed an incomplete recovery with ∼71 ± 6% of baseline (p = 0.0042, one-way ANOVA). Slopes of fEPSPs recovered fully and similarly in both genotypes (128 ± 13% in wild-type [n = 7 slices from 5 mice] vs 98 ± 11% in APP−/− [n = 9 slices from 6 mice]; Fig. 1F,G). PS in slices from APPsα-KI mice recovered almost to baseline levels (97 ± 13%, n = 11 slices from 4 mice). Thus, intrinsic neuronal excitability remained impaired in tissue lacking APP despite normal synaptic excitation. Accordingly, excitation-spike-coupling (E/S coupling) remained decreased in APP−/− slices (Fig. 1H).
Figure 1.
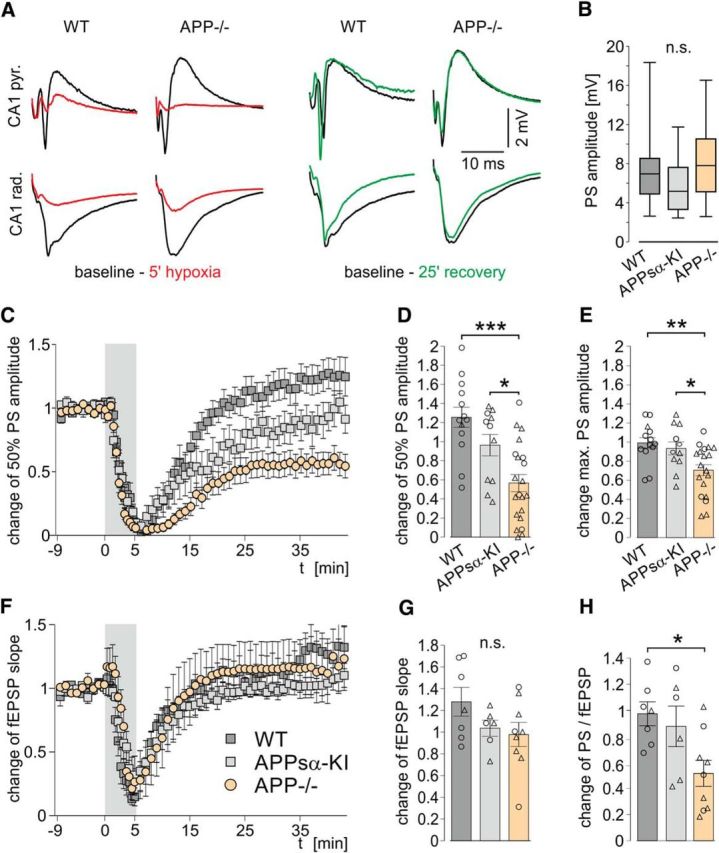
Unaltered baseline evoked responses but severely impaired excitability after hypoxia in slices from APP−/− mice compared with WT and APPsα-KI. A, Representative traces of evoked responses in the CA1 pyramidal (top row) and dendritic (bottom row) cell layers in WT and APP−/− slices during baseline (black), hypoxia (red), and after recovery (green). B, Baseline maximum PS amplitude. C, F, Change of PS amplitude (C) and the fEPSP slope (F) in the time course of the experiment. Gray area represents the period of hypoxia. Values are mean ± SEM. D, Recovery of the half-maximum PS amplitude 30–40 min after hypoxia. p = 0.00007 (one-way ANOVA). E, Recovery of the maximum PS amplitude 40 min after hypoxia. p = 0.0042 (one-way ANOVA). G, Recovery of the fEPSP after hypoxia. p = 0.16 (one-way ANOVA). H, Change of E/S coupling (PS/fEPSP) after hypoxia. p = 0.0183 (one-way ANOVA). D, E, G, H, Circles represent single experiments without HSD. Triangles represent experiments where HSD occurred. *p < 0.05 (one-way ANOVA with post hoc Tukey's Multiple Comparison Test). **p < 0.01 (one-way ANOVA with post hoc Tukey's Multiple Comparison Test). ***p < 0.001 (one-way ANOVA with post hoc Tukey's Multiple Comparison Test). n.s., Not significant. Baseline PS: n = 44/46/11 slices from 14/18/4 WT, APP−/−, and APPsα-KI mice, respectively. Recovery of PS: n = 13/21/11 slices from 7/9/4 WT, APP−/− and APPsα-KI mice, respectively. Recovery of fEPSP and E/S coupling: n = 7/9/6 slices from 5/6/3 WT, APP−/−, and APPsα-KI mice, respectively.
Block of L-type calcium channels, but not NMDA receptors, restores posthypoxic deficits in APP−/− mice
Hypoxia causes strong increases of intracellular calcium concentration in neurons (Lobner and Lipton, 1993). Major sources of calcium influx from the extracellular space are L-type voltage-gated calcium channels (LTCCs) and NMDA receptors. Both channels have successfully been targeted to alleviate neuronal damage after hypoxia (Zhang et al., 2002). APP has been reported to interact with both LTCC (Yang et al., 2009) and NMDA receptors (Cousins et al., 2009). We therefore repeated the experiments in presence of specific blockers of these channels. Indeed, application of the LTCC-blocker nifedipine (10 μm) before and during hypoxia abolished the difference between slices from WT and APP−/− mice. Population spikes recovered to 113 ± 5% and 106 ± 15% of baseline in WT and APP−/− mice, respectively (n = 10/12 slices from 3/5 mice, respectively; p = 0.77, two-sided Mann–Whitney U Test; Fig. 2A,B). In contrast, the NMDA receptor blocker APV (60 μm) had no effect on the delayed recovery of APP−/− slices. Similar to drug-free ACSF, PS amplitude remained decreased after transient hypoxia (p = 0.0077, two-sided Mann–Whitney U Test), whereas fEPSP recovered fully (Fig. 2C,D). Thus, calcium influx through voltage-gated calcium channels is a key mechanism underlying the increased hypoxia sensitivity of APP−/− tissue. Increasing basal activity of L-type calcium channels with BayK8644 (4 μm) caused no difference in PS recovery (114 ± 15% of baseline) or HSD probability (HSD in 1/7 slices) in WT. Application of DMSO (0.1%) alone, applied in 8 slices from 3 APP−/− mice, had no influence on the recovery of PS (60 ± 19% of baseline) or on HSD occurrence (HSD in 6/8 slices), thus ruling out a protective effect of the solvent in our experiments. None of the drugs exerted any relevant effect on evoked responses under normal oxygenation conditions (data not shown).
Figure 2.

L-type calcium channel blocker nifedipine (10 μm), but not NMDA receptor blocker APV (60 μm), rescues PS recovery in APP−/− slices. A, C, Time courses of PS amplitude in nifedipine-treated (A) and APV-treated (C) slices, respectively. B, D, Recovery of evoked responses 30–40 min after hypoxia in presence of nifedipine (B) and APV (D), respectively. Left, PS amplitude. Middle, fEPSP slope. Right, E/S coupling. Circles represent single experiments without HSD. Triangles represent experiments where HSD occurred. *p = 0.0401 (two-sided Mann–Whitney U Test). **p = 0.0077 (two-sided Mann–Whitney U Test). Nifedipine experiments: n = 10/12 slices from 3/5 WT and APP−/− mice, respectively. APV experiments: n = 11/13 slices from 4/4 WT and APP−/− mice, respectively. n.s., Not significant.
Increased short-term facilitation in APP−/− tissue following hypoxia
We assessed short-term plasticity by paired pulse stimulation at intervals (ISI) of 10, 50, and 280 ms and found no major differences between genotypes, with most slices showing 1.2- to 1.5-fold facilitation of the second response at ISI of 50 ms (Fig. 3A,C). Following hypoxia, however, APP−/− slices showed a significantly increased paired-pulse facilitation of PS at ISI of 50 ms compared with WT (Fig. 3B; n = 13/21 slices from 7/9 WT and APP−/− mice, respectively; p = 0.014, Mann–Whitney U Test), with unaltered short-term plasticity of fEPSPs (Fig. 3D). At ISI of 10 and 280 ms, no alterations of paired pulse ratios were observed after hypoxia. Application of nifedipine and APV alone did not have a significant effect on short-term plasticity. Following recovery from hypoxia, however, the facilitation of PS PPR at ISI of 50 ms in APP−/− was abolished in slices treated with either of the drugs (Fig. 3E). In nifedipine-treated APP−/− slices, the PPR of fEPSP at ISI of 50 ms was reduced following hypoxia (Fig. 3E; n = 5/8 slices from 3/4 mice; p = 0.011, Mann–Whitney U Test). Finally, we correlated the change in short-term plasticity (PPR of PS at 50 ms) with the change in excitability of the CA1 network, measured as the change in efficacy of stimulation-evoked population-spikes after hypoxia. Indeed, these parameters were clearly correlated in APP−/− tissue, in line with the different excitation-spike coupling in mice lacking APP (Fig. 3G).
Figure 3.
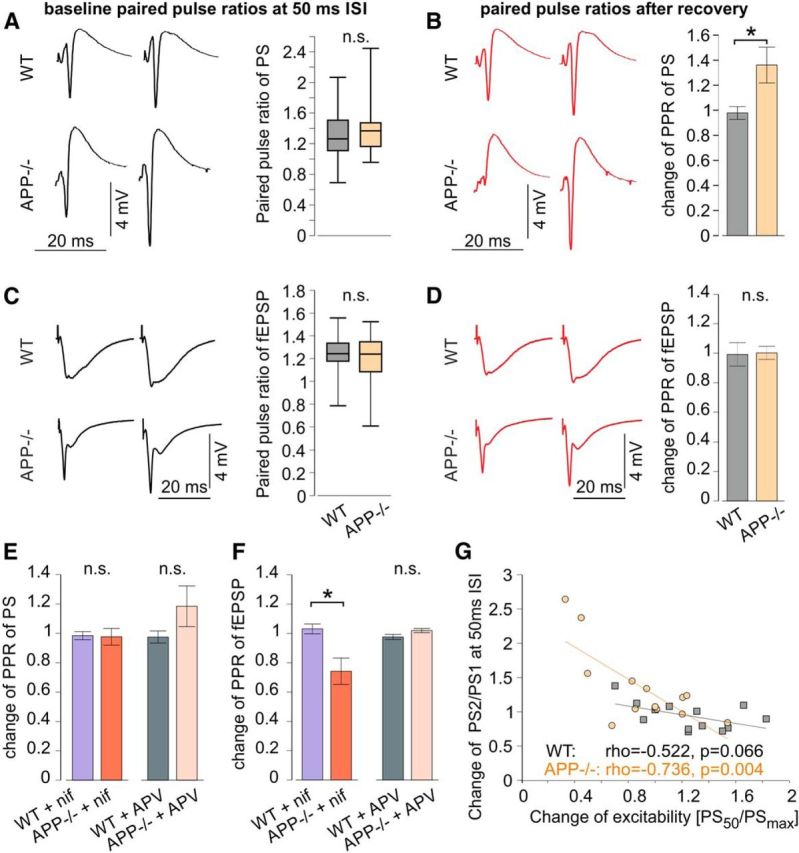
Altered short-term plasticity in APP−/− slices after hypoxia. A–D, Paired pulse stimulation with 50 ms ISI during baseline recording (A, C) and after recovery of hypoxia (B, D) in WT and APP−/− slices. Left, Example responses. Right, baseline PPR (A, C) and change of PPR after hypoxia (B, D). A, Baseline PPR of PS (44/46 slices from 14/18 WT and APP−/− mice, respectively; p = 0.52, two-sided Mann–Whitney U Test). B, Change of PPR of PS (13/21 slices from 7/9 WT and APP−/− mice, respectively; p = 0.014, two-sided Mann–Whitney U Test). C, Baseline PPR of fEPSP (21/24 slices from 11/13 WT and APP−/− mice, respectively; p = 0.86, two-sided Mann–Whitney U Test). D, Change of PPR of fEPSP (7/9 slices from 5/6 WT and APP−/− mice, respectively; p = 0.83, two-sided Mann–Whitney U Test). E, Change of PPR of PS after hypoxia in nifedipine-treated (10/12 slices from 3/5 WT and APP−/− mice, respectively; p = 0.38, two-sided Mann–Whitney U Test) and APV-treated slices (11/13 slices from 4/4 WT and APP−/− mice, respectively; p = 0.20, two-sided Mann–Whitney U Test). F, Change of PPR of fEPSP after hypoxia in nifedipine-treated (5/8 slices from 3/4 WT and APP−/− mice, respectively; p = 0.011, two-sided Mann–Whitney U Test) and APV-treated (10/7 slices from 3/3 WT and APP−/− mice, respectively; p = 0.094, two-sided Mann–Whitney U Test) slices. G, Correlation between the change of excitability and the change of PPR of PS after hypoxia in WT and APP−/−. ρ, Pearson's linear correlation coefficient; p, p value for Pearson's correlation using Student's distribution for transformation of correlation. n.s., Not significant. *p < 0.05, two-sided Mann-Whitney U Test.
Altered cellular properties and impaired recovery from hypoxia of CA1 pyramidal cells in APP−/− slices
We next searched for cellular correlates of the increased vulnerability toward hypoxia in APP−/− slices. Intracellular recordings from CA1 pyramidal cells revealed a significantly depolarized resting membrane potential in APP−/− mice compared with WT (−63.3 ± 2.4 mV [n = 15 cells from 6 mice] vs −73.3 ± 1.4 mV [n = 15 cells from 9 mice], respectively; p = 0.0103, one-way ANOVA, Figure 4A). Input resistance (Fig. 4B) and membrane time constant (data not shown) did not vary significantly between groups. Likewise, membrane capacitance did not differ between cells from WT and APP−/− mice. However, capacitance in cells from APP−/− mice was slightly lower than in APPsα-KI (227 ± 22 pF in APP−/− versus 355 ± 38 pF in APPsα-KI, n = 17 cells from 6 mice) and nifedipine-treated APP−/− cells (358 ± 46 pF; n = 10 cells from 5 mice; Fig. 4C; p = 0.0088, one-way ANOVA). In most cells, hypoxia induced an initial hyperpolarization (Fig. 4D, top). At 2 min following hypoxia, this negative shift of membrane potential was significantly larger in APP−/− cells compared with both other genotypes. Again, this difference was abolished by nifedipine (Fig. 4D, middle; p = 0.008, one-way ANOVA), which rendered the membrane potential of APP−/− cells remarkably stable (5 of 6 cells). During hypoxia, most cells experienced a transient decrease of input resistance and membrane time constant without significant differences between genotypes (data not shown). Stable recordings for at least 20 min following hypoxia could be obtained from 6/15 WT cells, 5/10 APPsα-KI, 6/11 APP−/−, and 6/10 nifedipine-treated neurons. Some of these cells developed HSD without clear differences between groups (2/6, 4/5, 2/6, and 1/6 in WT, APPsα-KI, APP−/− and nifedipine-treated APP−/− slices, respectively). In slices with HSD, cells quickly depolarized up to −5 mV, but mostly regained their membrane potential following reoxygenation (see also Fig. 4D, bottom). Recovery of membrane potential was unaltered between genotypes, with larger variation in APP−/− cells (Fig. 4E). Input resistance (Fig. 4F) and membrane capacitance (Fig. 4G) also recovered similarly in all groups.
Figure 4.
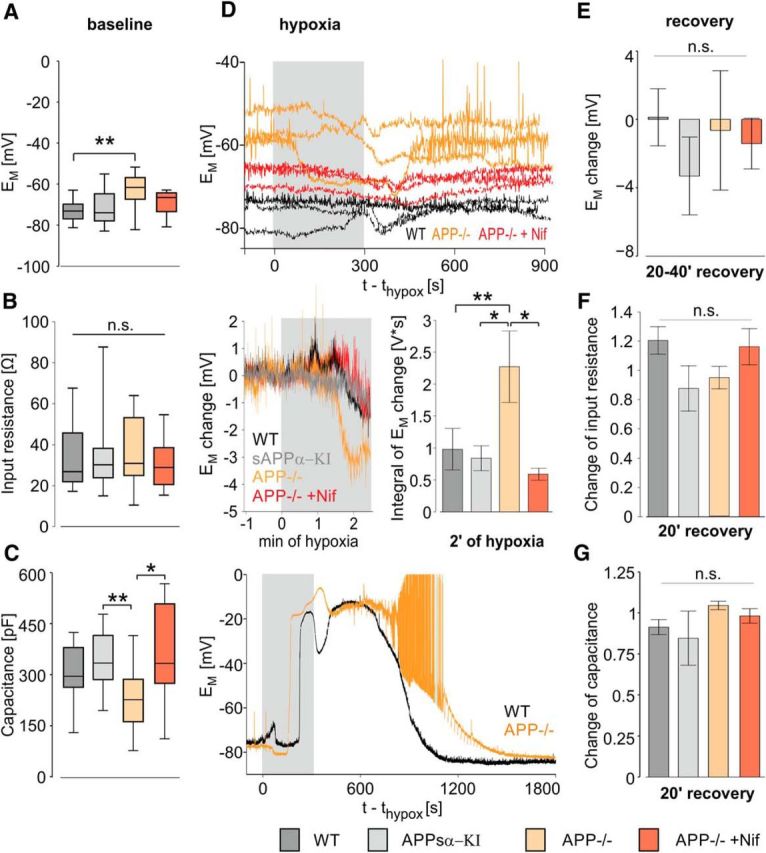
Depolarized resting membrane potential of CA1 pyramidal neurons in APP−/− mice and accelerated hyperpolarization in response to hypoxia. A, Resting membrane potential of CA1 pyramidal neurons in WT (dark gray), APPsα-KI (light gray), APP−/− (orange), and nifedipine-treated APP−/− (crimson) tissue at baseline conditions. p = 0.0103 (one-way ANOVA). B, Input resistance during baseline, calculated from a series of negative current injections. p = 0.67 (one-way ANOVA). C, Membrane capacitance. p = 0.0088 (one-way ANOVA). D, Top, Resting membrane potential of each three WT (black), APP−/− (orange), and nifedipine-treated APP−/− (crimson) cells without occurrence of spreading depression during hypoxia and early recovery. APs are truncated; time points of current injection are cut out. Middle left, Change of the mean resting membrane potential during the first 150 s of hypoxia. Middle right, Integral of the resting membrane potential change between baseline and 2 min of hypoxia. p = 0.008 (one-way ANOVA). Bottom, Membrane potential in a WT (black) and an APP−/− cell (orange) in slices with spreading depression. APs are truncated at 0 mV; time points of current injections are cut out. E, Change of resting membrane potential after recovery of hypoxia. p = 0.34 (one-way ANOVA). F, Change of input resistance after recovery. p = 0.22 (one-way ANOVA). G, Change of membrane capacitance after recovery. p = 0.36 (one-way ANOVA). A–C, n = 15/17/15/10 cells from 6/6/9/5 WT, APPsα- KI, APP−/−, and APP−/− mice in the presence of nifedipine, respectively. E–G, n = 6/5/5/6 cells from 4/4/4/4 mice, respectively. *p < 0.05 (one-way ANOVA with post hoc Tukey's Multiple Comparison Test). **p < 0.01 (one-way ANOVA with post hoc Tukey's Multiple Comparison Test). ***p < 0.001 (one-way ANOVA with post hoc Tukey's Multiple Comparison Test). n.s., Not significant.
We then compared waveforms of APs between neurons from WT and APP-deficient mice before and after hypoxia. Amplitude and rate of rise were lower in APP−/− compared with WT and APPsα-KI but adopted control values in the presence of 10 μm nifedipine (Fig. 5A–C, top, 15/14/12/10 cells from 6/6/9/5 WT, APPsα-KI, APP−/− mice with/without nifedipine-application, respectively). Following reoxygenation, cells from APP−/− mice showed slightly reduced amplitude and rate of rise of APs compared with prehypoxic conditions. This effect was fully rescued by nifedipine (Fig. 5A–C, bottom, 6/4/5/6 cells from 4/4/4/4 mice, respectively). Remarkably, cells from APPsα-KI did not show any difference toward WT cells with respect to AP waveform under baseline conditions or following hypoxia. There was a strong correlation between AP amplitude and rate of rise under baseline conditions as well as following hypoxia, without significant differences between groups (Fig. 5D).
Figure 5.
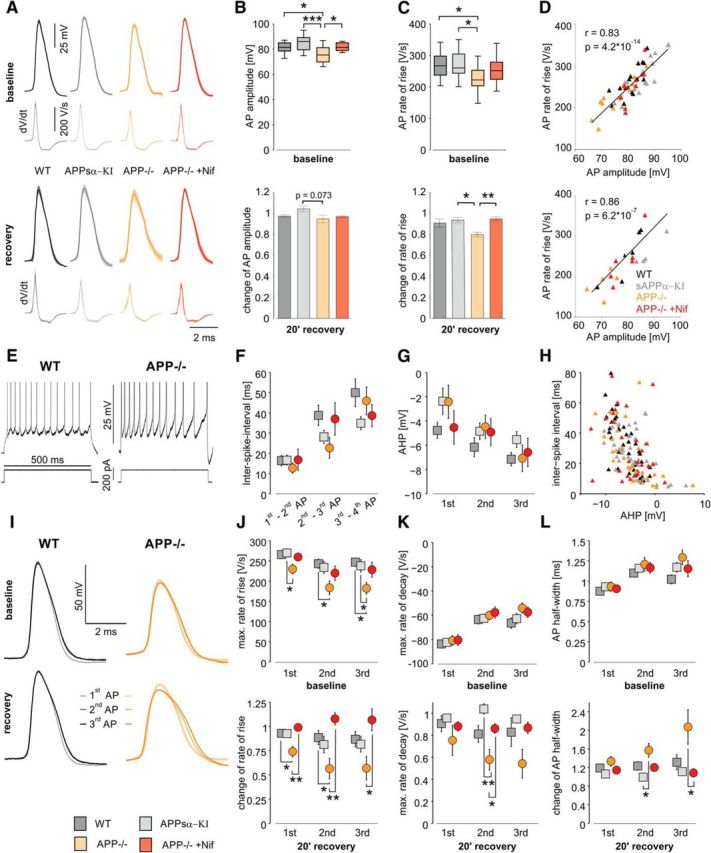
Altered firing properties of CA1 pyramidal neurons in APP−/− and impaired AP generation after hypoxia, rescued by nifedipine and APPsα-KI. A, Averaged AP shapes of CA1 pyramidal cells in WT, APPsα-KI, APP−/−, and nifedipine-treated APP−/− slices, shown as mean (darker line) ± SEM (lighter shape) under baseline conditions and after recovery of hypoxia. The plots below each AP represent the averaged dV/dt trace. B, AP amplitude, defined as difference between the peak and the threshold (maximum of the second derivative) of an AP at baseline conditions (top); p = 0.000424, one-way ANOVA, and its change after 20 min of recovery (bottom); p = 0.073, one-way ANOVA. C, Maximal rate of rise, defined of the first derivative of an AP, at baseline (top); p = 0.047, one-way ANOVA and its change after recovery (bottom); p = 0.01, one-way ANOVA. D, Correlation between AP amplitude and rate of rise at baseline (top) and after recovery (bottom). Triangles represent a value pair from one cell in WT (black), APPsα-KI (gray), APP−/− (orange), and nifedipine-treated APP−/− (crimson) tissue. Black line indicates least-squares linear regression. r, Pearson's linear correlation coefficient, p, p value for Pearson's correlation using Student's distribution for transformation of correlation. A–D, *p < 0.05 (one-way ANOVA with post hoc Tukey's Multiple Comparison Test). **p < 0.01 (one-way ANOVA with post hoc Tukey's Multiple Comparison Test). ***p < 0.001 (one-way ANOVA with post hoc Tukey's Multiple Comparison Test). Baseline: n = 15/14/12/10 cells from 6/6/9/5 WT, APPsα- KI, APP−/−, and APP−/− mice in presence nifedipine, respectively; recovery: n = 6/4/5/6 cells from 4/4/4/4 mice, respectively. E, Representative trains of AP in WT (left) and APP−/− (right) cells elicited by a suprathreshold positive current injection of same magnitude during baseline recording. APs are truncated. F, ISIs between the first four APs in a train in WT (dark gray), APPsα- KI (light gray), APP−/− (orange), and and nifedipine-treated APP−/− (crimson) tissue during baseline. G, AHP of the first three APs in an AP train during baseline. AHP amplitude was defined as the difference between the local minimum following an AP and its threshold. H, Relationship between AHP and the ISI. Triangles represent a value pair from one cell. I, Superimposed representative trains of the first three APs in a train of a WT (left) and an APP−/− cell (right) during baseline recording (top) and after recovery (bottom). Note the widening and the reduction of amplitude of the second and third AP of the APP−/− cell after hypoxia. J, Maximum rate of rise of the first three APs in a train during baseline (top, p = 0.052, p = 0.043, p = 0.017, respectively, one-way ANOVA) and its change after recovery (bottom, p = 0.004, p = 0.0027, p = 0.0026, respectively, one-way ANOVA). K, Maximum rate of decay, defined as minimum of the first derivative of an AP, of the first three APs in a train during baseline (top, p = 0.92, p = 0.72, p = 020, respectively, one-way ANOVA) and its change after recovery (bottom, p = 0.47, p = 0.008, p = 0.1, respectively, one-way ANOVA). L, Half-width of the first three APs in a train during baseline (top, p = 0.65, p = 0.63, p = 0.08, respectively, one-way ANOVA) and its change after recovery (bottom, p = 0.18, p = 0.023, p = 0.018, respectively, one-way ANOVA). I–L, *p < 0.05 (one-way ANOVA with post hoc Tukey's Multiple Comparison Test). **p < 0.01 (one-way ANOVA with post hoc Tukey's Multiple Comparison Test). ***p < 0.001 (one-way ANOVA with post hoc Tukey's Multiple Comparison Test). Baseline: n = 14/15/11/9 cells from 6/6/8/5 WT, APPsα- KI, APP−/−, and nifedipine-treated APP−/− mice, respectively; recovery: n = 6/3/5/6 cells from 4/3/4/4 WT, APPsα- KI, APP−/−, and nifedipine-treated APP−/− mice, respectively.
To further investigate cellular excitability and the potency to maintain energy-demanding high-frequency firing rates, we elicited trains of APs by 500 ms current pulses during baseline conditions (Fig. 5E) and after recovery from hypoxia. The amplitude of the current pulse did not vary between the four groups and was between 0.51 ± 0.10 nA in APP−/− and 0.64 ± 0.11 nA in APPsα-KI cells (p = 0.73, one-way ANOVA). Each pulse evoked between 10.27 ± 0.58 AP in APPsα-KI and 10.79 ± 0.76 AP in WT (p = 0.94, one-way, ANOVA). All cells showed spike frequency adaptation as typical for CA1 pyramidal cells without significant differences between groups. However, the first two ISIs showed a tendency to shorter times in APP−/− cells compared with WT (Fig. 5F; 12.7 ± 2.5 ms and 22.7 ± 5.1 ms vs 16.4 ± 2.6 ms and 38.8 ± 5.0 ms, respectively; p = 0.78 and p = 0.11, respectively, one-way ANOVA). The AHP of the first two spikes appeared also smaller in APP−/− compared with WT neurons without reaching significance (Fig. 5G; −2.37 ± 1.09 mV vs −4.11 ± 0.63 mV, p = 0.25, one-way ANOVA). ISIs were strongly negatively correlated with AHP amplitude (Fig. 5H; ρ = −0.48, p = 1.15 × 10⁻⁹).
During a train of AP, amplitude declined progressively, rates of rise and decay became slower and AP waveforms wider (Fig. 5I–L). During baseline, the maximum rate of rise of the first three AP was smaller in APP−/− compared with WT and to APPsα-KI (Fig. 5J, top). In contrast, the rate of decay and the AP half-width did not differ significantly. Following recovery from hypoxia, kinetics of APs in APP−/− mice was more severely altered than in the other groups. For example, rate of rise was significantly diminished in APP−/− (56 ± 10% of baseline value for the second AP vs 107 ± 11% in nifedipine-treated APP−/− slices and 87 ± 8% in WT; Fig. 5J, bottom; p = 0.0027, one-way ANOVA). The rate of decay slowed down to 58 ± 9% of baseline (APP−/−) versus 104 ± 5% in APPsα-KI (Fig. 5K, bottom; p = 0.008, one-way ANOVA). AP width increased to 207 ± 37% of baseline in the third AP of the train versus 108 ± 9% in nifedipine-treated APP−/− slices (Fig. 5L, bottom; p = 0.018, one-way ANOVA).
Compromised recovery of spontaneous network activity in APP−/−
Mouse hippocampal slices exhibit spontaneous sharp wave-ripple (SPW-R) activity, characterized by propagating field potential waves with superimposed fast oscillations at ∼200 Hz and time-locked APs (Fig. 6A–C) (Maier et al., 2003; Both et al., 2008). Network oscillations are highly energy demanding processes (Kann, 2011) that are vital for information processing in the brain (Buzsáki and Draguhn, 2004) and are impaired in AD patients and mouse models of AD (Sanchez et al., 2011; Verret et al., 2012). Therefore, we analyzed hippocampal SPW-R activity in slices from WT, APP−/−, and APPsα-KI mice. Under basal conditions, frequency of SPW-R in CA1 and CA3 was similar in all groups (Fig. 6D). Likewise, further features, such as SPW-R amplitude as well as the frequency and energy content of superimposed ripple oscillations, were unaltered (data not shown). After 2–3 min of hypoxia, network oscillations were abolished in all slices (Fig. 6A,B,E). Recovery after reoxygenation, however, was strongly different between genotypes and brain regions: in CA3, slices from APP−/− mice showed delayed and incomplete recovery of SPW-R frequency (Fig. 6E,F) and reduced ripple energy (Fig. 6G) compared with WT. Network activity in CA1 recovered incompletely within the time of observation, reaching ∼60%-70% of the initial frequency of SPW-R. However, in this hippocampal subfield, time course and degree of recovery were similar for all three genotypes (Fig. 6E–G). Interestingly, waveforms and propagation of SPW-R were largely normal after recovery from hypoxia in all genotypes, indicating intact mechanisms of neuronal interactions in local networks (Fig. 6C). Nifedipine (10 μm) did not alter properties of spontaneous network activity (data not shown). However, the drug restituted recovery from hypoxia in slices from APP−/− mice (Fig. 6F,G), in line with our results on evoked population spikes.
Figure 6.

Impaired recovery of spontaneous sharp wave-ripple activity in CA3, but not CA1 in APP−/−. A, Representative LFP recordings of spontaneous SPW-R activity in WT and APP−/− slices in CA3 and CA1 during baseline, at 3 min of hypoxia, and after 30 min of recovery. B, Power spectra in the CA3 region of an APP−/− slice under baseline conditions, after 5 min of hypoxia, and after 30 min of recovery. C, Example of SPW-R propagation from CA3 to CA1 in an APP−/− slice during baseline and after recovery from hypoxia. D, Baseline SPW-R frequency in CA3 (left, n = 18/6/17 slices from 10/3/14 WT, APPsα-KI and APP−/− mice, respectively; p = 0.35, one-way ANOVA) and CA1 (right, n = 22/12/34 slices from 12/4/15 WT, APPsα-KI and APP−/− mice, respectively; p = 0.21, one-way ANOVA). E, Time courses of SPW-R frequency in slices from the three genotypes in CA3 (top) and CA1 (bottom). Subplots on the right zoom in on the first 3 min of hypoxia. F, Change of SPW-R frequency after 30–40 min of recovery from hypoxia in CA3 (n = 7/6/8 slices from 5/3/6 WT, APPsα-KI, and APP−/− mice, respectively; p = 0.025, one-way ANOVA) and CA1 (n = 9/12/20 slices from 5/4/8 mice; p = 0.71, one-way ANOVA). Circles represent single experiments without HSD. Triangles represent experiments with occurrence of an HSD. G, Change of ripple energy after recovery in CA3 (p = 0.043, one-way ANOVA) and CA1 (p = 0.10, one-way ANOVA). *p < 0.05 (one-way ANOVA with post hoc Tukey's Multiple Comparison Test). **p < 0.01 (one-way ANOVA with post hoc Tukey's Multiple Comparison Test). n.s., Not significant.
Increased incidence of hypoxia-induced spreading depression in APP−/−
Consistent with previous findings (Aitken et al., 1998; Somjen, 2001; Foster et al., 2005), hypoxia induced spreading depressions in a subset of slices, characterized by long-lasting negative field potential transients of 10–30 mV and accompanying membrane potential depolarization in pyramidal cells (Fig. 7A). Slices from APP−/− mice were significantly more likely to develop HSD during the 5 min hypoxic period than WT slices (16 of 22 slices from APP−/− mice and 3 of 18 slices from WT animals; p < 0.001; Tukey's multiple comparison of proportions) (Fig. 7B). Nifedipine (10 μm) reduced the probability of HSD in APP−/− slices to the level of WT tissue (HSD in 3/14 vs 3/11 slices, respectively; Fig. 7C), whereas APV (60 μm) did not prevent HSD generation in APP−/− (SD in 9/13 vs 1/14 slices, respectively; p < 0.001). Propensity for SD appeared also higher in slices from APPsα-KI, although there was no significant difference toward WT (Fig. 7B). Notably, we found a correlation between SPW-R frequency under baseline conditions and the probability of HSD (Fig. 7D). The risk to develop a spreading depression was significantly higher in slices with high (>3 Hz) incidence of SPW-R than in those with lower frequency of network events (1–2 Hz; both CA1 and CA3). Other parameters, such as PS amplitude, fEPSP slope, and PPR, did not correlate with risk of HSD. Importantly, the reduced recovery of PS amplitude was also present in those APP−/− slices, which had not undergone HSD (Fig. 7E, left), excluding that the hypoxia-induced functional deficits described are secondary to spreading depression. On the other hand, PS in APPsα-KI slices, which had undergone an HSD, tended to recover better than in APP−/− slices with HSD (Fig. 7E, right). HSD occurred after 211 ± 15 s in APPsα-KI and 212 ± 18 s in APP−/− slices. We found no correlation between the latency to the onset of HSD and recovery of PS amplitude (Fig. 7F). In most slices, electrophysiological parameters showed at least partial recovery following SD. However, some slices from APP−/− mice did not regain normal population spikes (Fig. 1E) and network activity (Fig. 6F).
Figure 7.

Increased risk of hypoxia-induced spreading depression in APP−/− slices lowered to WT level by nifedipine. A, Example of a hypoxia-induced spreading depression in an APP−/− slice. Left arrow indicates 180 s after hypoxia induction. Right arrow indicates end of hypoxia. Top, Intracellular recording from a CA1 pyramidal cell with a sharp electrode. Bottom, LFP recording in CA1, stratum pyramidale. B, Probability of HSD. An HSD occurred in 3/18 of WT, 7/12 of APPsα-KI, and 16/22 of APP−/− slices. p < 0.001 (Tukey's multiple comparison of proportions). C, Probability of HSD in WT and APP−/− slices treated with nifedipine (HSD in 3/11 and 3/14 slices, respectively; p = 0.73, χ2 test for comparison of two proportions) and APV (HSD in 1/14 and 9/13 slices, respectively; ***p = 0.00084, χ2 test for comparison of two proportions). D, Probability of HSD in correlation to the baseline SPW-R frequency in CA1 and CA3. **p < 0.01 (Tukey's multiple comparison of proportions). B–D, Error bars indicate Clopper–Pearson CIs for α = 0.05. E, Left, Recovery of PS in WT and APP−/− slices without occurrence of an HSD (12/6 slices from 7/3 mice, respectively). *p = 0.042 (two-sided Mann–Whitney U Test). n.s., Not significant. Right, Recovery of PS in APP−/− and APPsα-KI slices with HSD (16/7 slices from 7/3 mice, respectively, p = 0.057, two-sided Mann–Whitney U Test). F, Correlation between latency to HSD and recovery of PS amplitude in WT (gray squares, black regression line) and APP−/− (orange circle and regression line) slices.
Enhanced calcium influx in APP−/− slices during hypoxia
Our previous results indicate that the increased sensitivity of APP-deficient hippocampal neurons to hypoxia strongly depends on activity of L-type calcium channels. We therefore performed calcium imaging experiments in parallel to LFP recording in CA1 to compare the calcium dynamics under hypoxia between slices from APP−/− and WT mice (Fig. 8A). Neurons were bulk-loaded with OGB-1, and hypoxia was maintained until the onset of spreading depression. Hypoxia induced a slow increase in the calcium signal (Fig. 8E–H), followed by a rapid fluorescence peak, corresponding to an SD (Fig. 8I–L). Typically, the calcium elevation reached a plateau potential before SD. The amplitude of this signal was increased in APP−/− mice, and time to onset of SD was reduced (Fig. 8B,F,J) (n = 7/9 slices from 4/5 WT and APP−/− mice, respectively; p = 0.031, p = 0.042, respectively, two-sided Mann–Whitney U Test). Both effects were rescued in the presence of nifedipine (10 μm) (Fig. 8C,G,K). In an additional, independent set of experiments, we compared WT and APPsα-KI slices (Fig. 8D,H,L) and found no differences in the change of calcium signal intensity (p = 0.86) and time to peak intensity (p = 0.46) between these groups (6/9 slices from 2/3 mice, respectively).
Figure 8.

Increased calcium influx through LTCC reduces latency to HSD in APP−/−. A, E, I, Examples of calcium imaging in CA1 (left) and the corresponding LFP recording from CA1p during baseline conditions (A), the plateau-like phase before the spreading depression (E), and HSD (I). A, P, CA1p; R, CA1r. Blue line indicates approximate border between CA1p and CA1r. Dashed lines (bottom) indicate the position of the pipette. White bar represents 50 μm. B, Latency to the peak of fluorescence intensity (left, *p = 0.0311, two-sided Mann–Whitney U Test) and increase of fluorescence intensity at the plateau before HSD (right, *p = 0.0418, two-sided Mann–Whitney U Test) in untreated WT and APP−/− slices (n = 7/9 slices from 4/5 mice, respectively). n.s., Not significant. C, Latency to the peak of fluorescence intensity (left, 0.7984, two-sided Mann–Whitney U Test) and increase of fluorescence intensity at the plateau before HSD (right, 0.2925, two-sided Mann–Whitney U Test) in nifedipine-treated WT and APP−/− slices (6/7 slices from 2/3 mice, respectively). D, Latency to the peak of fluorescence intensity (left, p = 0.86, two-sided Mann–Whitney U Test) and increase of fluorescence intensity at the plateau before HSD (right, p = 0.46, two-sided Mann–Whitney U Test) in untreated WT and sAPPα-KI slices (6/9 slices from 2/3 mice, respectively). F–H, Mean increase of fluorescence intensity in untreated (F), nifedipine-treated (G), WT and APP−/− and untreated WT and sAPPα-KI slices (H) during hypoxia. The dotted line indicates the start of hypoxia. J–L, Increase of fluorescence intensity in each two representative untreated (J), nifedipine-treated (K) WT and APP−/− and untreated WT and sAPPα-KI slices (L) during hypoxia.
Deficits in APP−/− are not attributed to acute cell death
To test for induction of apoptosis, we stained hippocampal slices with the nuclear dye DAPI as well as antibodies against the neuronal marker NeuN (Mullen et al., 1992) and the early apoptosis marker annexin V (Bahmani et al., 2011). Tissue was fixed directly after preparation, at 40 min after hypoxia, and at 4 h after hypoxia. As a control, 2–3 slices per genotype were kept in nonhypoxic conditions and fixed after 3–4 h (the usual incubation time) and after 9 h (the maximal total duration of experiments). Numbers of NeuN+ and annexin V+ cells were used to calculate a “vitality score.” NeuN+/annexin− cells scored 1, NeuN+/annexin+ and unstained cells scored 0.5, and NeuN−/annexin+ cells scored 0 points. In slices of all genotypes, which were fixed directly after incubation annexin V-staining, was largely absent in CA1 (Fig. 9Aa). Likewise, slices fixed after 3–4 or 9 h of incubation in normoxic conditions showed largely unaltered NeuN and annexin V fluorescence (Fig. 9Ab) and no significant reduction in vitality. Following hypoxia, some cell nuclei adopted a typical pyknotic form and were surrounded by an annexin-stained matrix and by fragments of NeuN-stained material, in contrast to the homogeneous staining in unaffected neurons (Fig. 9Ac,Ad). The percentage of annexin+ cells increased, whereas numbers for NeuN staining decreased (Fig. 9B). The vitality of slices after hypoxia was highly variable, and we found no significant differences between genotypes or between slices fixed at 40 min or at 4 h after hypoxia (Fig. 9C). However, WT and APP−/− slices fixed 40 min after hypoxia as well as APP−/− slices fixed 4 h after hypoxia had a significantly reduced score compared with baseline, whereas vitality scores in APPsα-KI and nifedipine-treated APP−/− slices were not significantly altered (Fig. 9C). This finding underlines the protective effect of APPsα- and nifedipine against hypoxia-induced cell damage. Interestingly, the nuclear area was reduced in most slices after 3–4 h of incubation (data not shown) or after hypoxia compared with baseline (not different between genotypes), but not after 9 h of incubation in normal oxygen conditions (Fig. 9D). Nuclear areas were positively correlated with vitality scores (Fig. 9E) with most NeuN+/annexin− cells with a cross-sectional area between 50 and 100 μm2 and the majority of NeuN−/annexin+ cells with an area of ∼30 μm2.
Figure 9.

Absence of increased cell death following hypoxia in APP−/− compared with other genotypes. A, CA1 region of APP−/− slices in 20× magnification, fixed immediately after preparation (Aa), after 9 h of incubation (Ab), and after the hypoxia experiment plus additional 4 h incubation (Ac). Ad, Zoom on a pyknotic nucleus from Ac, labeled with an asterisk. B, NeuN and annexin V staining behavior in slices fixed directly after cutting (n = 5/6/4 WT, APPsα-KI, and APP−/− slices, respectively), directly after the hypoxia experiment (including 40 min of recovery, n = 5/6/6/4 WT, APPsα-KI, APP−/−, and nifedipine-treated APP−/− slices, respectively) or after hypoxia plus four additional hours of incubation (n = 5/9/12/4 WT, APPsα-KI, APP−/−, and nifedipine-treated APP−/− slices, respectively). Only cells showing somatic NeuN staining were considered NeuN+. Green represents NeuN+ and annexin− (putatively healthy) cells. Yellow represents both NeuN− and annexin+ (possibly ongoing apoptosis) cells. Red represents NeuN− and annexin+ (putatively dead) cells. Gray represents unstained cells. C, Vitality score of slices: 0 = maximum death; 1 = maximum vitality. Twenty cells per section and 4–8 sections per slice (n = 1) were analyzed. NeuN+/annexin− cells scored 1, NeuN+/annexin+ and unstained cells scored 0.5, and NeuN−/annexin+ cells scored 0 points. D, Nuclear cross-sectional area. There were no significant difference between genotypes in the three conditions (one-way ANOVA). #p < 0.05, difference within genotype compared with slices fixed directly after cutting (Mann–Whitney U Test). ##p < 0.01, difference within genotype compared with slices fixed directly after cutting (Mann–Whitney U Test). ###p < 0.001, difference within genotype compared with slices fixed directly after cutting (Mann–Whitney U Test). E, Correlation between nuclear area and vitality scores in all sections combined. The color of the dots corresponds to the genotype. Red lines indicate a fit to the exponential function (f(x) = 1 − e(−b × x), b = 0.02101) and its 95% confidence limits (b = [0.01942, 0.0226]). F, Merged fluorescent images of the CA1 region of triple APP−/− slices stained against parvalbumin (green), annexin V (red), and with DAPI (blue) immediately after dissection (Fa), after 9 h of incubation (Fb), and after hypoxia with four additional hours of incubation (Fc). White bars represent 100 μm. G, Magnified images of a parvalbumin+ and annexin+ neuron marked with a white arrowhead (Fc). Ga, Anti-parvalbumin staining. Rectangle represents the field of view in Gb–Ge. Gb–Ge, Magnified image of the soma stained with DAPI (Gb), anti-parvalbumin (Gc), anti-annexin V (Gd), and the merged image (Ge). White bars represent 5 μm. H, Proportion of annexin+ parvalbumin+ neurons in WT, APPsa-KI, and APP−/− slices immediately after dissection (3/18, 18/82, and 15/50 annexin+ cells, respectively), after the hypoxia experiment (27/59, 22/74, and 23/62 annexin+ cells, respectively), and after hypoxia plus four additional hours of incubation (11/25, 4/15, and 18/53 annexin+ cells, respectively). Error bars indicate Clopper–Pearson CIs for proportions for α = 0.05. The number of slices corresponds to the number of slices in B–E. n.s., Not significant. p = 0.43, p = 0.16, p = 0.51 for the three conditions (Tukey's multiple comparison of proportions). n.s., Not significant.
Fast-spiking parvalbumin-positive (PV+) interneurons contribute essentially to temporally coordinated hippocampal network activity. Because APP has been reported to affect GABAergic inhibition via modulation of LTCC (Yang et al., 2009), we evaluated cell death in PV+ interneurons (Fig. 9F–H). PV immunostaining revealed cells with highly branched arborization within the CA1p layer and varicose dendrites reaching far into CA1r, without apparent differences in cell count and morphology between groups (Fig. 9F). The amount of PV+ cells stained positively for annexin (Fig. 9G) did not vary significantly between groups and conditions (Fig. 9H). Together, these data show that within our time of observation hypoxia does induce a certain amount of cell death. The functional deficits observed in APP−/− slices, however, are not due to increased neuronal loss following transient hypoxia.
Discussion
The normal functions of APP and its cleavage products remain largely unknown, despite the importance of these molecules in AD (O'Brien and Wong, 2011). Here, we show that APP has an acute neuroprotective function following transient hypoxia in hippocampal tissue. Functional recovery was strongly enhanced by APP via control of calcium load through LTCCs. Our findings are in line with earlier studies suggesting a neuroprotective role of APP in vitro (Kögel et al., 2012) and in vivo (Clarke et al., 2007; Koike et al., 2012). The effects seem to be mostly mediated by the soluble extracellular domain APPsα, which was sufficient to rescue most cellular and network functions. Interestingly, earlier studies focusing on neuronal damage have suggested a similar protective role of APPsα (Smith-Swintosky et al., 1994; Thornton et al., 2006).
Normal network function of APP−/− tissue under baseline conditions
In our present and previous (Zhang et al., 2013) studies, baseline synaptic and network functions were largely unaltered in APP−/− mice, probably due to compensatory activities of the homologous proteins APLP1 and APLP2 (Weyer et al., 2011; Hick et al., 2015). At the cellular level, however, APP−/− neurons showed functional alterations, such as depolarized resting membrane potential and reduced AP amplitude. They were also absent in nifedipine-treated APP−/− slices and in tissue from APPsα-KI mice, indicating a direct or indirect interaction between APPsα and LTCC. The slight decrease in AP amplitude may well be secondary to the partial inactivation of sodium channels under resting conditions (Cantrell and Catterall, 2001). Despite unaltered network function in normal oxygen, the depolarized membrane potential may well contribute to increased calcium influx and subsequent functional deficits under challenging conditions, such as hypoxia.
Facilitated cellular response to hypoxia and HSD occurrence in APP−/− neurons
Under hypoxia, APP−/− neurons showed faster increase of calcium levels and enhanced initial hyperpolarization. These differences point toward altered regulation of calcium influx (see below) and hypoxia-induced outward potassium currents (Martin et al., 1994; Misonou et al., 2005). Notably, outward K+ current may mediate some forms of neuronal apoptosis (Yu et al., 1997). At the network level, the incidence of hypoxic spreading depression was strongly increased in APP−/− slices. This widespread breakdown of membrane potential and ion gradients can be observed under conditions of severe neuronal stress, such as subarachnoid hemorrhage (Dreier et al., 2009) and ischemia (Dohmen et al., 2008), underlining the increased vulnerability of APP−/− tissue. Interestingly, incidence of HSD correlated with baseline network (SPW-R) activity. These events go along with increased neuronal firing rates (Csicsvari et al., 1999) and may thus enhance metabolic demands (Kann, 2011) and vulnerability to HSD. Importantly, however, the deficient recovery from hypoxia in APP−/− mice was also present in slices without HSD and thus constitutes and independent pathophysiological mechanisms.
Impaired population spike generation and high-frequency firing in APP−/− following hypoxia
Despite largely unaltered fEPSP recovery from a transient hypoxic episode, spike generation in CA1 recovered much slower and less completely in APP−/− slices. This indicates impaired excitation-spike coupling in CA1 following hypoxia. At the cellular level, we found decreased amplitude and rate of rise of APs following hypoxia. These and further small differences in (repetitive) AP firing appear too subtle, however, to explain the lasting posthypoxic reduction in population spike amplitude by >40%. Indeed, with stronger stimulation, we could evoke maximal population spike amplitudes much closer to control tissue, again pointing to altered excitation-spike coupling, rather than intrinsic excitability itself. In any case, generation of repetitive spikes and lasting synaptic activity require effective restoration of sodium and potassium gradients and are thus highly energy-demanding (Liotta et al., 2012). Thus, the functional deficits in APP−/− slices may indicate disturbed energy and ion homeostasis after hypoxia.
Impaired generation of spontaneous network activity following hypoxia
SPW-R activity was rapidly abolished during hypoxia, but recovered partially in most slices, even following a spreading depression. After reoccurrence of the spontaneous network activity, the intrinsic features of SPW-R, such as ripple frequency, phase-coupled unit firing, and propagation from CA3 to CA1, remained remarkably stable. Some APP−/− slices, however, were not able to regain spontaneous SPW-R activity, and average SPW-R frequency as well as ripple energy remained significantly reduced compared with WT. Coordinated network oscillations require highly precise balance between inhibition and excitation (Maier et al., 2003; Nimmrich et al., 2005), intact function of interneurons (Klausberger et al., 2003), and highly efficient energy supply (Kann et al., 2014). The deficient recovery of network activity following hypoxia is thus in line with a role of APP in metabolic stress resistance.
Reduction of hypoxia-induced calcium influx via LTCC as a protective mechanism of APP
The deficits in APP−/− mice are clearly linked to calcium homeostasis, as shown by the complete rescue after preincubation with nifedipine. In line with these findings, calcium imaging revealed that the L-type calcium channel blocker did indeed decrease the hypoxia-induced calcium influx to WT levels. It is important to note that, in these experiments, WT slices were also treated with nifedipine and did not show any difference to drug-naive WT slices. Thus, L-type calcium channels do indeed account for the difference between APP−/− and WT, rather than being an unspecific target for alleviating hypoxic damage. Indeed, APP has been shown to interact with Cav1.2 LTCC and to suppress voltage-dependent calcium influx into neurons (Yang et al., 2009). It is, thus, well possible that neurons lacking APP suffer increased calcium entry during hypoxia, followed by decreased E/S coupling. Increased calcium influx through LTCC contributes to cellular dysfunction in neurodegenerative disorders, such as AD, in aging and ischemia/hypoxia induced cell death (Zhang et al., 2002; Thibault et al., 2007). Moreover, and in line with our findings, blockers of calcium channels appear to be promising neuroprotective drugs in AD (Anekonda and Quinn, 2011).
Neuroprotective role of the soluble extracellular APP fragment
Previous work has shown that many of the deficits induced by lack of APP can be rescued by selective expression of APPsα (Ring et al., 2007; Hick et al., 2015). Furthermore, APPsα was found to oppose toxic effects of amyloid β (Obregon et al., 2012; Fol et al., 2016) and to exert neuroprotective effects in hypoxia-ischemia and traumatic brain injury. In our experiments, APPsα-KI largely normalized the hypoxia-induced functional deficits, including the increased calcium influx. Whereas amyloid β disrupts calcium homeostasis via upregulation of LTCC membrane levels (Webster et al., 2006), our study indicates an opposite, calcium-stabilizing role of full-length APP and/or the APPsα fragment by inhibition of calcium influx through LTCC. The effect of the extracellularly secreted APPsα on LTCC may be exerted via ligand-like receptor binding, in contrast to intracellular interaction of APP and LTCC as suggested by Yang et al. (2009). In our experimental approach, interactions with NMDA receptors do not contribute to the protective effects of APP. We also found no evidence for increased cell death in APP−/− tissue compared with WT, both for pyramidal cells as well as for parvalbumin-expressing interneurons. The acute deficits in slices from APP−/− mice do, therefore, appear to be caused by functional, rather than structural, alterations. It is well feasible that prolonged windows of observation in vivo would reveal delayed neuronal death (Kirino et al., 1992; Martin et al., 1994) but were not detected under acute conditions.
Implications for ischemia and neurodegeneration
The protective role of APP and APPsα via control of L-type calcium channels may also be relevant for chronic neurodegeneration. Indeed, dysregulation of cellular calcium homeostasis (Green and LaFerla, 2008; Berridge, 2010) and impaired energy metabolism (de la Torre, 2002) have been suggested as pathological mechanisms in AD. On the other hand, overexpression of APP, as well as its molecular alteration or increased cleavage, leads to amyloid overloads. Animal models of Alzheimer's disease, based on APP mutations observed in familiar AD, do also show disturbed calcium homeostasis (Smith et al., 2005) and increased vulnerability to excitotoxicity (Palop et al., 2007). Thus, APP-mediated protection against hypoxia-induced functional loss and cell damage may follow a U-shaped curve, such that lack of APP is equally adverse as overexpression of mutated APP or its cleavage products.
In conclusion, we show a protective activity of APP and APPsα against hypoxia-induced loss of neuronal function. This effect may constitute a link between pathological mechanisms in AD as well as in vascular disease (Attems and Jellinger, 2014). Reconstituting calcium homeostasis under metabolic stress may be a fruitful target for new therapeutic strategies in both AD and hypoxic-ischemic brain damage.
Footnotes
This work was supported by the Deutsche Forschungsgemeinschaft Grants MU 1457/9-1, MU 1457/9-2, and DRA 326/7-2.
The authors declare no competing financial interests.
References
- Aitken PG, Tombaugh GC, Turner DA, Somjen GG. Similar propagation of SD and hypoxic SD-like depolarization in rat hippocampus recorded optically and electrically similar propagation of SD and hypoxic SD-like depolarization in rat hippocampus recorded optically and electrically. J Neurophysiol. 1998;80:1514–1521. doi: 10.1152/jn.1998.80.3.1514. [DOI] [PubMed] [Google Scholar]
- Anekonda TS, Quinn JF. Calcium channel blocking as a therapeutic strategy for Alzheimer's disease: the case for isradipine. Biochim Biophys Acta. 2011;1812:1584–1590. doi: 10.1016/j.bbadis.2011.08.013. [DOI] [PMC free article] [PubMed] [Google Scholar]
- Attems J, Jellinger KA. The overlap between vascular disease and Alzheimer's disease: lessons from pathology. BMC Med. 2014;12:206. doi: 10.1186/s12916-014-0206-2. [DOI] [PMC free article] [PubMed] [Google Scholar]
- Aydin D, Weyer SW, Müller UC. Functions of the APP gene family in the nervous system: insights from mouse models. Exp Brain Res. 2012;217:423–434. doi: 10.1007/s00221-011-2861-2. [DOI] [PubMed] [Google Scholar]
- Bahmani P, Schellenberger E, Klohs J, Steinbrink J, Cordell R, Zille M, Müller J, Harhausen D, Hofstra L, Reutelingsperger C, Farr TD, Dirnagl U, Wunder A. Visualization of cell death in mice with focal cerebral ischemia using fluorescent annexin A5, propidium iodide, and TUNEL staining. J Cereb Blood Flow Metab. 2011;31:1311–1320. doi: 10.1038/jcbfm.2010.233. [DOI] [PMC free article] [PubMed] [Google Scholar]
- Bähner F, Weiss EK, Birke G, Maier N, Schmitz D, Rudolph U, Frotscher M, Traub RD, Both M, Draguhn A. Cellular correlate of assembly formation in oscillating hippocampal networks in vitro. Proc Natl Acad Sci U S A. 2011;108:E607–E616. doi: 10.1073/pnas.1103546108. [DOI] [PMC free article] [PubMed] [Google Scholar]
- Berridge MJ. Calcium hypothesis of Alzheimer's disease. Eur J Physiol. 2010;459:441–449. doi: 10.1007/s00424-009-0736-1. [DOI] [PubMed] [Google Scholar]
- Both M, Bähner F, von Bohlen und Halbach O, Draguhn A. Propagation of specific network patterns through the mouse hippocampus. Hippocampus. 2008;18:899–908. doi: 10.1002/hipo.20446. [DOI] [PubMed] [Google Scholar]
- Burgess N, Maguire EA, O'Keefe J. The human hippocampus and spatial and episodic memory. Neuron. 2002;35:625–641. doi: 10.1016/S0896-6273(02)00830-9. [DOI] [PubMed] [Google Scholar]
- Buzsáki G, Draguhn A. Neuronal oscillations in cortical networks. Science. 2004;304:1926–1929. doi: 10.1126/science.1099745. [DOI] [PubMed] [Google Scholar]
- Cantrell AR, Catterall WA. Neuromodulation of Na+ channels: an unexpected form of cellular plasticity. Nat Rev Neurosci. 2001;2:397–407. doi: 10.1038/35077553. [DOI] [PubMed] [Google Scholar]
- Clarke J, Thornell A, Corbett D, Soininen H, Hiltunen M, Jolkkonen J. Overexpression of APP provides neuroprotection in the absence of functional benefit following middle cerebral artery occlusion in rats. Eur J Neurosci. 2007;26:1845–1852. doi: 10.1111/j.1460-9568.2007.05807.x. [DOI] [PubMed] [Google Scholar]
- Cousins SL, Hoey SE, Anne Stephenson F, Perkinton MS. Amyloid precursor protein 695 associates with assembled NR2A- and NR2B-containing NMDA receptors to result in the enhancement of their cell surface delivery. J Neurochem. 2009;111:1501–1513. doi: 10.1111/j.1471-4159.2009.06424.x. [DOI] [PubMed] [Google Scholar]
- Csicsvari J, Hirase H, Czurkó A, Mamiya A, Buzsáki G. Oscillatory coupling of hippocampal pyramidal cells and interneurons in the behaving Rat. J Neurosci. 1999;19:274–287. doi: 10.1523/JNEUROSCI.19-01-00274.1999. [DOI] [PMC free article] [PubMed] [Google Scholar]
- de la Torre JC. Vascular basis of Alzheimer's pathogenesis. Ann N Y Acad Sci. 2002;977:196–215. doi: 10.1111/j.1749-6632.2002.tb04817.x. [DOI] [PubMed] [Google Scholar]
- Dohmen C, Sakowitz OW, Fabricius M, Bosche B, Reithmeier T, Ernestus RI, Brinker G, Dreier JP, Woitzik J, Strong AJ, Graf R. Spreading depolarizations occur in human ischemic stroke with high incidence. Ann Neurol. 2008;63:720–728. doi: 10.1002/ana.21390. [DOI] [PubMed] [Google Scholar]
- Dreier JP, Major S, Manning A, Woitzik J, Drenckhahn C, Steinbrink J, Tolias C, Oliveira-Ferreira AI, Fabricius M, Hartings JA, Vajkoczy P, Lauritzen M, Dirnagl U, Bohner G, Strong AJ. Cortical spreading ischaemia is a novel process involved in ischaemic damage in patients with aneurysmal subarachnoid haemorrhage. Brain. 2009;132:1866–1881. doi: 10.1093/brain/awp102. [DOI] [PMC free article] [PubMed] [Google Scholar]
- Fol R, Braudeau J, Ludewig S, Abel T, Weyer SW, Roederer JP, Brod F, Audrain M, Bemelmans AP, Buchholz CJ, Korte M, Cartier N, Müller UC. Viral gene transfer of APPsα rescues synaptic failure in an Alzheimers disease mouse model. Acta Neuropathol. 2016;131:247–266. doi: 10.1007/s00401-015-1498-9. [DOI] [PubMed] [Google Scholar]
- Foster KA, Beaver CJ, Turner DA. Interaction between tissue oxygen tension and NADH imaging during synaptic stimulation and hypoxia in rat hippocampal slices. Neuroscience. 2005;132:645–657. doi: 10.1016/j.neuroscience.2005.01.040. [DOI] [PubMed] [Google Scholar]
- Garaschuk O, Milos RI, Konnerth A. Targeted bulk-loading of fluorescent indicators for two-photon brain imaging in vivo. Nat Protoc. 2006;1:380–386. doi: 10.1038/nprot.2006.58. [DOI] [PubMed] [Google Scholar]
- Green KN, LaFerla FM. Linking calcium to Abeta and Alzheimer's disease. Neuron. 2008;59:190–194. doi: 10.1016/j.neuron.2008.07.013. [DOI] [PubMed] [Google Scholar]
- Hick M, Herrmann U, Weyer SW, Mallm JP, Tschäpe JA, Borgers M, Mercken M, Roth FC, Draguhn A, Slomianka L, Wolfer DP, Korte M, Müller UC. Acute function of secreted amyloid precursor protein fragment APPsα in synaptic plasticity. Acta Neuropathol. 2015;129:21–37. doi: 10.1007/s00401-014-1368-x. [DOI] [PubMed] [Google Scholar]
- Hoyer A, Bardenheuer HJ, Martin E, Plaschke K. Amyloid precursor protein (APP) and its derivatives change after cellular energy depletion: an in vitro study. J Neural Transm. 2005;112:239–253. doi: 10.1007/s00702-004-0176-1. [DOI] [PubMed] [Google Scholar]
- Huchzermeyer C, Berndt N, Holzhütter HG, Kann O. Oxygen consumption rates during three different neuronal activity states in the hippocampal CA3 network. J Cereb Blood Flow Metab. 2013;33:263–271. doi: 10.1038/jcbfm.2012.165. [DOI] [PMC free article] [PubMed] [Google Scholar]
- Kann O. The energy demand of fast neuronal network oscillations: insights from brain slice preparations. Front Pharmacol. 2011;2:90. doi: 10.3389/fphar.2011.00090. [DOI] [PMC free article] [PubMed] [Google Scholar]
- Kann O, Papageorgiou IE, Draguhn A. Highly energized inhibitory interneurons are a central element for information processing in cortical networks. J Cereb Blood Flow Metab. 2014;34:1270–1282. doi: 10.1038/jcbfm.2014.104. [DOI] [PMC free article] [PubMed] [Google Scholar]
- Kirino T, Robinson HP, Miwa A, Tamura A, Kawai N. Disturbance of membrane function preceding ischemic delayed neuronal death in the gerbil hippocampus. J Cereb Blood Flow Metab. 1992;12:408–417. doi: 10.1038/jcbfm.1992.58. [DOI] [PubMed] [Google Scholar]
- Klausberger T, Magill PJ, Márton LF, Roberts JD, Cobden PM, Buzsáki G, Somogyi P. Brain-state- and cell-type-specific firing of hippocampal interneurons in vivo. Nature. 2003;421:844–848. doi: 10.1038/nature01374. [DOI] [PubMed] [Google Scholar]
- Kögel D, Deller T, Behl C. Roles of amyloid precursor protein family members in neuroprotection, stress signaling and aging. Exp Brain Res. 2012;217:471–479. doi: 10.1007/s00221-011-2932-4. [DOI] [PubMed] [Google Scholar]
- Koike MA, Lin AJ, Pham J, Nguyen E, Yeh JJ, Rahimian R, Tromberg BJ, Choi B, Green KN, LaFerla FM. APP knockout mice experience acute mortality as the result of ischemia. PLoS One. 2012;7:e42665. doi: 10.1371/journal.pone.0042665. [DOI] [PMC free article] [PubMed] [Google Scholar]
- Li ZW, Stark G, Götz J, Rülicke T, Gschwind M, Huber G, Müller U, Weissmann C. Generation of mice with a 200-kb amyloid precursor protein gene deletion by Cre recombinase-mediated site-specific recombination in embryonic stem cells. Proc Natl Acad Sci U S A. 1996;93:6158–6162. doi: 10.1073/pnas.93.12.6158. [DOI] [PMC free article] [PubMed] [Google Scholar]
- Liotta A, Rösner J, Huchzermeyer C, Wojtowicz A, Kann O, Schmitz D, Heinemann U, Kovács R. Energy demand of synaptic transmission at the hippocampal Schaffer-collateral synapse. J Cereb Blood Flow Metab. 2012;32:2076–2083. doi: 10.1038/jcbfm.2012.116. [DOI] [PMC free article] [PubMed] [Google Scholar]
- Lobner D, Lipton P. Intracellular calcium levels and calcium fluxes in the CA1 region of the rat hippocampal slice during in vitro ischemia: relationship to electrophysiological cell damage. J Neurosci. 1993;13:4861–4871. doi: 10.1523/JNEUROSCI.13-11-04861.1993. [DOI] [PMC free article] [PubMed] [Google Scholar]
- Maier N, Nimmrich V, Draguhn A. Cellular and network mechanisms underlying spontaneous sharp wave-ripple complexes in mouse hippocampal slices. J Physiol. 2003;550:873–887. doi: 10.1113/jphysiol.2003.044602. [DOI] [PMC free article] [PubMed] [Google Scholar]
- Martin RL, Lloyd HG, Cowan AI. The early events of oxygen and glucose deprivation: setting the scene for neuronal death? Trends Neurosci. 1994;17:251–257. doi: 10.1016/0166-2236(94)90008-6. [DOI] [PubMed] [Google Scholar]
- Mattson MP, Cheng B, Culwell AR, Esch FS, Lieberburg I, Rydel RE. Evidence for excitoprotective and intraneuronal calcium-regulating roles for secreted forms of the β-amyloid precursor protein. Neuron. 1993;10:243–254. doi: 10.1016/0896-6273(93)90315-I. [DOI] [PubMed] [Google Scholar]
- Milosch N, Tanriöver G, Kundu A, Rami A, François J, Baumkötter F, Weyer SW, Samanta A, Jäschke A, Brod F, Buchholz CJ, Kins S, Behl C, Müller UC, Kögel D. Holo-APP and G-protein-mediated signaling are required for sAPPa-induced activation of the Akt survival pathway. Cell Death Dis. 2014;5:e1391. doi: 10.1038/cddis.2014.352. [DOI] [PMC free article] [PubMed] [Google Scholar]
- Misonou H, Mohapatra DP, Menegola M, Trimmer JS. Calcium- and metabolic state-dependent modulation of the voltage-dependent Kv2.1 channel regulates neuronal excitability in response to ischemia. J Neurosci. 2005;25:11184–11193. doi: 10.1523/JNEUROSCI.3370-05.2005. [DOI] [PMC free article] [PubMed] [Google Scholar]
- Mullen RJ, Buck CR, Smith AM. NeuN, a neuronal specific nuclear protein in vertebrates. Development. 1992;116:201–211. doi: 10.1242/dev.116.1.201. [DOI] [PubMed] [Google Scholar]
- Nimmrich V, Maier N, Schmitz D, Draguhn A. Induced sharp wave-ripple complexes in the absence of synaptic inhibition in mouse hippocampal slices. J Physiol. 2005;563:663–670. doi: 10.1113/jphysiol.2004.079558. [DOI] [PMC free article] [PubMed] [Google Scholar]
- O'Brien RJ, Wong PC. Amyloid precursor protein processing and Alzheimer's disease. Annu Rev Neurosci. 2011;34:185–204. doi: 10.1146/annurev-neuro-061010-113613. [DOI] [PMC free article] [PubMed] [Google Scholar]
- Obregon D, Hou H, Deng J, Giunta B, Tian J, Darlington D, Shahaduzzaman M, Zhu Y, Mori T, Mattson MP, Tan J. sAPP-α modulates β-secretase activity and amyloid-β generation. Nat Commun. 2012;3:777. doi: 10.1038/ncomms1781. [DOI] [PMC free article] [PubMed] [Google Scholar]
- Palop JJ, Chin J, Roberson ED, Wang J, Thwin MT, Bien-Ly N, Yoo J, Ho KO, Yu GQ, Kreitzer A, Finkbeiner S, Noebels JL, Mucke L. Aberrant excitatory neuronal activity and compensatory remodeling of inhibitory hippocampal circuits in mouse models of Alzheimer's disease. Neuron. 2007;55:697–711. doi: 10.1016/j.neuron.2007.07.025. [DOI] [PMC free article] [PubMed] [Google Scholar]
- Pfeiffer T, Draguhn A, Reichinnek S, Both M. Optimized temporally deconvolved Ca2+ imaging allows identification of spatiotemporal activity patterns of CA1 hippocampal ensembles. Neuroimage. 2014;94:239–249. doi: 10.1016/j.neuroimage.2014.03.030. [DOI] [PubMed] [Google Scholar]
- Price JL, Ko AI, Wade MJ, Tsou SK, McKeel DW, Morris JC. Neuron number in the entorhinal cortex and CA1 in preclinical Alzheimer disease. Arch Neurol. 2001;58:1395–1402. doi: 10.1001/archneur.58.9.1395. [DOI] [PubMed] [Google Scholar]
- Reichinnek S, Künsting T, Draguhn A, Both M. Field potential signature of distinct multicellular activity patterns in the mouse hippocampus. J Neurosci. 2010;30:15441–15449. doi: 10.1523/JNEUROSCI.2535-10.2010. [DOI] [PMC free article] [PubMed] [Google Scholar]
- Ring S, Weyer SW, Kilian SB, Waldron E, Pietrzik CU, Filippov MA, Herms J, Buchholz C, Eckman CB, Korte M, Wolfer DP, Müller UC. The secreted beta-amyloid precursor protein ectodomain APPs alpha is sufficient to rescue the anatomical, behavioral, and electrophysiological abnormalities of APP-deficient mice. J Neurosci. 2007;27:7817–7826. doi: 10.1523/JNEUROSCI.1026-07.2007. [DOI] [PMC free article] [PubMed] [Google Scholar]
- Sanchez MM, Moghadam S, Naik P, Martin KJ, Salehi A. Hippocampal network alterations in Alzheimer's disease and Down syndrome: from structure to therapy. J Alzheimers Dis. 2011;26:29–47. doi: 10.1177/1533317510391241. [DOI] [PubMed] [Google Scholar]
- Schmidt-Kastner R, Freund TF. Selective vulnerability of the hippocampus in brain ischemia. Neuroscience. 1991;40:599–636. doi: 10.1016/0306-4522(91)90001-5. [DOI] [PubMed] [Google Scholar]
- Schurr A, Payne RS, Miller JJ, Rigor BM. Study of cerebral energy metabolism using the rat hippocampal slice preparation. Methods. 1999;18:117–126. doi: 10.1006/meth.1999.0765. [DOI] [PubMed] [Google Scholar]
- Smith IF, Green KN, LaFerla FM. Calcium dysregulation in Alzheimer's disease: recent advances gained from genetically modified animals. Cell Calcium. 2005;38:427–437. doi: 10.1016/j.ceca.2005.06.021. [DOI] [PubMed] [Google Scholar]
- Smith P, Reid DB, Environment C, Palo L, Alto P, Smith PL. A threshold selection method from gray-level histograms. Trans Syst Cybern. 1979;9:62–66. doi: 10.1109/TSMC.1979.4310076. [DOI] [Google Scholar]
- Smith-Swintosky VL, Pettigrew LC, Craddock SD, Culwell AR, Rydel RE, Mattson MP. Secreted forms of beta-amyloid precursor protein protect against ischemic brain injury. J Neurochem. 1994;63:781–784. doi: 10.1046/j.1471-4159.1994.63020781.x. [DOI] [PubMed] [Google Scholar]
- Somjen GG. Mechanisms of spreading depression and hypoxic spreading depression-like depolarization. Physiol Rev. 2001;81:1065–1096. doi: 10.1046/j.1471-4159.1994.63020781.x. [DOI] [PubMed] [Google Scholar]
- Thibault O, Gant JC, Landfield PW. Expansion of the calcium hypothesis of brain aging and Alzheimer's disease: minding the store. Aging Cell. 2007;6:307–317. doi: 10.1111/j.1474-9726.2007.00295.x. [DOI] [PMC free article] [PubMed] [Google Scholar]
- Thornton E, Vink R, Blumbergs PC, Van Den Heuvel C. Soluble amyloid precursor protein alpha reduces neuronal injury and improves functional outcome following diffuse traumatic brain injury in rats. Brain Res. 2006;1094:38–46. doi: 10.1016/j.brainres.2006.03.107. [DOI] [PubMed] [Google Scholar]
- Van den Heuvel C, Blumbergs PC, Finnie JW, Manavis J, Jones NR, Reilly PL, Pereira RA. Upregulation of amyloid precursor protein messenger RNA in response to traumatic brain injury: an ovine head impact model. Exp Neurol. 1999;159:441–450. doi: 10.1006/exnr.1999.7150. [DOI] [PubMed] [Google Scholar]
- Verret L, Mann EO, Hang GB, Barth AM, Cobos I, Ho K, Devidze N, Masliah E, Kreitzer AC, Mody I, Mucke L, Palop JJ. Inhibitory interneuron deficit links altered network activity and cognitive dysfunction in Alzheimer model. Cell. 2012;149:708–721. doi: 10.1016/j.cell.2012.02.046. [DOI] [PMC free article] [PubMed] [Google Scholar]
- Webster NJ, Ramsden M, Boyle JP, Pearson HA, Peers C. Amyloid peptides mediate hypoxic increase of L-type Ca2+ channels in central neurones. Neurobiol Aging. 2006;27:439–445. doi: 10.1016/j.neurobiolaging.2005.02.002. [DOI] [PubMed] [Google Scholar]
- Weyer SW, Klevanski M, Delekate A, Voikar V, Aydin D, Hick M, Filippov M, Drost N, Schaller KL, Saar M, Vogt MA, Gass P, Samanta A, Jäschke A, Korte M, Wolfer DP, Caldwell JH, Müller UC. APP and APLP2 are essential at PNS and CNS synapses for transmission, spatial learning and LTP. EMBO J. 2011;30:2266–2280. doi: 10.1038/emboj.2011.119. [DOI] [PMC free article] [PubMed] [Google Scholar]
- Yang L, Wang Z, Wang B, Justice NJ, Zheng H. Amyloid precursor protein regulates Cav1.2 L-type calcium channel levels and function to influence GABAergic short-term plasticity. J Neurosci. 2009;29:15660–15668. doi: 10.1523/JNEUROSCI.4104-09.2009. [DOI] [PMC free article] [PubMed] [Google Scholar]
- Yu SP, Yeh CH, Sensi SL, Gwag BJ, Canzoniero LM, Farhangrazi ZS, Ying HS, Tian M, Dugan LL, Choi DW. Mediation of neuronal apoptosis by enhancement of outward potassium current. Science. 1997;278:114–117. doi: 10.1126/science.278.5335.114. [DOI] [PubMed] [Google Scholar]
- Zhang C, Shen W, Zhang G. N-Methyl-D-aspartate receptor and L-type voltage-gated Ca(2+) channel antagonists suppress the release of cytochrome c and the expression of procaspase-3 in rat hippocampus after global brain ischemia. Neurosci Lett. 2002;328:265–268. doi: 10.1016/S0304-3940(02)00543-8. [DOI] [PubMed] [Google Scholar]
- Zhang X, Le W. Pathological role of hypoxia in Alzheimer's disease. Exp Neurol. 2010;223:299–303. doi: 10.1016/j.expneurol.2009.07.033. [DOI] [PubMed] [Google Scholar]
- Zhang X, Herrmann U, Weyer SW, Both M, Müller UC, Korte M, Draguhn A. Hippocampal network oscillations in APP/APLP2-deficient mice. PLoS One. 2013;8:e61198. doi: 10.1371/journal.pone.0061198. [DOI] [PMC free article] [PubMed] [Google Scholar]