

Abstract
Neural stem cells in two neurogenic regions, the subventricular zone and the subgranular zone (SGZ) of the hippocampal dentate gyrus, can divide and produce new neurons throughout life. Hippocampal neurogenesis is related to emotions, including depression/anxiety, and the therapeutic effects of antidepressants, as well as learning and memory. The establishment of in vivo imaging for proliferative activity of neural stem cells in the SGZ might be used to diagnose depression and to monitor the therapeutic efficacy of antidepressants. Positron emission tomography (PET) imaging with 3′-deoxy-3′-[18F]fluoro-l-thymidine ([18F]FLT) has been studied to allow visualization of proliferative activity in two neurogenic regions of adult mammals; however, the PET imaging has not been widely used because of lower accumulation of [18F]FLT, which does not allow quantitative assessment of the decline in cellular proliferative activity in the SGZ under the condition of depression. We report the establishment of an enhanced PET imaging method with [18F]FLT combined with probenecid, an inhibitor of drug transporters at the blood–brain barrier, which can allow the quantitative visualization of neurogenic activity in rats. Enhanced PET imaging allowed us to evaluate reduced cell proliferation in the SGZ of rats with corticosterone-induced depression, and further the recovery of proliferative activity in rats under treatment with antidepressants. This enhanced [18F]FLT-PET imaging technique with probenecid can be used to assess the dynamic alteration of neurogenic activity in the adult mammalian brain and may also provide a means for objective diagnosis of depression and monitoring of the therapeutic effect of antidepressant treatment.
SIGNIFICANCE STATEMENT Adult hippocampal neurogenesis may play a role in major depression and antidepressant therapy. Establishment of in vivo imaging for hippocampal neurogenic activity may be useful to diagnose depression and monitor the therapeutic efficacy of antidepressants. Positron emission tomography (PET) imaging has been studied to allow visualization of neurogenic activity; however, PET imaging has not been widely used due to the lower accumulation of the PET tracer in the neurogenic regions. Here, we succeeded in establishing highly quantitative PET imaging for neurogenic activity in adult brain with an inhibitor for drug transporter. This enhanced PET imaging allowed evaluation of the decline of neurogenic activity in the hippocampus of rats with depression and the recovery of neurogenic activity by antidepressant treatment.
Keywords: depression, drug transporters, neurogenesis, PET imaging, SSRI
Introduction
Neural stem cells reside mainly in the subventricular zone (SVZ), adjacent to the lateral ventricles and in the subgranular zone (SGZ) of the dentate gyrus (DG) in the hippocampus, and continuously produce new neurons throughout life (Altman and Das, 1965; Doetsch et al., 1999). These phenomena occur in these neurogenic regions of the adult brain in rodents as well as in primates, including humans (Eriksson et al., 1998; Gould et al., 1999; Kornack and Rakic, 1999, 2001; Spalding et al., 2013). Hippocampal neurogenesis is associated with learning and memory (Imayoshi et al., 2008; Aizawa et al., 2009). Altered neurogenesis in the hippocampus has been implicated in major depression (Cameron and Gould, 1994; Czéh et al., 2001; Malberg and Duman, 2003; Snyder et al., 2011). In addition, long-term administration of antidepressants may affect depressive-like behaviors through stimulation of hippocampal neurogenesis (Malberg et al., 2000; Santarelli et al., 2003). These findings suggest the hypotheses that decreased neurogenesis leads to depression and that enhancement of hippocampal neurogenesis is required for therapeutic effects on depression. Thus, the establishment of in vivo imaging for neurogenic activity in the hippocampus might help to diagnose depression and to monitor the therapeutic efficacy of antidepressants.
So far, magnetic resonance imaging (MRI) and positron emission tomography (PET) are available as noninvasive in vivo neuroimaging modalities. There are some reports describing in vivo imaging of endogenous neural stem/progenitor cells using these imaging modalities. Endogenous neural stem/progenitor cell migration can be visualized using MRI (Shapiro et al., 2006; Sumner et al., 2009; Granot et al., 2011; Vande Velde et al., 2012). However, there are some limitations to these MRI techniques. Neural stem/progenitor cells have to be labeled with MRI contrast agents by injection into target regions locally and directly. Further, MRI contrast agents were nonselectively incorporated both into proliferating and nonproliferating cells (Sumner et al., 2009). Thus, this strategy does not allow us to noninvasively visualize proliferative activity in the neurogenic regions. On the other hand, PET imaging with a radiotracer, 3′-deoxy-3′-[18F]fluoro-l-thymidine ([18F]FLT), was reported to noninvasively visualize proliferative activity in the neurogenic regions in the rat brain (Rueger et al., 2010). However, regarding the [18F]FLT-PET imaging, it has been hard to quantify decreased cell proliferation in the neurogenic regions, because of lower differences in [18F]FLT signals between the neurogenic regions and other areas. Such lower differences in [18F]FLT signals could be attributed to lower penetration rates of [18F]FLT from the circulation to the brain parenchyma through the blood–brain barrier (BBB). If this issue is resolved, [18F]FLT-PET imaging may be a useful tool to evaluate the alteration of cell proliferation in neurogenic regions, and also to diagnose depression and to monitor the therapeutic efficacy of antidepressants.
Accumulation of several drugs in the brain is limited by drug transporters at the BBB. Drug transporters at the BBB include ATP-binding cassette (ABC) transporters, such as ABCB1 [P-glycoprotein (P-gp)], ABCG2 and ABCCs [multidrug-related resistance proteins (Mrps)], as well as solute carrier proteins, such as organic anion transporter 3 (OAT3/SLC22A8; Schinkel et al., 1996; Wijnholds et al., 2000; Sugiyama et al., 2001). The accumulation of some PET radiotracers in the brain has been improved by pretreatment with transporter inhibitors for ABCB1 (Syvänen et al., 2006; Laćan et al., 2008) or ABCG2 (Wanek et al., 2012). Based on these findings, we hypothesized that inhibitors of drug efflux transporters at the BBB could enhance brain accumulation of [18F]FLT and could improve the [18F]FLT accumulation in the neurogenic regions in PET imaging.
In the present study, we showed that probenecid, an inhibitor of ABCCs and OAT3 at the BBB, enhanced the accumulation of [18F]FLT in the brain using both ex vivo autoradiography and in vivo PET imaging studies, and that such enhanced [18F]FLT-PET imaging with probenecid successfully allowed visualization of the alteration of cellular proliferative activity in the DG under corticosterone (CORT)-induced depression and/or recovery by treatment with a serotonin-specific reuptake inhibitor (SSRI).
Materials and Methods
Animals.
Adult male Wistar rats (SLC, Hamamatsu; 8–12 weeks old) were used for all experiments. All experimental protocols were approved by the Ethical Committee on Animal Care and Use of RIKEN and were performed in accordance with the Principles of Laboratory Animal Care (NIH publication No. 85-23, revised 1985).
Preparation of inhibitors of drug efflux transporters.
In this study, we used inhibitors of two different types of drug efflux transporters: cyclosporine A (CsA) as an ABCB1 (P-gp) inhibitor; and probenecid as an inhibitor of ABCCs and OAT3. CsA (50 mg/ml; Sandimmune) was purchased from Novartis. Probenecid was purchased from Sigma-Aldrich. A probenecid solution (50 mg/ml) was prepared by dissolving it with distilled water, including NaOH, and adjusting it to pH 7.4 with HCl. CsA has been reported to inhibit ABCB1 (P-gp) at the BBB and to enhance brain accumulation of a PET tracer at 25 mg/kg (Syvänen et al., 2006). Additionally, probenecid increased brain concentrations of some compounds at 50–70 mg/kg (Awasthi et al., 2011; Töllner et al., 2015). In this study, CsA and probenecid were used at injected doses of 25–50 and 10–100 mg/kg, respectively.
Administration of corticosterone and fluoxetine.
CORT suspension was prepared with sesame oil at 33.3 mg/ml (Hellsten et al., 2002). Either the CORT suspension (40 mg/kg/d) or vehicle (sesame oil) was subcutaneously injected once a day for 4 weeks. Subcutaneous administration of CORT at such a dose for >2 weeks has been known to suppress neurogenesis in the hippocampal dentate gyrus of the adult brain (Wong and Herbert, 2006; Qiu et al., 2007; Brummelte and Galea, 2010). Fluoxetine (FLX) was dissolved in sterile saline at 5 mg/ml (Malberg et al., 2000, Kodama et al., 2004). Either the FLX solution (5 mg/kg/d) or saline was intraperitoneally injected once a day for 4 weeks. FLX enhanced cellular proliferation in the SGZ of the adult hippocampus by continuous treatment for >3 weeks (Huang and Herbert, 2006; Pinnock et al., 2009). The body weight of each rat was measured twice a week after injection of the drugs. The rats were divided into four groups in this study. In the control group (n = 6), sesame oil and saline, as vehicles of CORT and FLX, respectively, were administered to the animals. In the CORT group (n = 6), CORT and saline were injected into the animals. In the FLX group (n = 6), sesame oil and FLX were injected into the animals. In the CORT plus FLX group (n = 6), both CORT and FLX were administered to the animals.
Radiosynthesis of [18F]FLT.
[18F]FLT was synthesized according to previous reports (Yun et al., 2003). The chemical purity and specific activity of [18F]FLT were >98% and 109–1971 GBq/μmol, respectively.
Ex vivo autoradiography study.
Rats were pretreated with vehicle, CsA, or probenecid and were then intravenously injected with a short bolus of [18F]FLT (∼0.2 MBq/g) at 5–10 min after pretreatment with inhibitors of the drug efflux transporters. Rats were perfused with cold saline solution under deep anesthesia with 4.0% isoflurane at 60 min after injection of [18F]FLT, and the whole brain was immediately removed. The coronal brain was cut, on ice, into slices 1 mm thick and were directly exposed to an imaging plate (BAS-SR2040, Fuji Photo Film Co.) for 20 min in the dark. The distribution of radioactivity was visualized using a bioimaging analyzer (FLA-7000IR, Fuji Photo Film Co.).
In vivo PET imaging study.
Small-animal PET imaging studies were performed using microPET Focus 220 scanners (Siemens). Rats were anesthetized with a mixture of 1.5% isoflurane and N2O:O2 (7:3) gas and were placed on a heating pad to maintain their body temperature at 37°C during the PET scan. Before PET scanning, rats were intravenously injected with vehicle or probenecid and then were intravenously administered [18F]FLT 5–10 min after the injection. An emission scan was started immediately after injection of [18F]FLT and was performed for 90 min. The emission data were framed into a dynamic sequence of 41 time frames (6 × 10 s, 6 × 30 s, 11 × 60 s, 15 × 180 s, 3 × 600 s). PET images were reconstructed using a filtered backprojection algorithm and were analyzed using ASIPro VM (version 6.0; Concorde Microsystems) and PMOD (version 3.4; PMOD Technologies LLC) software. The PET and MR images were coregistered using the PMOD software. MR images were obtained from nontreated rats used for the PET study using a 7 tesla MR scanner (BioSpec 70/20 USR, Bruker) under isoflurane anesthesia. Volumetric regions of interest (VOIs) were placed on the two neurogenic regions (DG in the hippocampus and SVZ in the lateral ventricle) and the reference region, which were specifically determined based on the MR images. The thalamus was used as a reference region in this study since the proliferating cells are very rare in this region. Regional time–activity curves were calculated for the two neurogenic regions and a reference region based on VOIs. Relative [18F]FLT uptake in each brain region was calculated as a standardized uptake value (SUV) based on average radioactivity concentration. In control-, CORT-, FLX-, and CORT plus FLX-treated animals, mean SUVs in each region were determined by count data normalized to those in the whole brain to minimize variations in the brain uptake of [18F]FLT among individuals.
Immunohistochemistry.
After PET scanning, some of the animals were deeply anesthetized with 4.0% isoflurane and perfused transcardially with 10 mm PBS, pH 7.4. Brains were removed and fixed in 4% formaldehyde buffered with 10 mm PBS at 4°C overnight, and then immersed in a 30% (w/v) sucrose solution at 4°C for 2–3 d. Coronal brain sections (30 μm thickness) were prepared with a cryostat and collected as free-floating sections. The coronal sections were incubated with blocking solution, including 5% donkey serum, at room temperature and then incubated with polyclonal rabbit anti-Ki67 IgG (1:1000; NovoCastra) at 4°C for 12–15 h. After washing for 30 min (three washes of 10 min) with PBS including 0.3% Triton X-100 (PBST), brain sections were incubated in the Cy3-conjugated secondary antibody (1:200; Jackson ImmunoResearch) at 4°C for 4 h and washed with PBST for 30 min. The staining sections were mounted with a Hoechst dye 33258-containing solution (Nacalai Tesque) and were examined using a confocal laser microscope (Digital Eclipse C1, Nikon).
Cell-counting procedure.
For cell counting, five coronal sections in each animal were randomly selected from 2.80 to 3.80 mm posterior to the bregma for the DG in the hippocampus. The number of Ki67-immunopositive cells was evaluated in the SGZ and the hilus of the hippocampal DG. The cell density of Ki67-expressing cells in the SGZ was estimated from the number of Ki67-immunopositive cells per 100 μm thickness.
Statistical analysis.
Data from each animal were presented as the mean ± SD. Data for all experiments were analyzed using one-way ANOVA and the Tukey post hoc test for multiple comparisons. A significance threshold was assumed at p < 0.05. Pearson's correlation analysis was performed between the SUV and the number of Ki67-immunopositive cells.
Results
Probenecid, an inhibitor of ABCCs and OAT3, enhanced brain uptake of [18F]FLT
We assessed the effects of several inhibitors of drug efflux transporters on the accumulation of [18F]FLT in the brain by ex vivo autoradiography studies. In this study, we used CsA, an inhibitor of ABCB1 (P-gp), and probenecid, an inhibitor of ABCCs (Mrps) and OAT3. It is known that CsA and probenecid increased brain concentrations of several compounds by the inhibition of these drug efflux transporters at doses of 25 and 50 mg/kg, respectively (Syvänen et al., 2006; Töllner et al., 2015). Probenecid (10 or 30 mg/kg) facilitated brain uptake of [18F]FLT and induced enhancement of [18F]FLT accumulation in two neurogenic regions relative to the vehicle-treated rats (Fig. 1A), whereas CsA had little or no effect even at a dose of 50 mg/kg (Fig. 1B). The effects of probenecid on the brain uptake of [18F]FLT showed dose dependency (Fig. 1C). These data suggest that [18F]FLT is a specific substrate for ABCCs (Mrps) and/or OAT3 at the BBB, but not for ABCB1.
Figure 1.
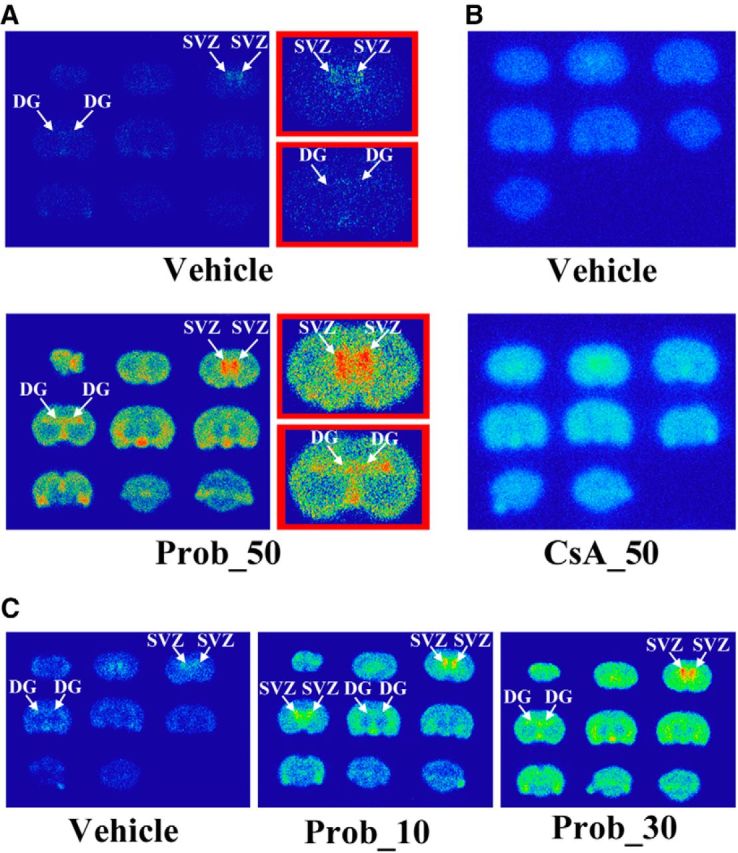
Effects of drug transporter inhibitors on the brain uptake of [18F]FLT with an ex vivo study. A, B, Representative [18F]FLT autoradiogram of the coronal brain slices with probenecid 50 mg/kg (Prob_50; A) or cyclosporine A 50 mg/kg (CsA_50; B). Magnified views are shown in red boxes. C, Autoradiogram of the coronal brain slices after the administration of [18F]FLT with vehicle (left) or probenecid 10 mg/kg (middle), or probenecid 30 mg/kg (right). Arrows show the SVZ of the lateral ventricle or the DG of the hippocampus.
Pretreatment with probenecid led to enhancement of [18F]FLT signals from two neurogenic regions on PET imaging
We investigated the effects of probenecid on [18F]FLT-PET imaging in vivo. Figure 2 showed time–activity curves obtained from [18F]FLT-PET imaging in the two neurogenic regions (Fig. 2A, SVZ, B, DG of the hippocampus) and in the reference region (Fig. 2C). In both the vehicle group and the probenecid (30 and 100 mg/kg) group, SUVs of [18F]FLT in the two neurogenic regions reached a plateau at 45 min and sustained that level until 90 min after the injection. In both neurogenic regions, the SUVs in the probenecid (100 mg/kg)-pretreated rats were obviously higher than those in the vehicle-pretreated rats 45–90 min after the injection. Thus, PET images were averaged from 45 to 90 min in the two neurogenic regions of rats with or without probenecid pretreatment (Fig. 3A,B). The averaged images indicated that [18F]FLT accumulation in the probenecid-treated rats was clearly enhanced in both neurogenic regions relative to the vehicle-treated rats. Indeed, the mean values of the SUVs in the two neurogenic regions of the probenecid (100 mg/kg)-treated rats were 0.242 ± 0.012 in the SVZ and 0.208 ± 0.013 in the DG, whereas SUVs in the vehicle group were 0.129 ± 0.009 in the SVZ and 0.127 ± 0.014 in the DG, as shown in Figure 3C. And, SUVs in the probenecid (30 mg/kg)-treated rats were 0.199 ± 0.018 in the SVZ and 0.185 ± 0.016 in the DG (Fig. 3C). The SUVs in the two neurogenic regions were increased ∼1.6-fold to 1.9-fold by pretreatment with probenecid at a high concentration of 100 mg/kg, and ∼1.4-fold to 1.5-fold at a low concentration of 30 mg/kg compared with the vehicle group (Fig. 3C). These data demonstrate the concentration-dependent promoting effect of probenecid on [18F]FLT brain uptake on in vivo PET imaging as well as ex vivo autoradiography.
Figure 2.
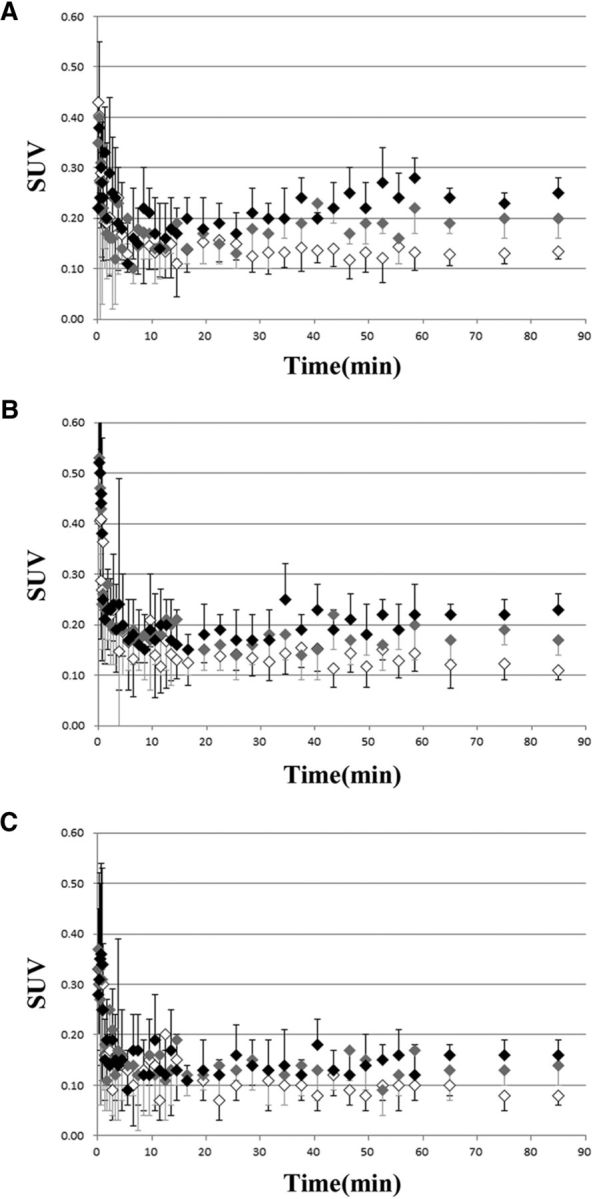
A–C, Time–activity curves in SVZ (A), DG (B), and thalamus (C) with or without probenecid in [18F]FLT-PET. Vehicle-treated group (n = 8), probenecid 30 mg/kg-treated group (n = 7), and probenecid 100 mg/kg-treated group (n = 7) are shown as white diamonds, gray diamonds, and black diamonds, respectively. Data are expressed as the mean ± SD.
Figure 3.
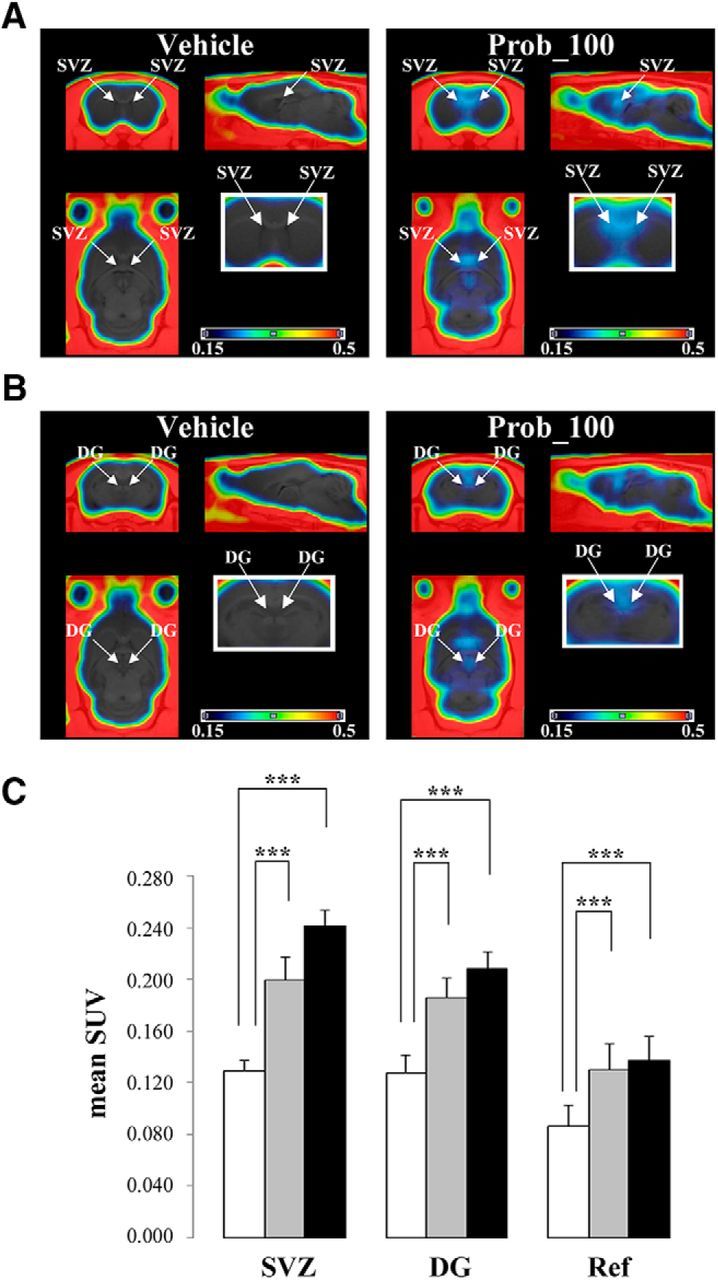
Enhanced [18F]FLT accumulation in two neurogenic regions of probenecid-treated rats. A, B, PET images were averaged from 45 to 90 min after the injection of [18F]FLT. These images represent SUVs. Comparison of averaged PET images of [18F]FLT in both the SVZ (A) and the DG (B) of the vehicle-treated group (left) and the probenecid (100 mg/kg)-treated group (right). Arrows point to PET signals in the SVZ or the DG of the hippocampus. Magnified coronal images are shown in white boxes. All images are adjusted to the same intensity scale (0.15–0.50 SUV). C, Mean SUVs in the two neurogenic regions (SVZ and DG) and reference region (Ref; thalamus) of the vehicle-treated group (white bar; n = 8), probenecid 30 mg/kg-treated group (gray bar; n = 7), and probenecid 100 mg/kg-treated group (black bar, n = 7). Data are expressed as the mean ± SD. Significantly different from vehicle-treated rats, ***p < 0.001.
Enhanced [18F]FLT-PET imaging with probenecid demonstrated the quantitative assessment of cell proliferative activity in the hippocampal DG of CORT- and/or FLX-treated rats
Long-term CORT administration is known to suppress progenitor cell proliferation in the hippocampal dentate gyrus of the adult brain (Wong and Herbert, 2006; Qiu et al., 2007; Brummelte and Galea, 2010). In addition, FLX, an SSRI, has been reported to alleviate the decline of hippocampal neurogenesis in chronic stress-induced depression models in rodents (Santarelli et al., 2003) as well as in nonhuman primates (Perera et al., 2011). We investigated whether enhanced [18F]FLT-PET imaging with probenecid would allow the visualization of both suppressed cell proliferation in the SGZ of the DG by CORT administration and the alleviating effect of FLX on CORT-induced decline of cell proliferation in the hippocampus. The injection of CORT has been reported to decrease body weight gain (Hellsten et al., 2002; Brummelte and Galea, 2010). We confirmed that CORT administration reduced body weight gain in rats compared with the vehicle-treated group in the present study (vehicle group, 56.2 ± 15.8 g; CORT group, 12.7 ± 11.1 g). Enhanced [18F]FLT-PET imaging with probenecid (100 mg/kg) was performed in the control (CORT−/FLX−), CORT (CORT+/FLX−), FLX (CORT−/FLX+), and CORT plus FLX (CORT+/FLX+) groups. PET images of two neurogenic regions in each group were shown in Figure 4A. As shown in Figure 4B, mean SUVs in the SVZ did not show any differences among the four groups (control group, 0.289 ± 0.017; CORT group, 0.294 ± 0.014; FLX group, 0.292 ± 0.021; CORT plus FLX group, 0.289 ± 0.012). In the hippocampal DG, [18F]FLT accumulation in CORT-treated rats was less than that in the other three groups (control, FLX, and CORT plus FLX groups; Fig. 4A): the mean SUV in the control group was 0.267 ± 0.014, whereas that in the CORT-treated group was 0.236 ± 0.017 (Fig. 4B). From these data, the decline of proliferative activity in the DG of the hippocampus in CORT-treated rats could be quantitatively visualized using this enhanced [18F]FLT-PET imaging. In addition, the mean SUV in the hippocampal DG of CORT plus FLX-treated rats was 0.266 ± 0.015, which was similar to that in the control group (Fig. 4B). Thus, the recovery of proliferative activity in the DG by treatment with FLX could be also visualized with the enhanced PET imaging method. Moreover, SUV in the DG of FLX-treated group was 0.270 ± 0.005 (Fig. 4B). Like in the SVZ, there was no difference in mean SUVs in the thalamus (reference region) among the four groups (Fig. 4B). These data suggest that this enhanced PET imaging technique allows quantitative evaluation of the decrease or increase in proliferative activity in defined spatial structures in the brain.
Figure 4.

Assessment of cell proliferation in CORT- and/or FLX-treated hippocampal DG using [18F]FLT-PET with probenecid. A, Representative coronal averaged PET images (45–90 min) of [18F]FLT in the SVZ and DG of each group (control-, CORT-, FLX-, and CORT plus FLX-treated rats). Magnified images in DG are shown below. All images are adjusted to the same intensity scale (0.16–0.80 SUV). Arrows point to PET signals in the SVZ or the DG of hippocampus. B, Mean SUVs in two neurogenic regions (SVZ and DG) and the reference region (Ref; thalamus) of the control group (white bar; n = 6), CORT-treated rats (pink bar; n = 6), FLX-treated rats (green bar; n = 6), and both CORT plus FLX-treated rats (blue bar; n = 6). Data are expressed as the mean ± SD. Significantly different from CORT-treated group, *p < 0.05, **p < 0.01.
To confirm these data obtained from [18F]FLT-PET imaging with probenecid, we performed a histological evaluation of the number of proliferating cells in brain sections obtained from the same CORT-treated and/or FLX-treated rats following PET scanning. Immunohistochemical assessment of Ki67 is frequently used to validate the data on cell proliferative activity in tumors obtained by PET imaging with [18F]FLT in humans and rodents (Chen et al., 2005; Shah et al., 2009). The number of Ki67-immunopositive cells evaluated in the SGZ of the DG in rats treated with CORT for 4 weeks was ∼45% lower than that in the control group (Fig. 5A,B). Moreover, coadministration of FLX with CORT did not show such a decline in the number of Ki67+-immunopositive cells in the SGZ of the DG (Fig. 5A,B). In contrast to the SGZ of the DG, the immunostaining data showed that the number of Ki67+-immunopositive cells in the hilus of the DG was not affected by administration of CORT and/or FLX (Fig. 5B). These data suggest that our PET data in the DG of CORT- and/or FLX-treated rats correspond to the cellular proliferative activity of neural stem/progenitor cells in the SGZ of the DG, but not to other cells in the hilus. Furthermore, we investigated the correlation between mean SUVs and Ki67 expression in the DGs of each group. In Figure 5C, mean SUVs correlated significantly with the cell densities of Ki67-expressing cells (p < 0.0001; r2 = 0.6589). From these findings, this enhanced [18F]FLT-PET imaging with probenecid can quantitatively and noninvasively evaluate cellular proliferation in the adult brain in vivo, and this PET imaging method can be a useful tool with which to diagnose depression and to monitor the therapeutic efficacy of antidepressants.
Figure 5.

Comparison of the number of Ki67+ dividing cells in the hippocampal DG of the CORT- and/or the FLX-treated rats. A, Confocal images of Ki67-expressing cells in the DG of each group (control-, CORT-, FLX-, and CORT plus FLX-treated rats). Arrowheads show Ki67-immunopositive cells in the SGZ of the DG. Scale bar, 100 μm. B, The number of Ki67-expressing proliferating cells in the SGZ and hilus of the DG in the control group (white bar; n = 6), CORT-treated rats (pink bar; n = 6), FLX-treated rats (green bar; n = 6), and CORT plus FLX-treated rats (blue bar; n = 5). Data are expressed as the mean ± SD. Significantly different from the control group, ***p < 0.001. C, Correlation between [18F]FLT accumulation and Ki67 expression in the DG of each group [control group, white diamonds (n = 6); CORT group, pink diamonds (n = 6); FLX group, green diamonds (n = 6); CORT plus FLX group, blue diamonds (n = 5)].
Discussion
In this study, we demonstrated that this enhanced [18F]FLT-PET imaging with an inhibitor of ABCCs and OAT3 could be used to assess the cell-proliferative activity in the neurogenic regions of adult rats noninvasively and quantitatively. Until now, there has been one previous report (Rueger et al., 2010) studying the cell proliferation in the same neurogenic regions of normal adult rats by using [18F]FLT-PET. The study demonstrated the quantitative evaluation of increased numbers of neural stem cells induced by pathological conditions with tissue damage (Rueger et al., 2010). However, it is extremely difficult to assess the decline of cell proliferation in two neurogenic regions in physiological or pathological conditions because of the lower accumulation of [18F]FLT in the two neurogenic regions. Indeed, we confirmed that [18F]FLT-PET imaging could not detect decreased SUVs in the DG of CORT-treated rats without pretreatment of probenecid (control group, 0.129 ± 0.018, n = 5; CORT group, 0.123 ± 0.015, n = 6). If this problem is resolved, [18F]FLT-PET imaging could be used to assess decreased cell proliferation in the hippocampal DG of rats with stress-induced depression. To overcome this issue, we focused on drug efflux transporters at the BBB. Drug efflux transporters at the BBB limit the penetration of tracer compounds used for in vivo imaging into the brain (Syvänen et al., 2006; Wanek et al., 2012; Bakhsheshian et al., 2013; Römermann et al., 2013). Therefore, the inhibitors of drug efflux transporters might enhance brain uptake of [18F]FLT and improve PET imaging. We investigated the accelerating effect of some inhibitors of drug efflux transporters on the brain accumulation of [18F]FLT with ex vivo autoradiography and in vivo PET imaging. Probenecid, an inhibitor of ABCCs (Mrps) and/or OAT3 increased the brain uptake of [18F]FLT in a dose-dependent manner (Fig. 1). In addition, probenecid increased the brain uptake of [18F]FLT in adult rats on in vivo PET imaging (Figs. 2, 3). Also, SUVs in two neurogenic regions were ∼1.4-fold to 1.9-fold higher than in the reference region (Fig. 3C). Therefore, this enhanced [18F]FLT-PET imaging with probenecid could allow the quantitative evaluation of cellular proliferative activity in the two neurogenic regions of the adult brain and might be more suitable in the assessment of the reduced number of proliferating cells under pathological conditions in vivo. Actually, we successfully demonstrated that enhanced [18F]FLT-PET imaging could show the alteration of cellular proliferative activity in the hippocampal DG of rats with CORT-induced depression and the recovery by treatment with an SSRI in rats (Fig. 4). In the CORT-treated rats, mean SUVs in the DG of the hippocampus were 0.246 ± 0.020 for 3-week treatment (n = 9) and 0.236 ± 0.017 for 4-week treatment (n = 6), indicating that the effect of CORT on proliferative activity in the DG was dependent on the treatment period. In the FLX-treated group, the mean SUV in the DG was similar to that in the control group (Fig. 4B). These PET data were supported by the data of Ki67-immunopositive cells in the DG (Fig. 5B). Furthermore, the SUVs for [18F]FLT accumulation in the DG with PET imaging positively correlated with the number of Ki67-immunopositive cells (Fig. 5C). In addition to the DG, the SUVs in the SVZ (Fig. 4B) also tended to correlate with the number of Ki67-immunopositive cells. Indeed, the numbers of Ki67-immunopositive cells in the SVZ were 430 ± 27, 424 ± 27, 434 ± 22, and 420 ± 36 cells/mm2, respectively, in the control (n = 6), CORT (n = 6), FLX (n = 6), and CORT plus FLX (n = 5) groups. From these findings, we succeeded in establishing a highly quantitative PET imaging method for cellular proliferative activity in the neurogenic regions in vivo with an inhibitor of ABCCs (Mrps) and/or OAT3.
It has been reported that the accumulation of PET tracers other than [18F]FLT in the brain was enhanced by inhibitors of ABCB1 (known as P-gp; Syvänen et al., 2006; Laćan et al., 2008) and ABCG2 (Wanek et al., 2012) in PET imaging studies; however, there have been no reports about the use of inhibitors for other drug efflux transporters, including ABCCs (known as Mrps) and OATs, at the BBB. In this study, we showed that the accumulation of [18F]FLT in the brain was enhanced by probenecid in a dose-dependent manner using both ex vivo autoradiography and in vivo PET imaging studies (Figs. 1, 2). Probenecid has been known to be an inhibitor of Mrps and OATs (Borst et al., 2000; Kusuhara and Sugiyama, 2005; Shitara et al., 2005). These studies indicated that [18F]FLT was restricted to reach into the brain parenchyma by these probenecid-sensitive transporters at the BBB.
The in vivo detection of cell proliferation in the neurogenic regions of adult rats using [18F]FLT-PET imaging has been reported (Rueger et al., 2010). There are some issues that need to be resolved in the use of [18F]FLT-PET imaging (Couillard-Despres et al., 2011). First, it is hard to assess reduced cell proliferation in the neurogenic niches quantitatively because there is little difference between PET signals in the two neurogenic regions (SUV, 0.11–0.12) and in the background area (SUV, 0.08). In this study, we resolved this problem in [18F]FLT-PET imaging by using inhibitors of drug transporters at the BBB. Indeed, the SUVs in the two neurogenic regions were 0.21–0.24, while the SUV in the thalamus (as a reference region) was 0.14 (Fig. 3). Second, although the number of dividing neural stem/progenitor cells in the SVZ was higher than that in the SGZ of the DG, PET signal intensities in both neurogenic regions showed similar levels (SUV in SVZ, 0.11; SUV in DG, 0.12) in a previous report (Rueger et al., 2010). In our study, SUVs in both neurogenic niches were similar to those with [18F]FLT-PET imaging without probenecid (SVZ, 0.129; SGZ, 0.127; Fig. 3B). However, the mean SUVs in the SVZ were higher than that in the SGZ of DG using [18F]FLT-PET imaging with probenecid (30 mg/kg, p > 0.05; 100 mg/kg, p < 0.01; Fig. 3B). Thus, this appeared to be improved by probenecid treatment. Unfortunately, it is difficult to use probenecid at a dose of >100 mg/kg because the injection volume for both [18F]FLT and probenecid goes beyond the limits of the maximum volume allowed for intravenous administration. Third, the identity of [18F]FLT-accumulated cells has not been fully determined, especially under pathological conditions. Indeed, it is well known that dividing reactive astrocytes and microglia are observed around damaged areas of the brain following ischemia and traumatic injury. In our study, we confirmed that reactive astrocytes or microglia were not found in the brains of the CORT plus FLX-treated group as well as other groups (Fig. 6). Moreover, we showed that the number of dividing cells in the SGZ was altered in both CORT-treated and/or SSRI-treated rats, but that the number in the hilus did not change with immunostaining studies (Fig. 5B). These data suggest that the alteration of PET signals in the DG of CORT-treated and/or SSRI-treated rats corresponds to a decrease or increase in dividing neural stem/progenitor cells in the SGZ, but not to other cells in the hilus.
Figure 6.

No proliferating reactive astrocytes and microglia were observed in the DGs of the CORT- and/or FLX-treated rats. A, Ki67+ proliferating cell (red) was not immunopositive for GFAP (green) in the hilus of DG in CORT plus FLX-treated rats. B, BrdU-expressing proliferating cell (red) was not immunopositive for Iba1 (green) in the DG of CORT plus FLX-treated rats. Arrowheads show proliferating cells with expression of Ki67 (A) or BrdU (B). Scale bars, 100 μm.
The expression of both Ki67 and thymidine kinase 1 (TK1) has been used to elucidate the correlation with [18F]FLT-PET signals in tumors (McKinley et al., 2013; Whisenant et al., 2015). [18F]FLT is used as a PET tracer for cellular proliferation in tumors in clinical application and is retained in proliferating cells through the activity of TK1. TK1 is upregulated between the late G1 and the early G2 phase of the cell cycle, whereas Ki67 is expressed in dividing cells during all phases of the cell cycle. There is truly a difference in the absolute numbers of TK1- and Ki67-expressing cells. Indeed, [18F]FLT uptake in cancer cells is highly correlated with the expression of TK1, relative to that of Ki67 (McKinley et al., 2013). Unfortunately, at least two kinds of commercial TK1 antibodies that we used in this study could not detect dividing cells in both neurogenic regions of adult rats. It has been reported that these antibodies could recognize mouse TK1 antigen (McKinley et al., 2013). In this study, we used the number of Ki67-immunopositive cells to investigate the correlation with quantitative data obtained from PET imaging studies (Fig. 5C). In the future, this [18F]FLT-PET imaging with probenecid might be used to detect the alteration of neurogenic proliferative activity in adult animals instead of immunohistochemical staining with Ki67 antibody.
Here we showed that the administration of probenecid, an inhibitor for ABCCs and OAT3, facilitated the brain uptake of [18F]FLT and enhanced [18F]FLT accumulation in the neurogenic regions. Moreover, we demonstrated that this enhanced [18F]FLT-PET imaging with probenecid could assess the alteration of cell proliferation in the hippocampal DG of model rats with CORT-induced depression and/or recovery by treatment with an SSRI. From these findings, we believe that this enhanced [18F]FLT-PET imaging with probenecid may be a useful tool in the quantitative evaluation of cellular proliferative activity in the SGZ of the hippocampus, and also in both the diagnosis of depression and the monitoring of the therapeutic efficacy of antidepressants or behavioral therapy noninvasively in humans as well as in experimental animals.
Footnotes
This study was supported by a Grant-in-Aid from the Ministry of Education, Culture, Sports, Science and Technology of the Japanese Government to Y.K. (JSPS KAKENHI Grants 25460399 and 15H00905); the Japan Agency for Medical Research and Development to Y.K.; and the Cross-Ministerial Strategic Innovation Promotion Program to Y.K. We thank Dr. T. Shingaki, Y. Katayama, and A. Mukai-Tachibana (RIKEN) for advice and technical assistance.
The authors declare no competing financial interests.
References
- Aizawa K, Ageyama N, Yokoyama C, Hisatsune T. Age-dependent alteration in hippocampal neurogenesis correlates with learning performance of macaque monkeys. Exp Anim. 2009;58:403–407. doi: 10.1538/expanim.58.403. [DOI] [PubMed] [Google Scholar]
- Altman J, Das GD. Autoradiographic and histological evidence of postnatal hippocampal neurogenesis in rats. J Comp Neurol. 1965;124:319–335. doi: 10.1002/cne.901240303. [DOI] [PubMed] [Google Scholar]
- Awasthi V, Pathuri G, Agashe HB, Gali H. Synthesis and in vivo evaluation of p-18F-Fluorohippurate as a new radiopharmaceutical for assessment of renal function by PET. J Nucl Med. 2011;52:147–153. doi: 10.2967/jnumed.110.075895. [DOI] [PubMed] [Google Scholar]
- Bakhsheshian J, Wei BR, Chang KE, Shukla S, Ambudkar SV, Simpson RM, Gottesman MM, Hall MD. Bioluminescent imaging of drug efflux at the blood-brain barrier mediated by the transporter ABCG2. Proc Natl Acad Sci U S A. 2013;110:20801–20806. doi: 10.1073/pnas.1312159110. [DOI] [PMC free article] [PubMed] [Google Scholar]
- Borst P, Evers R, Kool M, Wijnholds J. A family of drug transporters: the multidrug resistance-associated proteins. J Natl Cancer Inst. 2000;92:1295–1302. doi: 10.1093/jnci/92.16.1295. [DOI] [PubMed] [Google Scholar]
- Brummelte S, Galea LA. Chronic high corticosterone reduces neurogenesis in the dentate gyrus of adult male and female rats. Neuroscience. 2010;168:680–690. doi: 10.1016/j.neuroscience.2010.04.023. [DOI] [PubMed] [Google Scholar]
- Cameron HA, Gould E. Adult neurogenesis is regulated by adrenal steroids in the dentate gyrus. Neuroscience. 1994;61:203–209. doi: 10.1016/0306-4522(94)90224-0. [DOI] [PubMed] [Google Scholar]
- Chen W, Cloughesy T, Kamdar N, Satyamurthy N, Bergsneider M, Liau L, Mischel P, Czernin J, Phelps ME, Silverman DH. Imaging proliferation in brain tumors with 18F-FLT PET: comparison with 18F-FDG. J Nucl Med. 2005;46:945–952. [PubMed] [Google Scholar]
- Couillard-Despres S, Vreys R, Aigner L, Van der Linden A. In vivo monitoring of adult neurogenesis in health and disease. Front Neurosci. 2011;5:67. doi: 10.3389/fnins.2011.00067. [DOI] [PMC free article] [PubMed] [Google Scholar]
- Czéh B, Michaelis T, Watanabe T, Frahm J, de Biurrun G, van Kampen M, Bartolomucci A, Fuchs E. Stress-induced changes in cerebral metabolites, hippocampal volume, and cell proliferation are prevented by antidepressant treatment with tianeptine. Proc Natl Acad Sci U S A. 2001;98:12796–12801. doi: 10.1073/pnas.211427898. [DOI] [PMC free article] [PubMed] [Google Scholar]
- Doetsch F, Caillé I, Lim DA, García-Verdugo JM, Alvarez-Buylla A. Subventricular zone astrocytes are neural stem cells in the adult mammalian brain. Cell. 1999;97:703–716. doi: 10.1016/S0092-8674(00)80783-7. [DOI] [PubMed] [Google Scholar]
- Eriksson PS, Perfilieva E, Björk-Eriksson T, Alborn AM, Nordborg C, Peterson DA, Gage FH. Neurogenesis in the adult human hippocampus. Nat Med. 1998;4:1313–1317. doi: 10.1038/3305. [DOI] [PubMed] [Google Scholar]
- Gould E, Reeves AJ, Fallah M, Tanapat P, Gross CG, Fuchs E. Hippocampal neurogenesis in adult Old World primates. Proc Natl Acad Sci U S A. 1999;96:5263–5267. doi: 10.1073/pnas.96.9.5263. [DOI] [PMC free article] [PubMed] [Google Scholar]
- Granot D, Scheinost D, Markakis EA, Papademetris X, Shapiro EM. Serial monitoring of endogenous neuroblast migration by cellular MRI. Neuroimage. 2011;57:817–824. doi: 10.1016/j.neuroimage.2011.04.063. [DOI] [PMC free article] [PubMed] [Google Scholar]
- Hellsten J, Wennström M, Mohapel P, Ekdahl CT, Bengzon J, Tingström A. Electroconvulsive seizures increase hippocampal neurogenesis after chronic corticosterone treatment. Eur J Neurosci. 2002;16:283–290. doi: 10.1046/j.1460-9568.2002.02093.x. [DOI] [PubMed] [Google Scholar]
- Huang GJ, Herbert J. Stimulation of neurogenesis in the hippocampus of the adult rat by fluoxetine requires rhythmic change in corticosterone. Biol Psychiatry. 2006;59:619–624. doi: 10.1016/j.biopsych.2005.09.016. [DOI] [PubMed] [Google Scholar]
- Imayoshi I, Sakamoto M, Ohtsuka T, Takao K, Miyakawa T, Yamaguchi M, Mori K, Ikeda T, Itohara S, Kageyama R. Roles of continuous neurogenesis in the structural and functional integrity of the adult forebrain. Nat Neurosci. 2008;11:1153–1161. doi: 10.1038/nn.2185. [DOI] [PubMed] [Google Scholar]
- Kodama M, Fujioka T, Duman RS. Chronic olanzapine or fluoxetine administration increases cell proliferation in hippocampus and prefrontal cortex of adult rat. Biol Psychiatry. 2004;56:570–580. doi: 10.1016/j.biopsych.2004.07.008. [DOI] [PubMed] [Google Scholar]
- Kornack DR, Rakic P. Continuation of neurogenesis in the hippocampus of the adult macaque monkey. Proc Natl Acad Sci U S A. 1999;96:5768–5773. doi: 10.1073/pnas.96.10.5768. [DOI] [PMC free article] [PubMed] [Google Scholar]
- Kornack DR, Rakic P. The generation, migration, and differentiation of olfactory neurons in the adult primate brain. Proc Natl Acad Sci U S A. 2001;98:4752–4757. doi: 10.1073/pnas.081074998. [DOI] [PMC free article] [PubMed] [Google Scholar]
- Kusuhara H, Sugiyama Y. Active efflux across the blood-brain barrier: role of the solute carrier family. NeuroRx. 2005;2:73–85. doi: 10.1602/neurorx.2.1.73. [DOI] [PMC free article] [PubMed] [Google Scholar]
- Laćan G, Plenevaux A, Rubins DJ, Way BM, Defraiteur C, Lemaire C, Aerts J, Luxen A, Cherry SR, Melega WP. Cyclosporine, a P-glycoprotein modulator, increases [18F]MPPF uptake in rat brain and peripheral tissues: microPET and ex vivo studies. Eur J Nucl Med Mol Imaging. 2008;35:2256–2266. doi: 10.1007/s00259-008-0832-z. [DOI] [PubMed] [Google Scholar]
- Malberg JE, Duman RS. Cell proliferation in adult hippocampus is decreased by inescapable stress: reversal by fluoxetine treatment. Neuropsychopharmacology. 2003;28:1562–1571. doi: 10.1038/sj.npp.1300234. [DOI] [PubMed] [Google Scholar]
- Malberg JE, Eisch AJ, Nestler EJ, Duman RS. Chronic antidepressant treatment increases neurogenesis in adult rat hippocampus. J Neurosci. 2000;20:9104–9110. doi: 10.1523/JNEUROSCI.20-24-09104.2000. [DOI] [PMC free article] [PubMed] [Google Scholar]
- McKinley ET, Ayers GD, Smith RA, Saleh SA, Zhao P, Washington MK, Coffey RJ, Manning HC. Limits of [18F]-FLT PET as a biomarker of proliferation in oncology. PLoS One. 2013;8:e58938. doi: 10.1371/journal.pone.0058938. [DOI] [PMC free article] [PubMed] [Google Scholar]
- Perera TD, Dwork AJ, Keegan KA, Thirumangalakudi L, Lipira CM, Joyce N, Lange C, Higley JD, Rosoklija G, Hen R, Sackeim HA, Coplan JD. Necessity of hippocampal neurogenesis for the therapeutic action of antidepressants in adult nonhuman primates. PLoS One. 2011;6:e17600. doi: 10.1371/journal.pone.0017600. [DOI] [PMC free article] [PubMed] [Google Scholar]
- Pinnock SB, Lazic SE, Wong HT, Wong IH, Herbert J. Synergistic effects of dehydroepiandrosterone and fluoxetine on proliferation of progenitor cells in the dentate gyrus of the adult male rat. Neuroscience. 2009;158:1644–1651. doi: 10.1016/j.neuroscience.2008.10.035. [DOI] [PMC free article] [PubMed] [Google Scholar]
- Qiu G, Helmeste DM, Samaranayake AN, Lau WM, Lee TM, Tang SW, So KF. Modulation of the suppressive effect of corticosterone on adult rat hippocampal cell proliferation by paroxetine. Neurosci Bull. 2007;23:131–136. doi: 10.1007/s12264-007-0019-9. [DOI] [PMC free article] [PubMed] [Google Scholar]
- Römermann K, Wanek T, Bankstahl M, Bankstahl JP, Fedrowitz M, Müller M, Löscher W, Kuntner C, Langer O. (R)-[(11)C]verapamil is selectively transported by murine and human P-glycoprotein at the blood-brain barrier, and not by MRP1 and BCRP. Nucl Med Biol. 2013;40:873–878. doi: 10.1016/j.nucmedbio.2013.05.012. [DOI] [PMC free article] [PubMed] [Google Scholar]
- Rueger MA, Backes H, Walberer M, Neumaier B, Ullrich R, Simard ML, Emig B, Fink GR, Hoehn M, Graf R, Schroeter M. Noninvasive imaging of endogenous neural stem cell mobilization in vivo using positron emission tomography. J Neurosci. 2010;30:6454–6460. doi: 10.1523/JNEUROSCI.6092-09.2010. [DOI] [PMC free article] [PubMed] [Google Scholar]
- Santarelli L, Saxe M, Gross C, Surget A, Battaglia F, Dulawa S, Weisstaub N, Lee J, Duman R, Arancio O, Belzung C, Hen R. Requirement of hippocampal neurogenesis for the behavioral effects of antidepressants. Science. 2003;301:805–809. doi: 10.1126/science.1083328. [DOI] [PubMed] [Google Scholar]
- Schinkel AH, Wagenaar E, Mol CA, van Deemter L. P-glycoprotein in the blood-brain barrier of mice influences the brain penetration and pharmacological activity of many drugs. J Clin Invest. 1996;97:2517–2524. doi: 10.1172/JCI118699. [DOI] [PMC free article] [PubMed] [Google Scholar]
- Shah C, Miller TW, Wyatt SK, McKinley ET, Olivares MG, Sanchez V, Nolting DD, Buck JR, Zhao P, Ansari MS, Baldwin RM, Gore JC, Schiff R, Arteaga CL, Manning HC. Imaging biomarkers predict response to anti-HER2 (ErbB2) therapy in preclinical models of breast cancer. Clin Cancer Res. 2009;15:4712–4721. doi: 10.1158/1078-0432.CCR-08-2635. [DOI] [PMC free article] [PubMed] [Google Scholar]
- Shapiro EM, Gonzalez-Perez O, Manuel García-Verdugo J, Alvarez-Buylla A, Koretsky AP. Magnetic resonance imaging of the migration of neuronal precursors generated in the adult rodent brain. Neuroimage. 2006;32:1150–1157. doi: 10.1016/j.neuroimage.2006.04.219. [DOI] [PMC free article] [PubMed] [Google Scholar]
- Shitara Y, Sato H, Sugiyama Y. Evaluation of drug-drug interaction in the hepatobiliary and renal transport of drugs. Annu Rev Pharmacol Toxicol. 2005;45:689–723. doi: 10.1146/annurev.pharmtox.44.101802.121444. [DOI] [PubMed] [Google Scholar]
- Snyder JS, Soumier A, Brewer M, Pickel J, Cameron HA. Adult hippocampal neurogenesis buffers stress responses and depressive behaviour. Nature. 2011;476:458–461. doi: 10.1038/nature10287. [DOI] [PMC free article] [PubMed] [Google Scholar]
- Spalding KL, Bergmann O, Alkass K, Bernard S, Salehpour M, Huttner HB, Boström E, Westerlund I, Vial C, Buchholz BA, Possnert G, Mash DC, Druid H, Frisén J. Dynamics of hippocampal neurogenesis in adult humans. Cell. 2013;153:1219–1227. doi: 10.1016/j.cell.2013.05.002. [DOI] [PMC free article] [PubMed] [Google Scholar]
- Sugiyama D, Kusuhara H, Shitara Y, Abe T, Meier PJ, Sekine T, Endou H, Suzuki H, Sugiyama Y. Characterization of the efflux transport of 17beta-estradiol-D-17beta-glucuronide from the brain across the blood-brain barrier. J Pharmacol Exp Ther. 2001;298:316–322. [PubMed] [Google Scholar]
- Sumner JP, Shapiro EM, Maric D, Conroy R, Koretsky AP. In vivo labeling of adult neural progenitors for MRI with micron sized particles of iron oxide: quantification of labeled cell phenotype. Neuroimage. 2009;44:671–678. doi: 10.1016/j.neuroimage.2008.07.050. [DOI] [PMC free article] [PubMed] [Google Scholar]
- Syvänen S, Blomquist G, Sprycha M, Höglund AU, Roman M, Eriksson O, Hammarlund-Udenaes M, Långström B, Bergström M. Duration and degree of cyclosporin induced P-glycoprotein inhibition in the rat blood-brain barrier can be studied with PET. Neuroimage. 2006;32:1134–1141. doi: 10.1016/j.neuroimage.2006.05.047. [DOI] [PubMed] [Google Scholar]
- Töllner K, Brandt C, Römermann K, Löscher W. The organic anion transport inhibitor probenecid increases brain concentrations of the NKCC1 inhibitor bumetanide. Eur J Pharmacol. 2015;746:167–173. doi: 10.1016/j.ejphar.2014.11.019. [DOI] [PubMed] [Google Scholar]
- Vande Velde G, Raman Rangarajan J, Vreys R, Guglielmetti C, Dresselaers T, Verhoye M, Van der Linden A, Debyser Z, Baekelandt V, Maes F, Himmelreich U. Quantitative evaluation of MRI-based tracking of ferritin-labeled endogenous neural stem cell progeny in rodent brain. Neuroimage. 2012;62:367–380. doi: 10.1016/j.neuroimage.2012.04.040. [DOI] [PubMed] [Google Scholar]
- Wanek T, Kuntner C, Bankstahl JP, Mairinger S, Bankstahl M, Stanek J, Sauberer M, Filip T, Erker T, Müller M, Löscher W, Langer O. A novel PET protocol for visualization of breast cancer resistance protein function at the blood-brain barrier. J Cereb Blood Flow Metab. 2012;32:2002–2011. doi: 10.1038/jcbfm.2012.112. [DOI] [PMC free article] [PubMed] [Google Scholar]
- Whisenant JG, McIntyre JO, Peterson TE, Kang H, Sánchez V, Manning HC, Arteaga CL, Yankeelov TE. Utility of [18F]FLT-PET to assess treatment response in trastuzumab-resistant and trastuzumab-sensitive HER2-overexpressing human breast cancer xenografts. Mol Imaging Biol. 2015;17:119–128. doi: 10.1007/s11307-014-0770-z. [DOI] [PMC free article] [PubMed] [Google Scholar]
- Wijnholds J, Mol CA, van Deemter L, de Haas M, Scheffer GL, Baas F, Beijnen JH, Scheper RJ, Hatse S, De Clercq E, Balzarini J, Borst P. Multidrug-resistance protein 5 is a multispecific organic anion transporter able to transport nucleotide analogs. Proc Natl Acad Sci U S A. 2000;97:7476–7481. doi: 10.1073/pnas.120159197. [DOI] [PMC free article] [PubMed] [Google Scholar]
- Wong EY, Herbert J. Raised circulating corticosterone inhibits neuronal differentiation of progenitor cells in the adult hippocampus. Neuroscience. 2006;137:83–92. doi: 10.1016/j.neuroscience.2005.08.073. [DOI] [PMC free article] [PubMed] [Google Scholar]
- Yun M, Oh SJ, Ha HJ, Ryu JS, Moon DH. High radiochemical yield synthesis of 3′-deoxy-3′-[18F]fluorothymidine using (5′-O-dimethoxytrityl-2′-deoxy-3′-O-nosyl-beta-D-threo pentofuranosyl)thymine and its 3-N-BOC-protected analogue as a labeling precursor. Nucl Med Biol. 2003;30:151–157. doi: 10.1016/S0969-8051(02)00409-2. [DOI] [PubMed] [Google Scholar]