

Abstract
Mitochondria play an important role in the regulation of neurotransmission, and mitochondrial impairment is a key event in neurodegeneration. Cells rely on mitochondrial carrier proteins of the SLC25 family to shuttle ions, cofactors, and metabolites necessary for enzymatic reactions. Mutations in these carriers often result in rare but severe pathologies in the brain, and some of the genes, including SLC25A39 and SLC25A40, reside in susceptibility loci of severe forms of epilepsy. However, the role of most of these carriers has not been investigated in neurons in vivo. We identified shawn, the Drosophila homolog of SLC25A39 and SLC25A40, in a genetic screen to identify genes involved in neuronal function. Shawn localizes to mitochondria, and missense mutations result in an accumulation of reactive oxygen species, mitochondrial dysfunction, and neurodegeneration. Shawn regulates metal homeostasis, and we found in shawn mutants increased levels of manganese, calcium, and mitochondrial free iron. Mitochondrial mutants often cannot maintain synaptic transmission under demanding conditions, but shawn mutants do, and they also do not display endocytic defects. In contrast, shawn mutants harbor a significant increase in neurotransmitter release. Our work provides the first functional annotation of these essential mitochondrial carriers in the nervous system, and the results suggest that metal imbalances and mitochondrial dysfunction may contribute to defects in synaptic transmission and neuronal survival.
SIGNIFICANCE STATEMENT We describe for the first time the role of the mitochondrial carrier Shawn/SLC25A39/SLC25A40 in the nervous system. In humans, these genes reside in susceptibility loci for epilepsy, and, in flies, we observe neuronal defects related to mitochondrial dysfunction and metal homeostasis defects. Interestingly, shawn mutants also harbor increased neurotransmitter release and neurodegeneration. Our data suggest a connection between maintaining a correct metal balance and mitochondrial function to regulate neuronal survival and neurotransmitter release.
Keywords: Drosophila melanogaster, mitochondrial dysfunction, neurotoxicity, SLC25A39, SLC25A40
Introduction
Mitochondria play a key role in numerous cellular processes. They produce the majority of cellular energy in the form of ATP by the oxidation of sugars and fat, maintain Ca2+-buffering, and regulate apoptosis. They also play a crucial role in heme and iron-sulfur cluster biosynthesis and amino acid metabolism. These basic functions of mitochondria are essential because even subtle impairments might give rise to devastating disorders (Finsterer, 2011; Calì et al., 2012; Stehling and Lill, 2013; Rao et al., 2014). In support, reduced energy production by genetic defects or environmental insults, including toxins, reduction in the antioxidant response, and reduced mitochondrial dynamics, have been suggested repeatedly to be key features in the etiology of neurodegenerative disorders (Haelterman et al., 2014).
Mitochondrial carriers of the SLC25 family bridge biochemical pathways between the cytosol and the mitochondrial matrix (Palmieri, 2014). Members of this family consist of three mitochondrial carrier domains that each contain two hydrophobic stretches that span the membrane as α helices (Saraste and Walker, 1982; Pebay-Peyroula et al., 2003). Most carriers localize to the inner mitochondrial membrane and can be divided in five categories based on the type of substrate they transport; nucleotides, amino acids, inorganic ions or cofactors (Robinson and Kunji, 2006), and the uncoupler proteins (Rousset et al., 2004). Furthermore, dysfunctionality of these carriers leads to severe but rare metabolic disorders of which some affect the nervous system (Gutiérrez-Aguilar and Baines, 2013).
The mammalian genome encodes 53 mitochondrial carriers of which approximately one-third has no identified substrate. SLC25A39 and SLC25A40 are two such carrier proteins for which no substrate has been validated by direct transport assays. SLC25A39 was first isolated from a screen in Saccharomyces cerevisiae designed to identify activators of the antioxidant SOD2 (Luk et al., 2003). Activation of SOD2 requires the incorporation of manganese in SOD2 (Culotta et al., 2006). The yeast slc25a39 mutant displays a decreased activity of SOD2 and was therefore named manganese trafficking factor of manganese SOD2 1 (mtm1; Luk et al., 2003). However, loss of mtm1 (Δmtm1) did not result in manganese deficiency yet exhibited slight accumulations of manganese and SOD2-associated iron that competes with manganese for the incorporation in SOD2 and partially inactivates it (Yang et al., 2006; Naranuntarat et al., 2009). Independently, zebrafish slc25a39 was proposed to play a role in the early steps of heme biosynthesis (Nilsson et al., 2009). Total iron levels were not altered, yet a fourfold decrease of iron incorporation in heme was found after silencing slc25a39 (Nilsson et al., 2009). Although iron metabolism seems to be affected, it is unlikely that SLC25A39 is necessary to transport iron (Nilsson et al., 2009; Park et al., 2013). Hence, functional annotation in genetic model systems is critical to gain a better understanding of the function of this protein.
In this work, we present a large-scale unbiased genetic screen for essential genes that modulate neurotransmission, and we identify Shawn, the Drosophila homolog of SLC25A39 and SLC25A40. Shawn localizes to mitochondria, and loss of function leads to an accumulation of reactive oxygen species that cause mitochondrial morphological and functional defects. These defects culminate in progressive neurodegeneration of photoreceptor terminals and degeneration of postsynaptic muscle cells at the larval neuromuscular junction (NMJ). In humans, SLC25A39 and SLC25A40 reside independently in susceptibility loci for epilepsy (Durmaz et al., 2009; Sirén et al., 2010). Although most mitochondrial mutants that affect mitochondrial integrity result in reduced neurotransmission (Billups and Forsythe, 2002; Verstreken et al., 2005; Morais et al., 2009; Sandoval et al., 2014), we find that shawn mutants show increased glutamatergic transmission. We provide evidence that loss of Shawn results in increased manganese (Mn) and calcium (Ca) levels and an increase in mitochondrial free iron (Fe), providing an explanation for the defects in neurotransmitter release and neurotoxicity. Our work presents the first characterization of the SLCA25A family in the nervous system in vivo and connects defects in mitochondrial function and metal dyshomeostasis in neuronal and muscular degeneration.
Materials and Methods
Drosophila stocks and maintenance.
Fly stocks were maintained on maize meal and molasses medium. Flies used for the different experiments were grown on black currant syrup plates with fresh yeast paste at 25°C unless indicated differently. The mutant population on the X chromosome of Drosophila was generated as described previously (Fernandes et al., 2014). Duplications and transgenic stocks were obtained from the Bloomington Stock Center (Bloomington, IN; BL) or were a gift from Michael Palladino (University of Pittsburgh, Pittsburgh, PA; UAS–MTSroGFP2; Liu et al., 2012).
The full genotypes for sh1 and sh2 are y1w1118shxP{ry[+t7.2]=neoFRT}19A. For experiments with the sh1 and sh2 alleles controls were y1w1118P{ry[+t7.2]=neoFRT}19A (BL); for experiments with shΔ36.3, controls were CantonSw1118 (CSw). For mitochondrial membrane potential and redox status measurements, controls were y1w1118P{ry[+t7.2]=neoFRT}19A/w1118;+/+;D42–Gal4,Mito–GFP/+ and y1w1118P{ry[+t7.2]=neoFRT}19A/w1118;OK6–Gal4,UAS–MTSroGFP2/+; controls for metal analysis, Fe2+ measurements, and the Aconitase assay were y1w1118P{ry[+t7.2]=neoFRT}19A/CantonSw1118.
Identification of shawn.
Meiotic recombination mapping was performed as described previously (Zhai et al., 2003). Fine mapping was performed by crossing a collection of duplicated segments from the X chromosome to y1w1118shxP{ry[+t7.2]=neoFRT}19A/FM7c and scored for viable mutant male offspring. The final duplication used for complementation analysis are indicated in Figure 2. Causative genetic lesions were obtained by regular Sanger sequencing of the smallest overlapping duplication region complementing lethality of the ethyl methanesulphonate (EMS) alleles.
Figure 2.

Genetic lesions in X13 map to shawn. A, Recombination mapping identifies the lethality of complementation group X13 between P-element EY02544 and EY16330 (*). Recombination distance (in centimorgan) between mutant and P-element is written above each P-element. Additional complementation mapping with small duplications localizes the mutations to a small interval of 25 kb. Green duplications complemented the lethality, whereas red duplications failed to complement. B, Sequencing of shawn reveals a G-to-E substitution at positions 278 and 282 for shawn1 and shawn2, respectively. C, Generation of the imprecise excision shΔ36.3 and the genomic rescue construct sh+–HA. P-element KG09498 was excised imprecisely from the genome, and flies were sequenced. The red shade represents the excised area taking away almost the full shawn open reading frame. The gray shade depicts the genomic area that was used for the genomic rescue construct. The open reading frame of shawn is displayed by the orange rectangles.
Imprecise excision of shawn.
A deletion in shawn was generated by imprecise excision of the transposable element y1P{SUPor-P}TylerKG09498. The resulting events were balanced and screened for lethality. Lethal stocks were crossed with sh1 and sh2, and stocks that failed to complement were backcrossed to CSw. Flies were PCR screened to identify the excised element. Three forward and three reverse primers around the P-element location were used to identify the approximate size and direction of the excision (for primers, see Table 1). Sequencing analysis identified the exact breakpoints of the deletion (X:19611734.19617043, D. melanogaster flybase R6.04). Complementation analysis with a genomic rescue construct was performed to exclude the presence of secondary lethal events. The resulting excision was event 36.3 and was used throughout the full manuscript as shΔ36.3 (depicted as sh36.3 in the figures).
Table 1.
List of the different primers used for molecular biology
| Primers | Sequence (5′-3′) |
|---|---|
| Imprecise excision | |
| F1 | CAGCAAGTCGTTCTTCTTCCAC |
| R1 | GGCGGTTGCTTCACTGGGAGCG |
| F2 | GTAGTGACGCCCTTGGAGGTGG |
| R2 | CCACATTGGGCCTACCTGAG |
| F3 | GCGTCAATCCCGAGTCCATCC |
| R3 | TCGTCCTTACCCCAACCTATC |
| UAS constructs | |
| WT-F | CGGCGGCCGCCATGGCTACGAGGGAGGCCTG |
| WT-R | CGGGTACCTCAGGAGCCGGGCCCCTTTG |
| N-HA-F | CGGCGGCCGCATGTACCCCTACGACGTGCCCGACTACGCCGGAGGAAGCGGAGCTACGAGGGAGGCCTGCGG |
| N-HA- R | CGGGTACCTCAGGAGCCGGGCCCCTTTG |
| Mutagenesis PCR | |
| G278E-F | CAGCTTTGCGGCGGAAGCGATATCCGGA |
| G278E-R | TCCGGATATCGCTTCCGCCGCAAAGCTG |
| G282E-F | GGGAGCGATATCCGAATCGGTGGCCGCC |
| G282E-R | GGCGGCCACCGATTCGGATATCGCTCCC |
| Genomic rescue | |
| F 5-UTR | CACGGCGGGCATGTCGAGACTTCGTGCTCGGTACCGGATCGGCGCGCCCCCAAAGCAACAGAACTACG |
| R-3′-UTR | CAAAAATGGGTTTTATTAACTTACATACATACTAGAATTCTTAATTAAGACACTTACTTCTGCTTGGGCG |
| F-middle | CTTCCAGTCAAAATCCGTCG |
| R-middle | GCAGGCCGTCACCATGGCGC |
| F-HA | GCCCGGCTCCTACCCCTACGACGTGCCCGACTACGCCTGAACGCGCTCCCAATGCGGTGA |
| R-HA | TCAGGCGTAGTCGGGCACGTCGTAGGGGTAGGAGCCGGGCCCCTTTGTCGCCTGATTGCTCCGATTGTGC |
| RT-PCR | |
| Shawn-F | CAAGTGGCATCCGCCTGTA |
| Shawn-R | AAGCGGGTCTTGATCACATC |
| RP49-F | ATCGGTTACGGATCGAACAA |
| RP49-R | GACAATCTCCTTGCGCTTCT |
F, Forward; R, reverse.
Molecular biology.
UAS–shawn, N-terminally tagged UAS–HA–shawn, and C-terminally tagged UAS–shawn–HA were cloned from cDNA clone GH21048 (GenBank accession number AY070516, Drosophila Genomics Resource Center, Bloomington, IN). Fragments were amplified by PCR and cloned into the KpnI/NotI restriction sites (underlined) of the pUAST–w+–AttB plasmid (for primers, see Table 1). A small linker sequence (italic) was placed between the HA tag (bold) and shawn DNA (for primers, see Table 1). EMS point mutations were introduced in the different UAS–shawn vectors using the QuikChange Lightning Site-Directed Mutagenesis kit (Agilent Technologies) according to the protocol of the manufacturer to generate UAS–shawnG278E, UAS–shawnG282E, UAS–HA–shawnG278E, UAS–shawnG278E–HA, UAS–HA–shawnG282E, and UAS–shawnG282E–HA (for primers, see Table 1). Correct introduction of the EMS mutation was verified with sequence analysis.
The genomic rescue construct containing a C-terminal HA tag (sh+–HA) was generated using recombination in S. cerevisae. Shawn genomic DNA was amplified from the BAC CH321-35A10 (BACPAC Resources Center) and recombined in the vector pFl44Sw+AttB using the primers listed in Table 1 (Merhi et al., 2011).
Transgenic animals were generated using phiC31-mediated integration in y1w67c23;P{CaryP}attpP40 (BestGene). All generated constructs were sequenced and verified.
RT-PCR.
Total RNA was isolated from Drosophila material using Tri Reagent (Sigma-Aldrich) according to the protocol of the manufacturer. RNA was digested with RQ1 DNase (Promega) to prevent DNA contamination and subsequently precipitated using LiCl (2.5 m). cDNA was prepared using the Superscript III First-Strand Synthesis System (Invitrogen). Samples were controlled for genomic DNA contamination by including samples in which the reverse transcriptase was omitted. The SYBR Green kit and LC480 LightCycler were used for PCR analysis (Roche). For primers used to detect SHAWN, see Table 1. The ribosomal protein RP49 was used as a housekeeping gene (for primers, see Table 1).
Electrophysiology.
Electroretinograms (ERGs) were recorded from 3-d-old adult flies immobilized on a glass microscope slide using liquid Pritt glue. For recordings, glass pipettes (borosilicate, 1.5 mm outer diameter; Hilgenberg) were filled with 3 m NaCl and placed in the thorax, as a reference, and on the fly eye, slightly penetrating the cornea for recordings. Responses to a repetitive light stimulus (1 s) given by a green light-emitting diode (see Figs. 1B, 3B) were recorded using AxoScope 10.5 and analyzed using Clampfit 10.5 software (Molecular Devices). Recordings were amplified using a Warner DP311 AC/DC amplifier (Warner Instruments) and digitized using the minidigi 1A (Molecular Devices). Raw data traces were transferred to Igor Pro 6.36 (Wavemetrics) for figure preparation.
Figure 1.
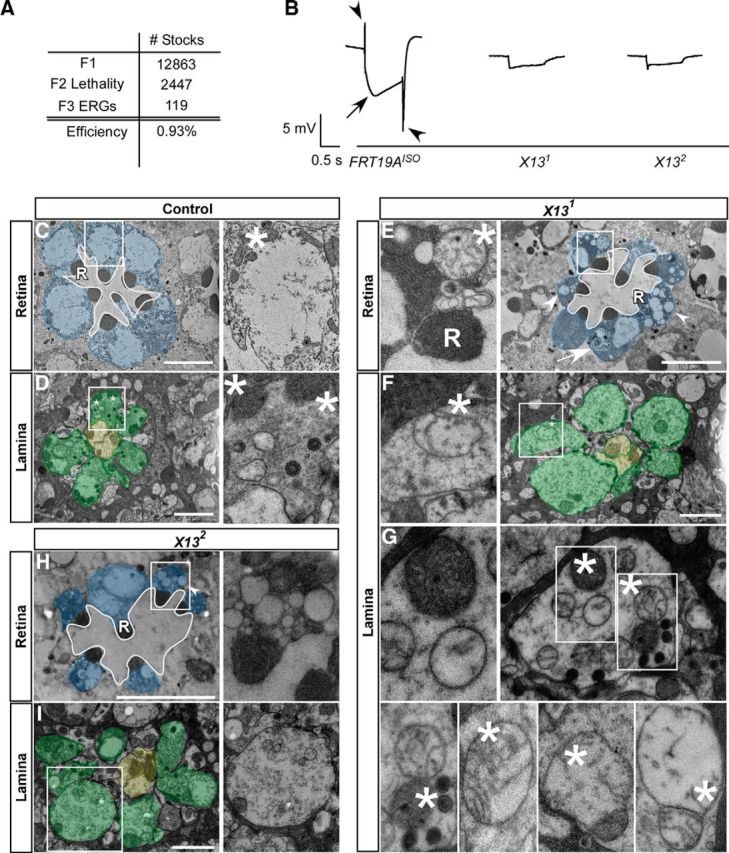
Isolation of complementation group X13 that is necessary for neuronal function and survival. A, Overview of the EMS screen to isolate mutants affecting neuronal communication on the X chromosome of Drosophila. A total of 12,863 EMS-treated stocks were established and 2447 F2 lethal stocks were isolated and screened for ERG defects. One hundred nineteen ERG mutants were identified. B, Representative ERG traces for the different genotypes of complementation group 13. Genotypes are described below each trace. The arrowheads indicate the ON and OFF transient, and the arrow indicates the depolarization. Five flies were screened per genotype. C–G, TEM sections of the retina and cartridges in single ommatidia of control (FRT19AISO: retina, C; lamina, D) and mutant (X131: retina, E; lamina, F, G); X132: retina, H; lamina, I). Insets reveal empty cartidges, damaged mitochondria and autophagic profiles in shawn mutants. Three animals per genotype were analyzed (n = 3). Scale bars: retinas, 5 μm; and photoreceptor terminals, 2 μm. R, Rhabdomere structures; *, mitochondria; arrowhead, vacuoles; arrow, autophagic-like profiles.
Figure 3.

Rescue of synaptic defects and degeneration indicates specificity for shawn. A, Complementation analysis of the different shawn alleles. Lethality of the shawn alleles was rescued by sh+–HA and ubiquitous overexpression of Shawn with daughterless (da)–Gal4. PA, Pharate adult; P, pupae lethal; +, rescues lethality; −, does not rescue lethality; na, not available. B) Representative ERG traces for control (FRT19AISO) and rescue (sh1/2;sh+–HA/+, sh1;Da>sh, sh2;Da>sh) animals. Five flies were screened per genotype. C–F, TEM sections and insets of the retina and cartridges in single ommatidia rescued animals (sh1;eyFLP/sh+–HA and sh2;eyFLP/sh+–HA; retina, C, E; lamina, D, E). Scale bars: retinas, 5 μm; lamina, 2 μm. R, Rhabdomere structures; *, mitochondria.
Two-electrode voltage-clamp (TEVC) experiments were performed as described previously (Volders et al., 2012). Third-instar larvae were dissected in HL3 solution (in mm: 110 NaCl, 5 KCl, 10 MgCl2 · 6H2O, 10 NaHCO3, 30 sucrose, 5 trehalose, and 10 HEPES, pH 7.2), and motor neurons from segments A2–A3 were isolated using a suction electrode. Axons were stimulated at least 50% above threshold at 0.2 Hz (TEVC) in the presence of 0.2–0.5 mm CaCl2 respectively. For miniature analysis, recordings were performed in the presence of 1 μm TTX. Responses were measured in muscle 6 using sharp microelectrodes (±30 MΩ for current clamp and the voltage sensing electrode for TEVC, 10–15 MΩ for the current passing electrode for TEVC) filled with a 3:1 solution of 3 m KCl and 3 m KAc. Signals were amplified using the Axoclamp900A amplifier (Molecular Devices), filtered using a 1 kHz Bessel filter, and digitized at 10 kHz using a Digidata 1440A (Molecular Devices). For all recordings, membrane potentials were between −65 and −75 mV, with input resistance ≥4 MΩ. For TEVC, membrane potentials were clamped at −70 mV. Data were analyzed using Clampfit 10.5 (Molecular Devices). The amplitude of excitatory junction currents (EJCs) was calculated by averaging 60 responses recorded at 0.2 Hz. Miniature EJCs (mEJCs) were analyzed using the Clampfit 10.5 event-detection algorithm. Paired-pulse analysis was performed in the presence of 0.2 mm external CaCl2, and double pulses were given at 10, 20, 30, and 100 ms intervals.
Immunohistochemistry and confocal imaging.
For immunostainings, third-instar larvae were dissected in HL3 (see above, Electrophysiology) and fixed in 3.7% formaldehyde. Formaldehyde solution was washed three times with normal HL3 solution. Animals were subsequently permeabilized using PBX (PBS plus 0.4% Triton X-100) and blocked using PBX plus 10% normal goat serum (NGS). Samples were probed with primary antibodies in PBX plus 10% NGS and incubated overnight at 4°C. Primary antibody solution was washed away with PBX, and secondary antibody solution was added and incubated for 2 h at room temperature. After incubation, antibody solution was discarded, and samples were washed with PBX and mounted on a microscope slide using Vectashield (Vector Laboratories). Primary antibody used was mouse anti-HA (1:500; Eurogentec). Secondary antibody was Alexa Fluor 555-conjugated antibodies (1:500; Invitrogen). GFP was imaged using endogenous expression. Fluorescence was visualized using a Nikon A1R confocal microscope using a 60× oil-immersion objective with 1.4 numerical aperture (NA) using the NIS-elements advanced research software (Nikon). A maximum intensity Z projection was obtained using NIH ImageJ software.
Imaging of mitochondrial membrane potential.
The potentiometric dye tetramethylrhodamine ethyl ester (TMRE) was used to determine the mitochondrial membrane potential. Third-instar larvae carrying the different mutations and expressing the mitochondrial marker mito-GFP using the motor neuron driver D42–Gal4 were dissected in HL3 solution (see above, Electrophysiology). Larval fillets were incubated for 15 min in the presence of 50 nm TMRE (Abcam). Subsequently, external solution was discarded, and fillets were rinsed three times with normal HL3 solution without TMRE. Mitochondrial labeling of TMRE was imaged with a Nikon spinning disk confocal microscope with a 40× water dipping objective 0.8 NA. For mito-GFP, excitation wavelength was 488 nm and emission 525/50 nm, and, for TMRE, the excitation wavelength was 561 nm and emission was 595/50 nm. A 0.5 μm Z step was used to image complete NMJs. TMRE labeling intensity was determined using NIH ImageJ. A 32-bit image was used to threshold the GFP channel to localize mitochondria at the NMJ. An average projection of the TMRE channel was generated, and the thresholded image was used as a mask to determine the amount of TMRE labeling within neuronal mitochondria. The average labeling of two NMJs was used to determine mitochondrial membrane potential per tested animal.
Larval NMJ mitochondrial redox status.
Fillets of third-instar larvae expressing MTSroGFP2 at NMJs using the motor neuron driver OK6–Gal4 were prepared in HL3 solution (see above, Electrophysiology). Images of larval NMJs were captured using the Nikon A1R confocal microscope with emission wavelength of 535 nm and excitation wavelengths of 405 and 488 nm for oxidized and reduced roGFP2, respectively, using a 60× water-dipping objective and 1.0 NA. A zoom 4 and 0.5–0.75 μm Z step were used on confocal sections to image whole boutonic mitochondria. The oxidizing and reducing agents H2O2 (50 mm, 30 min in HL3 solution) and dithiothreitol (DTT; 10 mm, 15 min), respectively, were used to define the upper and lower detection range for fluorescence ratio changes. At least four NMJs per larvae were imaged and used for analysis. NIH ImageJ was used to subtract background and obtain 405 and 488 fluorescence in each Z section to calculate the 405/488 fluorescence ratios. The ratiometric images were made with NIH ImageJ software. A 32-bit image was thresholded on the 488 channel retaining the boutonic mitochondrial labeling, and background was set as NaN (“not a number”). The 405 and 488 thresholded areas were divided, and a maximum intensity projection of each stack was generated and displayed using the RGB rainbow lookup table in NIH ImageJ. Background was intentionally left black.
Metal analysis by high-resolution inductively coupled plasma mass spectrometer.
For metal determination experiments, flies were grown on black currant syrup plates containing fresh yeast paste. One hundred fifty flies per genotype were isolated and homogenized by using a porcelain mortar and pestle in chilled mitochondrial isolation buffer [MIM: 250 mm sucrose, 10 mm 3-(N-morpholino)-propanesulfonic acid] and spun at 1000 × g at 4°C for 5 min to remove the debris. The supernatant (H) was spun an additional 5 min at 1000 × g at 4°C to isolate the nuclear fraction (P1). The remaining supernatant (S1) was spun at 13,000 × g for 10 min at 4°C, the supernatant (S2) was transferred to an ultracentrifuge tube, and the pellet (P2) was resuspended in 500 μl of MIM buffer and spun 10 min at 13,000 × g at 4°C to isolate the mitochondria [pellet (P4), resuspended in 100 μl of MIM] and the endoplasmic reticulum (supernatant, S4). The cytosolic fraction (S3) and membranes (P3) were obtained by ultracentrifugation of S2 for 60 min at 55,000 × g at 4°C. Protein content for each fraction was determined using the Bradford protein assay (Bio-Rad). For each fraction, 2 μg of protein was used for Western blot analysis to define purity of the samples. Metal analysis was performed using a Thermo Fisher Scientific Element 2 XR high-resolution inductively coupled plasma mass spectrometer (ICP-MS) operated in medium resolution mode. In each sample, Ca, Mg, Mn, Fe, Cu, and Zn concentrations were determined. The instrument was calibrated using Certipur multi-element standard solution IV (Merck), and yttrium was used as internal standard during sample analysis. National Institute of Standards and Technology (NIST) Standard Reference Material 2976 (freeze-dried mussel tissue) and NIST Standard Reference Material 1640a (trace elements in natural water) were used for quality control of the digestion and metal analysis procedure. For metal analysis, a subsample of each subcellular fraction was transferred to a polypropylene bullet tube (Eppendorf) and dried at 60°C to remove water. Samples were subsequently dissolved by a microwave assisted acid digestion procedure. To each sample, 200 μl of 69% nitric acid (TraceMetal Grade; Fisher Chemical) was added, and the samples were placed in a leak-proof polycarbonate box (Bio-Safe Carrier; Nalgene) and transferred to a microwave (Samsung CST1660ST). The samples were then microwave treated by increasing the operational power in a stepwise manner from 100 W over 200–300 W until complete dissolution of the samples. After the second digestion step (from 200 to 300 W), 40 μl of 30% H2O2 (Normapur; VWR) was added to each sample. After digestion, the samples were diluted with 4 ml of Milli-Q water and transferred to 14 ml of polypropylene tubes and analyzed for the metals.
Metal concentrations were obtained for each fraction, and total mass (in micrograms) of metal present in input was determined. Total mass per fraction was subsequently normalized to the amount of protein present in that fraction (in grams) to control for differences in input loading.
Mitochondrial chelatable Fe2+ measurements.
The Rhodamine B-[(1,10-phenanthrolin-5-yl)-aminocarbonyl]benzylester dye (RPA) was used to determine the levels of chelatable Fe2+ in mitochondria (Petrat et al., 2002). Third-instar larvae were dissected in Schneider's medium (Gibco). Larval fillets were incubated for 20 min in the presence of 1 μm RPA (Squarix). Subsequently, fillets were washed three times for 5 min with Schneider's medium without RPA. The RPA control (RPAC; Squarix), the mitochondrial iron insensitive dye, was used as loading control following the same protocol as for RPA. Muscles 6 and 7 of the A2–A3 segments were imaged with a zoom 4 using a 60× water-immersion objective with 1.0 NA and a Nikon A1R confocal microscope. Images were acquired with NIS-Elements AR (Nikon) and processed with NIH ImageJ. RPA and RPAC were excited with the wavelength 561 nm, whereas the emission was filtered between 570 and 620 nm. The intensities of RPA and RPAC were quantified using the NIH ImageJ software. The mean intensities of muscle mitochondria in single sections were measured and corrected for the background intensity.
Mitochondrial Aconitase activity assay.
Both the isolation of mitochondria and the Aconitase activity assay were performed as described previously (Esposito et al., 2013). Briefly, 50 to 60 larvae were crushed in 1 ml of chilled MIM (Mitosciences) by using a porcelain mortar and pestle and then spun twice at 1000 × g for 5 min at 4°C to remove cellular debris. Next, the supernatant was spun at 12,000 × g, for 15 min at 4°C. The pellet, containing the mitochondria, was washed with 1 ml of MIM and resuspended in 40 μl of MIM supplemented with protease inhibitors without EDTA (complete cocktail; Roche). The Aconitase enzyme activity microplate kit (Mitosciences) was used according to the protocol of the manufacturer to measure mitochondrial Aconitase activity. Twenty micrograms of mitochondria were incubated with assay buffer, and the activity was analyzed by measuring the conversion of isocitrate to cis-aconitate as an increase at 240 nm UV absorbance. Measurements were recorded every 1 min for 30 min at room temperature using the EnVision 2103 Multilabel Plate Reader (PerkinElmer Life and Analytical Sciences). The Aconitase activity rates were calculated for all samples with the formula Rate (OD/min) = (A240t=23 − A240t=13)/10 min and corrected for the rate of the blank (no mitochondria). At these time points, the rates were linearly increasing for all samples. The Aconitase activity rate was normalized to the amount of Aconitase (normalized for ATPaseβ levels), determined by Western blot of the same amount of mitochondria (20 μg) of the same mitochondrial preps used in the Aconitase assay. For each genotype, three mitochondrial preps were analyzed in triplicate.
Western blotting.
Samples for mass spectrometry and mitochondrial preps for the Aconitase assay were boiled in 1× lithium dodecyl sulfate buffer (Invitrogen) with 2% 2-mercaptoethanol for 10 min at 70°C or 95°C. Next, the samples were analyzed by SDS-PAGE using Novex 4–12% Bis-Tris gels (Invitrogen) and transferred to a PVDF membrane (Bio-Rad) or a nitrocellulose membrane (Aconitase assay; Bio-Rad) using the Trans-Blot Turbo Transfer System (Bio-Rad). Primary antibodies used included the following: mouse anti-Tubulin (1:1000; Sigma), mouse anti-ATPaseβ (1:1000; Abcam), and rabbit anti-ACO2 (1:1000; ABGENT). HRP-conjugated secondary antibodies used included the following: goat anti-mouse IgG (1:5000; Jackson ImmunoResearch) and mouse anti-rabbit IgG (1:10,000; Jackson ImmunoResearch). Next, antibody binding was visualized with ECL Western Lightning Western Blot Chemiluminescence Reagent (PerkinElmer Life and Analytical Sciences) and imaged using ImageQuant LAS 4000 Mini (GE Healthcare). For the Aconitase assay, band intensities of the Aconitase signal and the ATPaseβ signal for each sample were quantified using Image Studio Lite version 5.2 (LI-COR Biosciences) and corrected for the background.
Electron microscopy.
Heads from adult flies were obtained using a sharp razor blade, cut in half and immediately fixed in 2% paraformaldehyde and 2% glutaraldehyde in 0.1 m Na-Cacodylate buffer (pH 7.4) for 2 h at room temperature, and subsequently kept in the fridge overnight. Eyes were washed four times for 15 min in a glass recipient with 0.1 m Na-Cacodylate, pH 7.4, and subsequently osmicated with 2% osmium (OsO4/Na-Cacodylate buffer) on ice for 2 h. Samples were washed with chilled 0.1 m Na-Cacodylate buffer for 15 min, followed by a 15 min wash with double-distilled (dd) H2O. Samples were dehydrated using a series of ethanol and stained with 4% uranyl acetate. After dehydration, samples were placed in propylene oxide for two times for 10 min and embedded in Agar 100 (Laborimpex; Agar Scientific). Larval NMJs were similarly processed as fly heads, but they were fixed in 4% paraformaldehyde and 1% glutaraldehyde in 0.1 m Na-Cacodylate buffer, pH 7.4. After the washing step with ddH2O, samples were stained with 2% uranyl acetate and again washed with ddH2O before dehydration. Subsequently, the same steps were followed as described for the preparation of fly heads. Ultrathin sections (70 nm) were cut on an EM UC7 ultratome (Leica), collected on grids (Laborimpex; Agar Scientific), coated with Butvar, and imaged using a JEM 1400 transmission electron microscope (JEOL). Images were acquired at 80 kV using an 11 megapixel bottom-mounted camera (Quemesa; Olympus) and iTEM5.2 Software (Olympus).
Statistical analyses.
All data were analyzed using GraphPad Prism 6 software. Experiments on mitochondrial membrane potential labeling, mitochondrial redox status (see Fig. 5), and metal determination experiments (see Fig. 7) were analyzed using one-way ANOVA with a post hoc Tukey's test for multiple comparisons. Electrophysiological data (see Fig. 6) were analyzed using a Student's t test and one-way ANOVA with post hoc Tukey's test for multiple comparisons in 0.4 mm CaCl2. Iron measurements were analyzed using a Kruskal–Wallis test with post hoc Dunn for multiple comparison (RPA; see Fig. 7G) and a one-way ANOVA with post hoc Dunnett's test for multiple comparison (RPAC; see Fig. 7H). Aconitase activity (see Fig. 7I) was analyzed using a one-way ANOVA with post hoc Dunnett's test for multiple comparison. Statistical significance is depicted as follows: *p < 0.05, **p < 0.01, ***p < 0.001. Specific p values for ANOVA are described in the figure legends.
Figure 5.

Mitochondrial function is disrupted in shawn mutants. A, shawn mutants, labeled with 50 nm TMRE for 15 min, display a more positive mitochondrial membrane potential. Scale bar, 10 μm. Insets in the TMRE channel represent merges of mito-GFP (green) and TMRE (magenta). B, TMRE labeling at presynaptic terminals was quantified using the D42–Gal4>mito–GFP signal as a mask. Although TMRE labeling in the muscles is clearly decreased, we focused here on the quantification of neuronal mitochondria. The number of animals analyzed is indicated in the bar graphs. On average, two NMJs per animal were analyzed. ns, Not significant; *p < 0.05; **p < 0.01; F(5,100) = 5.296, ANOVA (p = 0.0002). C, Mitochondrial redox status in shawn mutants is increased. Ratio quantification of the oxidized/reduced MTSroGFP2 signal for control, mutant, rescue, DTT (gray), and H2O2 (gray) samples. The number of animals analyzed is indicated in the bar graphs. On average, four NMJs per animal were analyzed. ns, Not significant; ***p < 0.001, F(6,30) = 16.25, ANOVA (p < 0.0001). Dotted lines represent the working range as defined by H2O2 (upper limit) and DTT (lower limit) treatment. D, Overview of ratiometric images of MTSroGFP2 at larval NMJs. Color bar of the ratio: blue indicates low oxidized/reduced ratio, red indicates high oxidized/reduced ratio; arrowheads highlight the increased oxidized/reduced ratio in shawn mutants. Scale bar, 5 μm.
Figure 7.

Loss of Shawn induces metal dyshomeostasis in flies. A–C, Quantification of the total metal concentrations in pharate adults (A), the cytosolic (B) and mitochondrial (C) fractions of control (FRT19AISO/CSW, black; pharate adults, n = 6; cytosol, n = 5; mitochondria, n = 6), mutant (sh1/Δ36.3, orange; pharate adults, n = 3; cytosol, n = 2; mitochondria, n = 3) and rescue (sh1/Δ36.3;sh+–HA/+, blue; pharate adults, n = 4; cytosol, n = 3; mitochondria, n = 4) animals. Metal amount is expressed in micrograms per grams protein. ns, Not significant; *p < 0.05; ***p < 0.001. Pharate adults: Mn2+, F(2,10) = 6.065, ANOVA (p = 0.0188); Ca2+, F(2,10) = 22.23, ANOVA (p = 0.0002); cytosolic Mn2+, F(2,7) = 6.591, ANOVA (p = 0.0246); mitochondrial Ca2+, F(2,10) = 15.16, ANOVA (p = 0.0009). D, E, Western blot analysis of the cytosol-enriched and mitochondria-enriched fractions used for metal determination. Cytosolic and mitochondrial fractions of controls (C, FRT19AISO/CSw), mutants (M, sh1/36.3), and rescued flies (R, sh1/36.3;sh+-HA/+) were immunoblotted against α-Tubulin and ATPaseβ (C-V) to verify the purity of the samples. Each individual sample used is shown as C1–C4, M1–M3, and R1–R4. F, Representative single sections around the nuclei of muscle tissue in third-instar larvae for controls (FRT19AISO/CSw), shawn mutants (sh1/2 and sh1/ex), and rescued animals (sh1/2;sh+-HA/+) labeled with the chelatable Fe2+ sensitive dye RPA, specifically localizing to mitochondria. G, Quantification of the RPA fluorescence intensities measured in single sections of muscle tissue of controls (black, FRT19AISO/CSw, n = 21, N = 5), shawn mutants (red, sh1/2, n = 22, N = 5; orange, sh1/ex, n = 22, N = 5), and rescued larvae (blue, sh1/2;sh+–HA/+, n = 21, N = 5). ns, Not significant; ***p < 0.001; F(3,82) = 36.77, ANOVA (p < 0.0001). H, Quantification of the RPAC fluorescence intensities measured in single sections of muscle tissue of third-instar larvae of controls (black, FRT19AISO/CSw, n = 4, N = 14), shawn mutants (red, sh1/2, n = 4, N = 16; orange, sh1/ex, n = 4, N = 16), and rescued animals (blue, sh1/2;sh+–HA/+, n = 4, N = 14) labeled with RPAC. The RPAC dye is a mitochondrial localizing Fe2+ insensitive dye and was used as a mitochondrial loading control. Note that, in shawn mutants, no difference was observed in the loading of RPAC, indicating that there is equal loading of both RPAC and RPA in control and mutant animals. F(3,56) = 2.1, ANOVA (p = 0.1101). I, Quantification of the Aconitase activity rate measured in mitochondria isolated from control (black, FRT19AISO/CSw), shawn mutant (red, sh1/2; orange, sh1/ex), and rescued (blue, sh1/2;sh+–HA/+) third-instar larvae. The Aconitase activity rates were analyzed for three independent mitochondrial preps in triplicate and corrected for differences in protein levels of Aconitase. Western blot analysis to determine the levels of mitochondrial Aconitase (Acon) and ATPaseβ (C-V) are shown below the graph. The same mitochondrial preps used for the activity assay isolated from control (FRT19AISO/CSw), shawn mutants (sh1/2 and sh1/ex), and rescued (sh1/2;sh+–HA/+) third-instar larvae were immunoblotted against Aconitase (Acon) and ATPaseβ (C-V). ns, Not significant; *p < 0.05; F(3,32) = 3.544, ANOVA (p = 0.0254).
Figure 6.

The Ca2+-mediated evoked response pathway is altered in shawn mutants. A, Representative raw traces for the EJP recordings (10 Hz stimulation for 10 min) at different timepoints (s) in control (FRT19A, black) and mutant (sh1/2, red) third-instar larvae. B, Quantification of EJP amplitudes. EJP amplitudes were binned every 30 s and normalized to the prestimulus amplitude. C, Representative raw data traces of the EJC recordings for control (FRT19AISO, black), mutant (sh1/36.3, orange; sh1/2, red), and rescue (sh1/2;sh+–HA/+, blue; sh1/2;OK6–Gal4,UAS-sh/+, green) animals in different extracellular concentrations of Ca2+. D, Quantification of the EJC amplitudes in the presence of different Ca2+ concentrations. At least seven larvae per genotype were analyzed. ns, Not significant; *p < 0.05; **p < 0.01; ***p < 0.001; F(4,43) = 7.985, ANOVA (p < 0.0001). E, Representative traces for mEJC recordings and quantification of the cumulative amplitude probability. Nine larvae were analyzed per genotype. F, Quantification of paired-pulse ratio at the NMJ for the different interpulse intervals tested for control (FRT19AISO: 10 ms, n = 10; 20 ms, n = 8; 30 ms, n = 9; 100 ms, n = 10) and mutant (sh1/2: 10 ms, n = 7; 20 ms, n = 8; 30 ms, n = 8; 100 ms, n = 8) animals.
Results
Isolation of shawn
To isolate genes involved in synaptic function, we performed a large-scale forward genetic screen for mutants on the X chromosome of Drosophila (Fig. 1A). We established 2447 hemizygous lethal stocks and used the eyFLP system (Newsome et al., 2000) to create heterozygous female flies that are homozygous for the mutant X chromosome only in their eyes (see Materials and Methods). We then recorded ERGs, electrophysiological recordings of the response of the fly eye to a light stimulus. One hundred nineteen flies with a defective ERG response, signifying defects in normal neuronal communication or retinal integrity, were retained (see Materials and Methods; Fig. 1A,B; Heisenberg, 1971). Using duplication mapping and complementation crosses, we established 15 complementation groups that each encompass more than one allele, indicating that we isolated the mutant gene more than once in our screen (Table 2).
Table 2.
List of genes and corresponding human homologs isolated from the screen
| Complementation group | Fly gene | Human homologs |
|---|---|---|
| X1 | b-spectrin | SPTB, SPTBN1, SPTBN2, SPTBN4 |
| X2 | Cac | CACNA1A, CACNA1B, CACNA1E |
| X3 | Comt | NSF |
| X4 | DAAM | DAAM1, DAAM2 |
| X5 | Dor | VPS18 |
| X6 | Eag | KCNH1, KCNH5 |
| X7 | Elav | ELAVL1, ELAVL2, ELAVL3, ELAVL4 |
| X8 | Ewg | NRF1 |
| X9 | L(1)G0255 | FH |
| X10 | mamo | − |
| X11 | Por | PORC |
| X12 | ric8a | RIC8A, RIC8B |
| X13 | shawn | SLC25A39, SLC25A40 |
| X14 | Sicily | NDUFAF6 |
| X15 | SNF1A | PRKAA1, PRKAA2 |
− indicates that no human homolog was found.
We pursued one of the complementation groups (X13; Table 2) of which both mutants display a severe ERG phenotype (Fig. 1B). Compared with controls (FRT19AISO), flies with mutant eyes for either mutation show ERGs in which the on and off transients are absent (arrowheads). On and off transients arise in the postsynaptic cells in response to presynaptic transmitter release and appear abnormal when the tonic release of neurotransmitters from the photoreceptors is desynchronized by either too little or too much transmitter release (Belušič, 2011). The ERGs of X13 mutant eyes also show a smaller depolarization (arrow). The amplitude of the depolarization is a measure of how well the photoreceptors sense light. When the retina degenerates, the ERG amplitude decreases (Heisenberg, 1971; Wang and Montell, 2007).
To evaluate the underlying ultrastructural features, we performed transmission electron microscopy (TEM). In contrast to control retinas (Fig. 1C), the photoreceptor cell bodies in flies with X13 mutant eyes display many swollen mitochondria (Fig. 1E, inset and asterisk), vacuolization (Fig. 1E,H, arrowheads), and autophagic-like profiles (Fig. 1E, arrow). Note that, similar to controls, ommatidia in the retina of the X13 mutants show on average seven rhabdomeres in a cross-section, suggesting that the recruitment and development of the photoreceptors is not disrupted in the mutants per se (Fig. 1E,H). Photoreceptors send their axons to the lamina, and the mutant photoreceptor terminals produce synaptic contacts with the postsynaptic lamina neurons (Fig. 1D). Both X13 mutants harbor numerous terminals with very few organelles, such as synaptic vesicles (Fig. 1F,G,I, Lamina). In addition, mitochondria in these mutant terminals often lack most of their cristae, and they appear swollen (Fig. 1F,G,I, inset, asterisk). These data suggest that loss of X13 causes mitochondrial dysfunction in neuronal cell bodies and at synapses. These defects may also underlay the ERG defects in mutant eyes.
Next, recombination mapping, complementation with small duplications, and Sanger sequencing were used to map the lesions in the mutants (Fig. 2A). We identified a G-to-A mutation in shawn in both alleles leading to a G278E missense mutation in shawn1 (sh1) and a G282E missense mutation in shawn2 (sh2; Fig. 2B). These lesions are responsible for the lethality and ERG defects because endogenous expression of wild-type (WT) Shawn using a 6.02 kb genomic construct (sh+–HA; Fig. 2C) rescues these defects (Fig. 3). Furthermore, endogenous expression of WT Shawn restores the mitochondrial morphology and neuronal degeneration, indicating that these defects are specific to loss of Shawn (Fig. 3C–F). SHAWN is transcribed from a bicistronic locus that also encodes tyler (Fig. 2). However, the EMS-induced lesions that we identified only affect shawn because both sh1 and sh2 fail to complement a small P-element excision allele that we created that only removes the shawn open reading frame and not the tyler open reading frame (shΔ36.3; Figs. 2C, 3A). In addition, expression of WT SHAWN cDNA, but not mutant SHAWN cDNA harboring the G278E or the G282E mutation, rescues the lethality and phenotypes associated with both sh alleles (Fig. 3). Hence, sh1 and sh2 are loss-of-function alleles of shawn.
Shawn is a mitochondrial protein
Drosophila shawn encodes an evolutionary well-conserved carrier protein (yeast mtm1, 33% identity; human SLC25A39, 43% identity; and SLC25A40, 46% identity; Fig. 4A,B) thought to reside in mitochondria. SHAWN RNA is expressed at low levels throughout development (Fig. 4C), and, to determine the localization of the protein, we used the HA-tagged genomic shawn transgene that rescues the shawn EMS and P-element excision alleles. Unfortunately, we could not detect endogenous HA–Shawn using immunohistochemistry or Western blotting (data not shown), suggesting that the protein is present at levels below our detection limit. Therefore, we assessed the subcellular localization of WT Shawn using N-terminally HA-tagged UAS–cDNA constructs driven by daughterless–Gal4 (UAS–HA–shWT). Although no HA labeling is observed in the negative control (w1118), HA–shWT colocalizes very well with the mitochondrial marker mito-GFP (Fig. 4E–F″). In contrast, nSyb–HA, a non-mitochondrial protein (Uytterhoeven et al., 2011), does not colocalize with mito-GFP (Fig. 4I–I″). Hence, the data indicate that Shawn is a mitochondrial protein.
Figure 4.
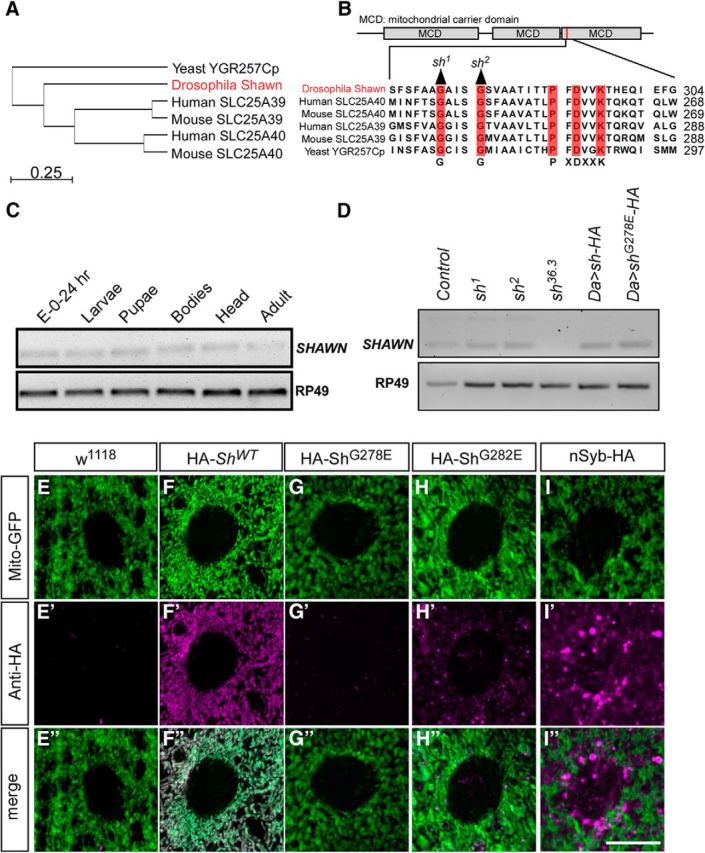
shawn encodes a mitochondrial carrier protein of the SLC25 family. A, Phylogenetic relationship of Shawn and the SLC25 family of mitochondrial carriers. Phylogenetic dendrogram of the amino acid similarity of Shawn and phylogenetic clustering of its mammalian counterparts. B, Protein structure of Shawn. Shawn has three mitochondrial carrier domains (MCD). Mutations were found in the third carrier domain and are displayed in the alignment of that region. Residues are conserved from yeast (YGR257C/mtm1) to human (SLC25A39 and SLC25A40). The residues of the conserved signature motif PX[D/E]XX[K/R] as well as sh1 and sh2 are depicted in red. C, RT-PCR of SHAWN performed at different developmental stages of Drosophila (embryo to adult). Primers for the housekeeping gene RP49 were used as loading control. D, RT-PCR against SHAWN in the different mutants and overexpression conditions. RP49 was used as a housekeeping gene. E–I″, Labeling of w1118 and animals expressing HA–Shawn (HA–ShWT), HA–ShawnG278E (HA–ShG278E), HA–ShawnG282E (HA–ShG282E), and nSyb–HA with the anti-HA antibody (E′–I′, magenta) in muscle tissue of third-instar larvae of Drosophila. Mitochondria were labeled by ubiquitous overexpression of mito-GFP using da–Gal4 (E–I, green). w1118 was included as negative control and did not show any HA labeling (E–E″). nSyb–HA was included as control for the overexpression of an HA-tagged protein, and no mitochondrial labeling was observed (I–I″). Scale bar, 10 μm.
sh1 and sh2 mutant animals still show SHAWN RNA expression, similar to controls, whereas shΔ36.3 mutants do not express SHAWN RNA (Fig. 4D). However, when we use the UAS/Gal4 system to express HA-tagged mutant proteins (UAS–HA–shG278E and UAS–HA–shG282E), they are almost undetectable, and the remaining protein now does not colocalize with mito-GFP (Fig. 4D,G–H″). These data are consistent with the inability of these mutant proteins to rescue the shawn mutant phenotypes. The mutations in sh1 and sh2 reside in evolutionary well conserved motifs: sh1 affects a G-X-X-X-G motif involved in the stabilization of transmembrane helix–helix interactions (Senes et al., 2000), whereas sh2 disrupts a glycine–proline hinge region (PX[D/E]XX[K/R]), thought to be necessary for carrier function (Palmieri and Pierri, 2010; Fig. 4B). Hence, the data indicate that the mutations in sh1 and sh2 destabilize Shawn protein and that they are severe loss-of-function or null mutants of shawn.
Loss of shawn affects mitochondrial function
Healthy mitochondria harbor a negative membrane potential that can be assessed using the potentiometric dye TMRE. In shawn mutants that express mito-GFP in their motor neurons to mark neuronal mitochondria, we find a significant decrease in TMRE fluorescence in the presynaptic mitochondria at synaptic boutons compared with controls. This defect in shawn mutants is rescued by the presence of a genomic sh+–HA rescue construct (Fig. 5A,B). These data indicate that the mitochondrial membrane potential of mitochondria in shawn mutants is less negative.
Shawn is upregulated in response to ROS (Girardot et al., 2004; Landis et al., 2004; Gruenewald et al., 2009). Therefore, we also assessed whether Shawn is needed in synaptic mitochondria to prevent oxidative stress in vivo. We expressed the redox-sensitive mitochondrial targeted GFP (MTSroGFP2; Hanson et al., 2004; Liu et al., 2012) in motor neurons. We took advantage of the ratiometric properties of MTSroGFP2 that allow us to measure changes in mitochondrial redox status in a pH-insensitive manner (Pouvreau, 2014). We measured the boutonic fluorescence when the probe was excited at 405 and 488 nm for the oxidized and reduced forms, respectively. Control animals dissected and incubated with H2O2 show an increase of 245% in the oxidized/reduced ratio of MTSroGFP2, although this ratio is decreased by 24% when controls are incubated with DTT (Fig. 5C,D). Similarly to the H2O2 exposure, shawn mutants present a significant increase of the MTSroGFP2 redox ratio, and this defect is rescued by expressing sh+–HA (Fig. 5C,D). These data suggest that boutonic mitochondria are subject to increased oxidative stress in the absence of shawn.
Neurotransmitter release is increased in shawn mutants
The human homologs of shawn (SLC25A39 and SLC25A40) reside in susceptibility loci for epilepsy, and several mitochondrial mutants in Drosophila are known to display vesicle trafficking defects during intense activity (Verstreken et al., 2005; Durmaz et al., 2009; Morais et al., 2009; Sirén et al., 2010; Sandoval et al., 2014). To analyze whether shawn is necessary to maintain normal synaptic function during high demand, we measured excitatory junctional potentials (EJPs) during 10 Hz stimulation in the presence of 2 mm extracellular Ca2+. The EJP amplitude decreases slightly after the first 10 s of stimulation to 78.12 ± 10.55% of initial amplitude in controls and is not more severe in shawn mutants: 84.48 ± 9.67% (Fig. 6A,B). During the remainder of the stimulation paradigm, shawn mutants never depress more than controls do and, in fact, even retain a slightly higher level of transmitter release (Fig. 6A,B). These data indicate that shawn mutants can maintain synaptic transmission at normal levels during prolonged high-frequency stimulation, and they exclude severe defects in endocytosis or reserve pool mobilization as has been observed in other mitochondrial mutants (Billups and Forsythe, 2002; Verstreken et al., 2005; Morais et al., 2009).
To further analyze the synaptic transmission defects induced by the loss of Shawn, we measured EJCs at larval NMJs. Our data indicate that, at different external Ca2+ concentrations (0.2–0.5 mm), shawn mutants harbor an increased EJC amplitude compared with controls, and this defect is rescued when sh+–HA is present or when WT shawn is expressed only presynaptically (Fig. 6C,D). Recording of mEJCs that are elicited by spontaneous synaptic vesicle fusions does not show differences in the distribution of their amplitudes between controls and shawn mutants (Fig. 6E), suggesting that individual vesicles are properly loaded with neurotransmitters and that the postsynaptic receptor field is not affected by shawn mutants (Fig. 6E). Consequently, the quantal content (EJC/mEJC) is increased in shawn mutants. Our results suggest that the defects in synaptic transmission in shawn mutants originate presynaptically.
The defects we observe are consistent with defective Ca2+ handling during stimulation, and we further tested this idea by measuring paired-pulse facilitation. Two stimuli with a short interstimulus interval are presented, and the ratio of the second peak amplitude over the first is calculated. A larger ratio is considered to indicate a defect in Ca2+ clearance during stimulation. Paired-pulse ratios recorded in shawn mutants in 0.2 mm external Ca2+ are increased compared with controls at all the interstimulus intervals tested (10–100 ms; Fig. 6F). Together, the elevated responses under basal physiological conditions and the elevated paired-pulse synaptic facilitation observed in shawn mutants suggest that loss of Shawn stimulates glutamatergic transmission.
Shawn affects subcellular metal homeostasis
Previous work using yeast mtm1/slc25a39 revealed defects in Fe and Mn homeostasis (Luk et al., 2003; Yang et al., 2006; Naranuntarat et al., 2009; Park et al., 2013). shawn is ubiquitously expressed, and, to test whether metal homeostatic defects are present in shawn mutants, we used liquid chromatography (LC), followed by ICP-MS to measure metal concentrations in pharate adult flies (Fig. 7A--C; control, CSW/FRT19A; mutant, sh1/Δ36.3; rescue, sh1/Δ36.3;sh+–HA/+). We found that overall both Mn and Ca were increased in controls compared with mutants, and these defects were rescued by the introduction of one copy of WT shawn (Fig. 7A). No significant differences in total Fe, Cu, or Zn were found in shawn mutants (Fig. 7A). To further assess the metal distribution in mitochondria and the cytoplasm, we prepared subcellular fractionations of pharate adults (Fig. 7B,C). Purity of the samples was analyzed using Western blotting (Fig. 7D,E). Compared with controls, we observed an increase of Mn2+ levels in the cytoplasm of shawn mutants, and this defect is rescued by the presence of sh+–HA (Fig. 7B). Total cytosolic levels of other metals, including Fe, Cu, and Zn, are not different between mutants and controls (Fig. 7B). In mitochondrial fractions of shawn mutants, we find a significant increase in Ca2+ levels compared with controls, and this defect is rescued by sh+–HA (Fig. 7C). The total mitochondrial levels of Mn, Fe, Cu, and Zn in shawn mutants are similar to those measured in controls (Fig. 7C). These data suggest a defect in the clearance of cytoplasmic Mn2+ in shawn mutants and mitochondrial Ca2+ overload.
Although total iron concentrations in mtm1/slc25a39 in yeast and zebrafish were also found unaltered, the bioavailability of iron in these species was increased (Luk et al., 2003; Yang et al., 2006; Naranuntarat et al., 2009; Nilsson et al., 2009; Park et al., 2013). To test whether the bioavailability of iron was affected in Drosophila shawn mutants, we first used RPA as a tracer of free mitochondrial Fe2+ (Petrat et al., 2002). RPA selectively accumulates in mitochondria, and its fluorescence is quenched by Fe2+ (Petrat et al., 2002). Fluorescence imaging of mitochondria in larval muscle tissue showed a significant decrease in RPA fluorescence in shawn mutants, indicating an increase in free Fe2+ (Fig. 7F,G). We used the iron-insensitive control, RPAC, to control for mitochondrial loading of the dye and did not find a significant difference between genotypes, indicating that the decrease in fluorescence is attributable to the presence of more free Fe2+ (Fig. 7H). Subsequently, we measured Aconitase activity to test the integrity of the Fe/S proteins. Similar to previous reports (Yang et al., 2006; Park et al., 2013), we found decreased Aconitase activity in shawn mutants compared with controls (Fig. 7I). Both free Fe2+ defects (RPA measurements) and Aconitase activity defects were rescued by reintroduction of one copy of shawn, indicating that these effects are specific. Overall, these data indicate that shawn mutants accumulate free Fe2+ and damaged Fe/S enzymes.
Increased cellular Mn2+, mitochondrial Ca2+, free Fe2+ concentrations, and glutamatergic transmission can be cytotoxic and may result in oxidative stress, mitochondrial dysfunction, and induction of cell death pathways, consistent with several of the defects we observe in shawn mutants (Fitsanakis et al., 2006; Maciejewski and Rothman, 2008; Kwakye et al., 2015). Furthermore, these defects may also culminate in neuronal and neuromuscular degeneration. To further scrutinize the role of shawn at the synapse, we analyzed the ultrastructure of the NMJ by standard TEM. The ultrastructure of the presynaptic terminals was very similar between mutant and controls (Fig. 8A,B). Shawn mutants display normal numbers and morphology of synaptic vesicles and active zones, and no apparent defects in mitochondrial morphology were observed (Fig. 8A--D). Therefore, we analyzed the ultrastructure of shawn mutant larval muscle cells that, in contrast to photoreceptor cells, receive excessive glutamatergic input from the motor neurons and are known to be more susceptible to oxidative stress (Altun et al., 2007; Marzetti et al., 2010). The body wall musculature in shawn mutants shows severe degeneration, including swollen mitochondria that contain large electron-dense inclusions and numerous autophagic profiles (Fig. 8E,F). These electron-dense structures may constitute sites of Ca2+ overload that in turn function as a proapoptotic signal. Hence, at the NMJ, loss of Shawn results in increased glutamatergic transmission that together with increased Mn2+, mitochondrial Ca2+, and free Fe2+ may synergize with the mitochondrial defects to cause severe defects and degeneration.
Figure 8.

Metal dyshomeostasis leads to muscular degeneration in shawn mutants. TEM images of one bouton in control (FRT19AISO; A) and mutant (sh1/2; B) at the NMJ of third-instar larvae. A, Active zone; M, mitochondria. Scale bar, 500 nm. C, Quantification of the synaptic vesicle diameter frequency from 7295 vesicles of 12 boutons from three control larvae (FRT19AISO, black) and 5276 vesicles of 11 boutons from three mutant larvae (sh1/2, red). D, Amount of active zones per bouton from control (FRT19AISO, n = 12) and mutant (sh1/2, n = 11) animals. Each circle represents the active zone density for one bouton. E, F, TEM overview of the musculature of third-instar larvae of control (FRT19AISO; E) and mutant (sh1/2, red) animals (F). Insets reveal autophagic structures (arrow) and mitochondria with electron-dense accumulations (asterisk). Scale bars, 2 μm.
Discussion
In this work, we describe an unbiased genetic screen for defects in neurotransmission and identified Shawn, a mitochondrial carrier protein required for mitochondrial function, normal intracellular metal homeostasis, and neuronal and neuromuscular integrity. The human homologs of shawn have been associated previously with epilepsy (Durmaz et al., 2009; Sirén et al., 2010) and defects in iron homeostasis (Luk et al., 2003; Yang et al., 2006; Naranuntarat et al., 2009; Park et al., 2013), but no experimental work had linked the role of these carriers to neuronal demise. Here, we present the first functional annotation of shawn and describe its role in promoting neuronal survival by maintaining mitochondrial integrity and function.
In Drosophila, shawn is encoded by bicistronic DNA that also encodes tyler. We established that our EMS mutations in shawn are missense mutations and that tyler is unaffected. Solute carrier proteins usually localize to the inner mitochondrial membrane (Palmieri 2013). However, SLC25A17 is known to localize to peroxisomes (Wylin et al., 1998; Honsho and Fujiki, 2001; Agrimi et al., 2012) and SLC25A49 and SLC25A50 localize to the outer mitochondrial membrane (Lamarca et al., 2008; Mao et al., 2008; Robinson et al., 2012). In mammalian MCF-7 cells (Yu et al., 2001) and yeast (Luk et al., 2003), SLC25A39 localizes to mitochondria. Here, we show that, in Drosophila, Shawn also localizes to mitochondria and that our missense mutations destabilize the protein. Unfortunately, we did not succeed to localize endogenous Shawn. RNA expression data (Flybase) and our data show that SHAWN is ubiquitously expressed at low levels, with increased expression in adult brains, consistent with previous reports (Haitina et al., 2006).
Mitochondrial dysfunction has been associated with neurotransmission defects (Billups and Forsythe, 2002; Verstreken et al., 2005; Morais et al., 2009), but shawn mutants display a potentiation of neurotransmission. Homeostatic regulation at the NMJ attributable to muscle pathology may contribute to increased neurotransmission (Frank, 2014). However, this type of regulation has not yet been described in relation to other mitochondrial mutants with similar neuromuscular pathology, and additional work will be needed here. Another possibility that may explain increased release in shawn mutants is that mitochondrial dysfunction results in altered neurotransmitter synthesis and glutamate levels (Bak et al., 2006). Our findings are relevant because the human Shawn homologs are widely expressed in the brain (Haitina et al., 2006) and are connected to neuronal disease. SLC25A39 and SLC25A40 are found in susceptibility loci for epilepsy (Durmaz et al., 2009; Sirén et al., 2010), and a mutation in SLC25A40 has been causally linked to chronic fatigue in patients with Sjögrens syndrome (Norheim et al., 2014). Interestingly, similar glutamate trafficking defects have been linked to epilepsy (Barker-Haliski and White, 2015). Hence, loss of Shawn results in an increase in glutamatergic transmission that might lower the threshold for epilepsy and therewith increases the susceptibility for the disease in humans.
shawn mutants harbor several hallmarks similar to other mitochondrial mutants. First, loss of Shawn results in an increased mitochondrial membrane potential (present study and Gonçalves et al., 2012). Similar to previous work (Park et al., 2013), mitochondria in shawn mutants are 2.5-fold more oxidized compared with controls and have decreased Aconitase activity, suggesting that the ROS species might contribute to mitochondrial damage (Yan et al., 1997). Work on the AgMC1/slc25a39 in Anopheles Gambiae has demonstrated somewhat different results in redox signaling. In the midgut, AgMC1 silencing results in a decrease in superoxide and H2O2 levels and production (Gonçalves et al., 2012), which might suggest that SLC25A39 and SLC25A40 have cell type-specific roles and affect different redox signaling pathways. However, mitochondrial Ca2+ overload and mitochondrial swelling in shawn mutants suggest that, in the nervous system, mutations in shawn result in mitochondrial oxidative stress and cell death, in line with the severe degeneration observed in mutant muscles and mutant photoreceptor terminals (Giorgi et al., 2008).
Mn levels are increased in shawn mutants, and excessive, prolonged exposure to Mn causes a neurodegenerative condition termed manganism that shows features similar to idiopathic Parkinson's disease (Mahalakshmi et al., 2014). Although excessive Mn2+ is toxic and causes mitochondrial defects, this transition metal is also essential for normal mitochondrial function. Mitochondria internalize Mn2+ that serves as a cofactor for numerous enzymes and proteins (Martinez-Finley et al., 2013). Mn2+ is necessary for the activation of the antioxidant SOD2, the enzyme that is responsible for the detoxification of superoxide anions (Ravindranath and Fridovich, 1975). Hence, elevated cytosolic Mn in shawn mutants might contribute to increased oxidative damage and stress in the mitochondria.
Total elevated Mn levels in shawn mutants are consistent with increased absorption or decreased excretion of Mn. Interestingly, Mn transport across membranes is usually not specific and transporters are often transporting different types of cations (Chen et al., 2015). For example, under normal homeostatic conditions, ferroportin can be used to export an excess in Fe or Mn (Hentze et al., 2010; Chen et al., 2015). Accumulations of free Fe2+ in shawn mutants might indicate defective iron or Mn transport by ferroportin. The secretory pathway Ca2+ ATPase 1 localizes to the Golgi apparatus and mediates Ca2+/Mn2+ homeostasis by transport to the Golgi or the translocation of Mn2+ to the secretory pathway (Mandal et al., 2000; Leitch et al., 2011; He and Hu, 2012). Therefore, mitochondrial dysfunction attributable to mutations in shawn might lead to inhibition or transcriptional downregulation in detoxification systems resulting in increased cytosolic Mn levels.
Loss of Shawn induces several metabolic adjustments, as indicated by the ICP-LC-MS on whole fly lysate, as well as the in vivo free Fe2+ measurements. We also performed ICP-LC-MS on cellular fractions to assess subcellular ion distributions, indicating increased cytosolic Mn and increased mitochondrial Ca. However, it is important to note that the fractionation used for the ICP-LC-MS experiments contain resealed fragments of the original network. Measuring the endogenous ion balances in mitochondria requires the membranes to stay intact during the fractionation and the correct membrane potential and proton gradient over the membrane to maintain the ion balance in its original state (Gunter et al., 2009). Therefore, we cannot exclude the effect of mechanical damage or changes in mitochondrial membrane potential to alter the subcellular ion balance as measured by ICP-LC-MS. In addition, all ICP-LC-MS experiments were performed on entire adult flies and cell type-specific effects are not revealed in this study, except for the live free Fe2+ measurements.
Iron dyshomeostasis has been associated previously with aging and aging-related diseases. In this work, we find that loss of Shawn results in an increased free Fe2+ pool in mitochondria (Fig. 7). Although free iron is potentially not harmful, it can become redox active and highly toxic in combination with increased levels of H2O2 (Sohal et al., 1999; Kakhlon and Cabantchik, 2002; Doulias et al., 2008). Under these circumstances, a minimal free iron pool is sufficient to result in cytotoxicity (Xu et al., 2010). The change in mitochondrial redox status in shawn mutants may turn this iron pool in a highly redox-active one. This in turn may lead to increased oxidative stress, mitochondrial dysfunction, and neuronal dysfunction and death.
Increased redox-active iron has been linked to age-related muscular degeneration. Increased mitochondrial iron in striatal muscles can alter redox metabolism and affect SOD2 activity (Altun et al., 2007; Marzetti et al., 2010). This defect may increase the susceptibility for apoptosis and suggests that muscles may be more vulnerable to the radicals produced during cellular respiration than neurons (Altun et al., 2007). Here, we show severe muscular degradation in shawn mutants, whereas mitochondrial morphology in glutamatergic neurons is less affected. This phenotype is very similar to that in Drosophila pink1 or parkin mutants, two Parkinson's disease genes that also carry an iron toxicity component in their phenotypes (Greene et al., 2003; Yang et al., 2003; Clark et al., 2006; Park et al., 2006; Morais et al., 2009; Esposito et al., 2013). Although the underlying causes for the mitochondrial defects are different, mitochondrial dysfunction is correlated with neurodegeneration (Lin and Beal, 2006; Haelterman et al., 2014). Overall, our data illustrate that reduced activity of SLC25A39 and SLC25A40 in humans might sensitize the cellular environment to toxic insults, predisposing them to neuronal defects.
For most carriers, a physiological substrate has not been identified (Palmieri 2013). Based on the residues in its substrate binding pocket, shawn could be an amino acids transporter (Robinson and Kunji, 2006). Close phylogenetic relationship with SLC25A38 (Palmieri 2013), defects in heme synthesis in zebrafish (Nilsson et al., 2009), and defects in ALA synthase in yeast mutants (Whittaker et al., 2015) would suggest glycine as a possible substrate. Conversely, SLC25A40 was found recently in a family with hypertriglyceridemia, implicating this protein in transporting substrates involved in fat metabolism (Rosenthal et al., 2013). Transport assays will be necessary to identify the physiological substrates of this carrier. Our work offers the first in vivo genetic model that link metabolic pathways of shawn with neurological defects and degeneration. Additional analyses will reveal the interesting links on how metabolic dysfunction sensitizes neurons for toxic insults.
Footnotes
This work was supported by European Research Council Grants StG 260678 and CoG 646671, Flemish Fund for Scientific Research Grants G088515N, G094915N, G079013N, and G053913N, Research Fund Catholic University Leuven Grant GOA/13/017, a Methusalem grant of the Flemish Government, the Leuven University Fund (Opening the Future), and the Flanders Institute for Biotechnology. The Nikon spinning disk was acquired through a Correlative Light Electron Microscopy grant to Flanders Institute for Biotechnology BioImaging Core. J.R.S. and I.M. are supported by an Agency for Innovation by Science and Technology in Flanders fellowship, and V.U. is supported by a Fund for Scientific Research postdoctoral fellowship. We thank the Bloomington Stock Center and the Developmental Studies Hybridoma bank, as well as Giovanni Esposito, Vanessa Morais, and the Bart De Strooper laboratory for reagents and members of the Verstreken laboratory for comments. We thank Sebastian Munck and Nikky Corthout from Light Microscopy and Imaging Network for all imaging related assistance and comments.
The authors declare no competing financial interests.
References
- Agrimi G, Russo A, Scarcia P, Palmieri F. The human gene SLC25A17 encodes a peroxisomal transporter of coenzyme A, FAD and NAD+ Biochem J. 2012;443:241–247. doi: 10.1042/BJ20111420. [DOI] [PubMed] [Google Scholar]
- Altun M, Edström E, Spooner E, Flores-Moralez A, Bergman E, Tollet-Egnell P, Norstedt G, Kessler BM, Ulfhake B. Iron load and redox stress in skeletal muscle of aged rats. Muscle Nerve. 2007;36:223–233. doi: 10.1002/mus.20808. [DOI] [PubMed] [Google Scholar]
- Bak LK, Schousboe A, Waagepetersen HS. The glutamate/GABA-glutamine cycle: aspects of transport, neurotransmitter homeostasis and ammonia transfer. J Neurochem. 2006;98:641–653. doi: 10.1111/j.1471-4159.2006.03913.x. [DOI] [PubMed] [Google Scholar]
- Barker-Haliski M, White HS. Glutamatergic mechanisms associated with seizures and epilepsy. Cold Spring Harb Perspect Med. 2015;5:a022863. doi: 10.1101/cshperspect.a022863. [DOI] [PMC free article] [PubMed] [Google Scholar]
- Belušič G. ERG in Drosophila. Rijeka: InTech. In: Belušič G, editor. Electroretinograms. Rijeka: InTech; 2011. [Google Scholar]
- Billups B, Forsythe ID. Presynaptic mitochondrial calcium sequestration influences transmission at mammalian central synapses. J Neurosci. 2002;22:5840–5847. doi: 10.1523/JNEUROSCI.22-14-05840.2002. [DOI] [PMC free article] [PubMed] [Google Scholar]
- Calì T, Ottolini D, Brini M. Mitochondrial Ca(2+) and neurodegeneration. Cell Calcium. 2012;52:73–85. doi: 10.1016/j.ceca.2012.04.015. [DOI] [PMC free article] [PubMed] [Google Scholar]
- Chen P, Chakraborty S, Mukhopadhyay S, Lee E, Paoliello MM, Bowman AB, Aschner M. Manganese homeostasis in the nervous system. J Neurochem. 2015;134:601–610. doi: 10.1111/jnc.13170. [DOI] [PMC free article] [PubMed] [Google Scholar]
- Clark IE, Dodson MW, Jiang C, Cao JH, Huh JR, Seol JH, Yoo SJ, Hay BA, Guo M. Drosophila pink1 is required for mitochondrial function and interacts genetically with parkin. Nature. 2006;441:1162–1166. doi: 10.1038/nature04779. [DOI] [PubMed] [Google Scholar]
- Culotta VC, Yang M, O'Halloran TV. Activation of superoxide dismutases: putting the metal to the pedal. Biochim Biophys Acta. 2006;1763:747–758. doi: 10.1016/j.bbamcr.2006.05.003. [DOI] [PMC free article] [PubMed] [Google Scholar]
- Doulias PT, Vlachou C, Boudouri C, Kanavaros P, Siamopoulos KC, Galaris D. Flow cytometric estimation of “labile iron pool” in human white blood cells reveals a positive association with ageing. Free Radic Res. 2008;42:253–259. doi: 10.1080/10715760801911649. [DOI] [PubMed] [Google Scholar]
- Durmaz B, Wollnik B, Cogulu O, Li Y, Tekgul H, Hazan F, Ozkinay F. Pontocerebellar hypoplasia type III (CLAM): extended phenotype and novel molecular findings. J Neurol. 2009;256:416–419. doi: 10.1007/s00415-009-0094-0. [DOI] [PubMed] [Google Scholar]
- Esposito G, Vos M, Vilain S, Swerts J, De Sousa Valadas J, Van Meensel S, Schaap O, Verstreken P. Aconitase causes iron toxicity in Drosophila pink1 mutants. PLoS Genet. 2013;9:e1003478. doi: 10.1371/journal.pgen.1003478. [DOI] [PMC free article] [PubMed] [Google Scholar]
- Fernandes AC, Uytterhoeven V, Kuenen S, Wang YC, Slabbaert JR, Swerts J, Kasprowicz J, Aerts S, Verstreken P. Reduced synaptic vesicle protein degradation at lysosomes curbs TBC1D24/sky-induced neurodegeneration. J Cell Biol. 2014;207:453–462. doi: 10.1083/jcb.201406026. [DOI] [PMC free article] [PubMed] [Google Scholar]
- Finsterer J. Inherited mitochondrial neuropathies. J Neurol Sci. 2011;304:9–16. doi: 10.1016/j.jns.2011.02.012. [DOI] [PubMed] [Google Scholar]
- Fitsanakis VA, Au C, Erikson KM, Aschner M. The effects of manganese on glutamate, dopamine and γ-aminobutyric acid regulation. Neurochem Int. 2006;48:426–433. doi: 10.1016/j.neuint.2005.10.012. [DOI] [PubMed] [Google Scholar]
- Frank CA. Homeostatic plasticity at the Drosophila neuromuscular junction. Neuropharmacology. 2014;78:63–74. doi: 10.1016/j.neuropharm.2013.06.015. [DOI] [PMC free article] [PubMed] [Google Scholar]
- Giorgi C, Pinton P, Romagnoli A, Rizzuto R. Ca2+ signaling, mitochondria and cell death. Curr Mol Med. 2008;8:119–130. doi: 10.2174/156652408783769571. [DOI] [PubMed] [Google Scholar]
- Girardot F, Monnier V, Tricoire H. Genome wide analysis of common and specific stress responses in adult Drosophila melanogaster. BMC Genomics. 2004;5:74. doi: 10.1186/1471-2164-5-74. [DOI] [PMC free article] [PubMed] [Google Scholar]
- Gonçalves RL, Oliveira JH, Oliveira GA, Andersen JF, Oliveira MF, Oliveira PL, Barillas-Mury C. Mitochondrial reactive oxygen species modulate mosquito susceptibility to Plasmodium infection. PLoS One. 2012;7:e41083. doi: 10.1371/journal.pone.0041083. [DOI] [PMC free article] [PubMed] [Google Scholar]
- Greene JC, Whitworth AJ, Kuo I, Andrews LA, Feany MB, Pallanck LJ. Mitochondrial pathology and apoptotic muscle degeneration in Drosophila parkin mutants. Proc Natl Acad Sci U S A. 2003;100:4078–4083. doi: 10.1073/pnas.0737556100. [DOI] [PMC free article] [PubMed] [Google Scholar]
- Gruenewald C, Botella JA, Bayersdorfer F, Navarro JA, Schneuwly S. Hyperoxia-induced neurodegeneration as a tool to identify neuroprotective genes in Drosophila melanogaster. Free Radic Biol Med. 2009;46:1668–1676. doi: 10.1016/j.freeradbiomed.2009.03.025. [DOI] [PubMed] [Google Scholar]
- Gunter TE, Gavin CE, Gunter KK. The case for manganese interaction with mitochondria. Neurotoxicology. 2009;30:727–729. doi: 10.1016/j.neuro.2009.05.003. [DOI] [PMC free article] [PubMed] [Google Scholar]
- Gutiérrez-Aguilar M, Baines CP. Physiological and pathological roles of mitochondrial SLC25 carriers. Biochem J. 2013;454:371–386. doi: 10.1042/BJ20121753. [DOI] [PMC free article] [PubMed] [Google Scholar]
- Haelterman NA, Yoon WH, Sandoval H, Jaiswal M, Shulman JM, Bellen HJ. A mitocentric view of Parkinson's disease. Annu Rev Neurosci. 2014;37:137–159. doi: 10.1146/annurev-neuro-071013-014317. [DOI] [PMC free article] [PubMed] [Google Scholar]
- Haitina T, Lindblom J, Renström T, Fredriksson R. Fourteen novel human members of mitochondrial solute carrier family 25 (SLC25) widely expressed in the central nervous system. Genomics. 2006;88:779–790. doi: 10.1016/j.ygeno.2006.06.016. [DOI] [PubMed] [Google Scholar]
- Hanson GT, Aggeler R, Oglesbee D, Cannon M, Capaldi RA, Tsien RY, Remington SJ. Investigating mitochondrial redox potential with redox-sensitive green fluorescent protein indicators. J Biol Chem. 2004;279:13044–13053. doi: 10.1074/jbc.M312846200. [DOI] [PubMed] [Google Scholar]
- He W, Hu Z. The role of the Golgi-resident SPCA Ca2+/Mn2+ pump in ionic homeostasis and neural function. Neurochem Res. 2012;37:455–468. doi: 10.1007/s11064-011-0644-6. [DOI] [PubMed] [Google Scholar]
- Heisenberg M. Separation of receptor and lamina potentials in the electroretinogram of normal and mutant Drosophila. J Exp Biol. 1971;55:85–100. doi: 10.1242/jeb.55.1.85. [DOI] [PubMed] [Google Scholar]
- Hentze MW, Muckenthaler MU, Galy B, Camaschella C. Two to tango: regulation of mammalian iron metabolism. Cell. 2010;142:24–38. doi: 10.1016/j.cell.2010.06.028. [DOI] [PubMed] [Google Scholar]
- Honsho M, Fujiki Y. Topogenesis of peroxisomal membrane protein requires a short, positively charged intervening-loop sequence and flanking hydrophobic segments. study using human membrane protein PMP34. J Biol Chem. 2001;276:9375–9382. doi: 10.1074/jbc.M003304200. [DOI] [PubMed] [Google Scholar]
- Kakhlon O, Cabantchik ZI. The labile iron pool: characterization, measurement, and participation in cellular processes(1) Free Radic Biol Med. 2002;33:1037–1046. doi: 10.1016/S0891-5849(02)01006-7. [DOI] [PubMed] [Google Scholar]
- Kwakye GF, Paoliello MM, Mukhopadhyay S, Bowman AB, Aschner M. Manganese-induced parkinsonism and Parkinson's disease: shared and distinguishable features. Int J Environ Res Public Health. 2015;12:7519–7540. doi: 10.3390/ijerph120707519. [DOI] [PMC free article] [PubMed] [Google Scholar]
- Lamarca V, Marzo I, Sanz-Clemente A, Carrodeguas JA. Exposure of any of two proapoptotic domains of presenilin 1-associated protein/mitochondrial carrier homolog 1 on the surface of mitochondria is sufficient for induction of apoptosis in a Bax/Bak-independent manner. Eur J Cell Biol. 2008;87:325–334. doi: 10.1016/j.ejcb.2008.02.004. [DOI] [PubMed] [Google Scholar]
- Landis GN, Abdueva D, Skvortsov D, Yang J, Rabin BE, Carrick J, Tavaré S, Tower J. Similar gene expression patterns characterize aging and oxidative stress in Drosophila melanogaster. Proc Natl Acad Sci U S A. 2004;101:7663–7668. doi: 10.1073/pnas.0307605101. [DOI] [PMC free article] [PubMed] [Google Scholar]
- Leitch S, Feng M, Muend S, Braiterman LT, Hubbard AL, Rao R. Vesicular distribution of secretory pathway Ca2+-ATPase isoform 1 and a role in manganese detoxification in liver-derived polarized cells. BioMetals. 2011;24:159–170. doi: 10.1007/s10534-010-9384-3. [DOI] [PMC free article] [PubMed] [Google Scholar]
- Lin MT, Beal MF. Mitochondrial dysfunction and oxidative stress in neurodegenerative diseases. Nature. 2006;443:787–795. doi: 10.1038/nature05292. [DOI] [PubMed] [Google Scholar]
- Liu Z, Celotto AM, Romero G, Wipf P, Palladino MJ. Genetically encoded redox sensor identifies the role of ROS in degenerative and mitochondrial disease pathogenesis. Neurobiol Dis. 2012;45:362–368. doi: 10.1016/j.nbd.2011.08.022. [DOI] [PMC free article] [PubMed] [Google Scholar]
- Luk E, Carroll M, Baker M, Culotta VC. Manganese activation of superoxide dismutase 2 in Saccharomyces cerevisiae requires MTM1, a member of the mitochondrial carrier family. Proc Natl Acad Sci U S A. 2003;100:10353–10357. doi: 10.1073/pnas.1632471100. [DOI] [PMC free article] [PubMed] [Google Scholar]
- Luk E, Yang M, Jensen LT, Bourbonnais Y, Culotta VC. Manganese activation of superoxide dismutase 2 in the mitochondria of Saccharomyces cerevisiae. J Biol Chem. 2005;280:22715–22720. doi: 10.1074/jbc.M504257200. [DOI] [PubMed] [Google Scholar]
- Maciejewski PK, Rothman DL. Proposed cycles for functional glutamate trafficking in synaptic neurotransmission. Neurochem Int. 2008;52:809–825. doi: 10.1016/j.neuint.2007.09.015. [DOI] [PMC free article] [PubMed] [Google Scholar]
- Mahalakshmi AM, Nidavani RB, Suresh B. Is manganese induced neurotoxicity a potential model for Parkinson's Disease? An overview on its complications. Int J Pharm Pharm Sci. 2014;6:6–15. [Google Scholar]
- Mandal D, Woolf TB, Rao R. Manganese selectivity of Pmr1, the yeast secretory pathway ion pump, is defined by residue Gln783 in transmembrane segment 6: residue Asp778 is essential for cation transport. J Biol Chem. 2000;275:23933–23938. doi: 10.1074/jbc.M002619200. [DOI] [PubMed] [Google Scholar]
- Mao G, Tan J, Gao W, Shi Y, Cui MZ, Xu X. Both the N-terminal fragment and the protein-protein interaction domain (PDZ domain) are required for the pro-apoptotic activity of presenilin-associated protein PSAP. Biochim Biophys Acta. 2008;1780:696–708. doi: 10.1016/j.bbagen.2008.01.013. [DOI] [PMC free article] [PubMed] [Google Scholar]
- Martinez-Finley EJ, Gavin CE, Aschner M, Gunter TE. Manganese neurotoxicity and the role of reactive oxygen species. Free Radic Biol Med. 2013;62:65–75. doi: 10.1016/j.freeradbiomed.2013.01.032. [DOI] [PMC free article] [PubMed] [Google Scholar]
- Marzetti E, Hwang JC, Lees HA, Wohlgemuth SE, Dupont-Versteegden EE, Carter CS, Bernabei R, Leeuwenburgh C. Mitochondrial death effectors: relevance to sarcopenia and disuse muscle atrophy. Biochim Biophys Acta. 2010;1800:235–244. doi: 10.1016/j.bbagen.2009.05.007. [DOI] [PMC free article] [PubMed] [Google Scholar]
- Merhi A, Gérard N, Lauwers E, Prévost M, André B. Systematic mutational analysis of the intracellular regions of yeast gap1 permease. PLoS One. 2011;6:e18457. doi: 10.1371/journal.pone.0018457. [DOI] [PMC free article] [PubMed] [Google Scholar]
- Morais VA, Verstreken P, Roethig A, Smet J, Snellinx A, Vanbrabant M, Haddad D, Frezza C, Mandemakers W, Vogt-Weisenhorn D, Van Coster R, Wurst W, Scorrano L, De Strooper B. Parkinson's disease mutations in PINK1 result in decreased complex I activity and deficient synaptic function. EMBO Mol Med. 2009;1:99–111. doi: 10.1002/emmm.200900006. [DOI] [PMC free article] [PubMed] [Google Scholar]
- Naranuntarat A, Jensen LT, Pazicni S, Penner-Hahn JE, Culotta VC. The interaction of mitochondrial iron with manganese superoxide dismutase. J Biol Chem. 2009;284:22633–22640. doi: 10.1074/jbc.M109.026773. [DOI] [PMC free article] [PubMed] [Google Scholar]
- Newsome TP, Asling B, Dickson BJ. Analysis of Drosophila photoreceptor axon guidance in eye-specific mosaics. Development. 2000;127:851–860. doi: 10.1242/dev.127.4.851. [DOI] [PubMed] [Google Scholar]
- Nilsson R, Schultz IJ, Pierce EL, Soltis KA, Naranuntarat A, Ward DM, Baughman JM, Paradkar PN, Kingsley PD, Culotta VC, Kaplan J, Palis J, Paw BH, Mootha VK. Discovery of genes essential for heme biosynthesis through large-scale gene expression analysis. Cell Metab. 2009;10:119–130. doi: 10.1016/j.cmet.2009.06.012. [DOI] [PMC free article] [PubMed] [Google Scholar]
- Norheim KB, Le Hellard S, Nordmark G, Harboe E, Gøransson L, Brun JG, Wahren-Herlenius M, Jonsson R, Omdal R. A possible genetic association with chronic fatigue in primary Sjögren's syndrome: a candidate gene study. Rheumatol Int. 2014;34:191–197. doi: 10.1007/s00296-013-2850-9. [DOI] [PubMed] [Google Scholar]
- Palmieri F. The mitochondrial transporter family SLC25: identification, properties and physiopathology. Mol Aspects Med. 2013;34:465–484. doi: 10.1016/j.mam.2012.05.005. [DOI] [PubMed] [Google Scholar]
- Palmieri F. Mitochondrial transporters of the SLC25 family and associated diseases: a review. J Inherit Metab Dis. 2014;37:565–575. doi: 10.1007/s10545-014-9708-5. [DOI] [PubMed] [Google Scholar]
- Palmieri F, Pierri CL. Structure and function of mitochondrial carriers—role of the transmembrane helix P and G residues in the gating and transport mechanism. FEBS Lett. 2010;584:1931–1939. doi: 10.1016/j.febslet.2009.10.063. [DOI] [PubMed] [Google Scholar]
- Park J, Lee SB, Lee S, Kim Y, Song S, Kim S, Bae E, Kim J, Shong M, Kim JM, Chung J. Mitochondrial dysfunction in Drosophila PINK1 mutants is complemented by parkin. Nature. 2006;441:1157–1161. doi: 10.1038/nature04788. [DOI] [PubMed] [Google Scholar]
- Park J, McCormick SP, Chakrabarti M, Lindahl PA. Insights into the iron-ome and manganese-ome of Δmtm1 Saccharomyces cerevisiae mitochondria. Metallomics. 2013;5:656–672. doi: 10.1039/c3mt00041a. [DOI] [PMC free article] [PubMed] [Google Scholar]
- Pebay-Peyroula E, Dahout-Gonzalez C, Kahn R, Trézéguet V, Lauquin GJ, Brandolin G. Structure of mitochondrial ADP/ATP carrier in complex with carboxyatractyloside. Nature. 2003;426:39–44. doi: 10.1038/nature02056. [DOI] [PubMed] [Google Scholar]
- Petrat F, Weisheit D, Lensen M, de Groot H, Sustmann R, Rauen U. Selective determination of mitochondrial chelatable iron in viable cells with a new fluorescent sensor. Biochem J. 2002;362:137–147. doi: 10.1042/bj3620137. [DOI] [PMC free article] [PubMed] [Google Scholar]
- Pouvreau S. Genetically encoded reactive oxygen species (ROS) and redox indicators. Biotechnol J. 2014;9:282–293. doi: 10.1002/biot.201300199. [DOI] [PubMed] [Google Scholar]
- Rao VK, Carlson EA, Yan SS. Mitochondrial permeability transition pore is a potential drug target for neurodegeneration. Biochim Biophys Acta. 2014;1842:1267–1272. doi: 10.1016/j.bbadis.2013.09.003. [DOI] [PMC free article] [PubMed] [Google Scholar]
- Ravindranath SD, Fridovich I. Isolation and characterization of a manganese-containing superoxide dismutase from yeast. J Biol Chem. 1975;250:6107–6112. [PubMed] [Google Scholar]
- Robinson AJ, Kunji ER. Mitochondrial carriers in the cytoplasmic state have a common substrate binding site. Proc Natl Acad Sci U S A. 2006;103:2617–2622. doi: 10.1073/pnas.0509994103. [DOI] [PMC free article] [PubMed] [Google Scholar]
- Robinson AJ, Kunji ER, Gross A. Mitochondrial carrier homolog 2 (MTCH2): the recruitment and evolution of a mitochondrial carrier protein to a critical player in apoptosis. Exp Cell Res. 2012;318:1316–1323. doi: 10.1016/j.yexcr.2012.01.026. [DOI] [PubMed] [Google Scholar]
- Rosenthal EA, Ranchalis J, Crosslin DR, Burt A, Brunzell JD, Motulsky AG, Nickerson DA, Wijsman EM, Jarvik GP. Joint linkage and association analysis with exome sequence data implicates SLC25A40 in hypertriglyceridemia. Am J Hum Genet. 2013;93:1035–1045. doi: 10.1016/j.ajhg.2013.10.019. [DOI] [PMC free article] [PubMed] [Google Scholar]
- Rousset S, Alves-Guerra M-C, Mozo J, Miroux B, Cassard-Doulcier A-M, Bouillaud F, Ricquier D. The biology of mitochondrial uncoupling proteins. Diabetes. 2004;53(Suppl 1):S130–S135. doi: 10.2337/diabetes.53.2007.s130. [DOI] [PubMed] [Google Scholar]
- Sandoval H, Yao C, Chen K, Jaiswal M, Donti T, Lin YQ, Bayat V, Xiong B, Zhang K, David G, Charng W, Yamamoto S, Duraine L, Graham BH. Mitochondrial fusion but not fission regulates larval growth and synaptic development through steroid hormone production. Elife. 2014 doi: 10.7554/eLife.03558. doi: 10.7554/eLife.03558. Advance online publication. Retrieved January 4, 2016. [DOI] [PMC free article] [PubMed] [Google Scholar]
- Saraste M, Walker JE. Internal sequence repeats and the path of polypeptide in mitochondrial ADP/ATP translocase. FEBS Lett. 1982;144:250–254. doi: 10.1016/0014-5793(82)80648-0. [DOI] [PubMed] [Google Scholar]
- Senes A, Gerstein M, Engelman DM. Statistical analysis of amino acid patterns in transmembrane helices: the GxxxG motif occurs frequently and in association with beta-branched residues at neighboring positions. J Mol Biol. 2000;296:921–936. doi: 10.1006/jmbi.1999.3488. [DOI] [PubMed] [Google Scholar]
- Sirén A, Polvi A, Chahine L, Labuda M, Bourgoin S, Anttonen AK, Kousi M, Hirvonen K, Simola KO, Andermann E, Laiho A, Soini J, Koivikko M, Laaksonen R, Pandolfo M, Lehesjoki AE. Suggestive evidence for a new locus for epilepsy with heterogeneous phenotypes on chromosome 17q. Epilepsy Res. 2010;88:65–75. doi: 10.1016/j.eplepsyres.2009.09.022. [DOI] [PubMed] [Google Scholar]
- Sohal RS, Wennberg-Kirch E, Jaiswal K, Kwong LK, Forster MJ. Effect of age and caloric restriction on bleomycin-chelatable and nonheme iron in different tissues of C57BL/6 mice. Free Radic Biol Med. 1999;27:287–293. doi: 10.1016/S0891-5849(99)00052-0. [DOI] [PubMed] [Google Scholar]
- Stehling O, Lill R. The role of mitochondria in cellular iron-sulfur protein biogenesis: mechanisms, connected processes, and diseases. Cold Spring Harb Perspect Biol Perspect Med. 2013;3:1–17. doi: 10.1101/cshperspect.a011312. [DOI] [PMC free article] [PubMed] [Google Scholar]
- Uytterhoeven V, Kuenen S, Kasprowicz J, Miskiewicz K, Verstreken P. Loss of skywalker reveals synaptic endosomes as sorting stations for synaptic vesicle proteins. Cell. 2011;145:117–132. doi: 10.1016/j.cell.2011.02.039. [DOI] [PubMed] [Google Scholar]
- Verstreken P, Ly CV, Venken KJ, Koh TW, Zhou Y, Bellen HJ. Synaptic mitochondria are critical for mobilization of reserve pool vesicles at Drosophila neuromuscular junctions. Neuron. 2005;47:365–378. doi: 10.1016/j.neuron.2005.06.018. [DOI] [PubMed] [Google Scholar]
- Volders K, Scholz S, Slabbaert JR, Nagel AC, Verstreken P, Creemers JW, Callaerts P, Schwärzel M. Drosophila rugose is a functional homolog of mammalian Neurobeachin and affects synaptic architecture, brain morphology, and associative learning. J Neurosci. 2012;32:15193–15204. doi: 10.1523/JNEUROSCI.6424-11.2012. [DOI] [PMC free article] [PubMed] [Google Scholar]
- Wang T, Montell C. Phototransduction and retinal degeneration in Drosophila. Pflugers Arch. 2007;454:821–847. doi: 10.1007/s00424-007-0251-1. [DOI] [PubMed] [Google Scholar]
- Whittaker MM, Penmatsa A, Whittaker JW. The Mtm1p carrier and pyridoxal 5 0-phosphate cofactor trafficking in yeast mitochondria q. Arch Biochem Biophys. 2015;568:64–70. doi: 10.1016/j.abb.2015.01.021. [DOI] [PMC free article] [PubMed] [Google Scholar]
- Wylin T, Baes M, Brees C, Mannaerts GP, Fransen M, Van Veldhoven PP. Identification and characterization of human PMP34, a protein closely related to the peroxisomal integral membrane protein PMP47 of Candida boidinii. Eur J Biochem. 1998;258:332–338. doi: 10.1046/j.1432-1327.1998.2580332.x. [DOI] [PubMed] [Google Scholar]
- Xu J, Marzetti E, Seo AY, Kim JS, Prolla TA, Leeuwenburgh C. The emerging role of iron dyshomeostasis in the mitochondrial decay of aging. Mech Ageing Dev. 2010;131:487–493. doi: 10.1016/j.mad.2010.04.007. [DOI] [PMC free article] [PubMed] [Google Scholar]
- Yan LJ, Levine RL, Sohal RS. Oxidative damage during aging targets mitochondrial aconitase. Proc Natl Acad Sci U S A. 1997;94:11168–11172. doi: 10.1073/pnas.94.21.11168. [DOI] [PMC free article] [PubMed] [Google Scholar]
- Yang M, Cobine PA, Molik S, Naranuntarat A, Lill R, Winge DR, Culotta VC. The effects of mitochondrial iron homeostasis on cofactor specificity of superoxide dismutase 2. EMBO J. 2006;25:1775–1783. doi: 10.1038/sj.emboj.7601064. [DOI] [PMC free article] [PubMed] [Google Scholar]
- Yang Y, Nishimura I, Imai Y, Takahashi R, Lu B. Parkin suppresses dopaminergic neuron-selective neurotoxicity induced by Pael-R in Drosophila. Neuron. 2003;37:911–924. doi: 10.1016/S0896-6273(03)00143-0. [DOI] [PubMed] [Google Scholar]
- Yu XX, Lewin DA, Zhong A, Brush J, Schow PW, Sherwood SW, Pan G, Adams SH. Overexpression of the human 2-oxoglutarate carrier lowers mitochondrial membrane potential in HEK-293 cells: contrast with the unique cold-induced mitochondrial carrier CGI-69. Biochem J. 2001;375:369–375. doi: 10.1042/0264-6021:3530369. [DOI] [PMC free article] [PubMed] [Google Scholar]
- Zhai RG, Hiesinger PR, Koh TW, Verstreken P, Schulze KL, Cao Y, Jafar-Nejad H, Norga KK, Pan H, Bayat V, Greenbaum MP, Bellen HJ. Mapping Drosophila mutations with molecularly defined P element insertions. Proc Natl Acad Sci U S A. 2003;100:10860–10865. doi: 10.1073/pnas.1832753100. [DOI] [PMC free article] [PubMed] [Google Scholar]