Abstract
Background:
LKB1, also called STK11, is a tumor suppressor that functions as master regulator of cell growth, metabolism, survival, and polarity. Approximately 30-35% of patients with NSCLC possess inactivated LKB1, and these patients respond poorly to anti-PD-1/PD-L1 immunotherapy. Therefore, novel therapies targeting NSCLC with LKB1-loss are needed.
Methods:
We used a new in silico signaling analysis method to identify the potential therapeutic targets and reposition drugs by integrating gene expression data with the Kyoto Encyclopedia of Genes and Genomes (KEGG) signaling pathways. LKB1 wild type and deficient NSCLC cell lines, including knock out clones generated by CRISPR-Cas9, were treated with inhibitors of mTOR and PI3K and a dual inhibitor.
Results:
In silico experiment showed that inhibition of both mTOR and PI3K can be synergistically effective in LKB1 deficient NSCLC. In vitro and in vivo experiments showed the synergistic effect of mTOR inhibition and PI3K inhibition in LKB1 mutant NSCLC cell lines. The sensitivity to dual inhibition of mTOR and PI3K is higher in LKB1 mutant cell lines than wild-type cell lines. A higher compensatory increase of Akt phosphorylation after rapamycin treatment in LKB1 deficient cells compared to LKB1 wild type cells is responsible for the synergistic effect of mTOR and PI3K inhibition. Dual inhibition of mTOR and PI3K showed a greater decrease in protein expression of cell cycle regulating proteins in LKB1 knock out cells compared to LKB1 wild type cells.
Conclusion:
Dual molecular targeted therapy for mTOR and PI3K may be a promising therapeutic strategy in the specific population of lung cancer patients with LKB1 loss.
Keywords: LKB1, mTOR, PI3K, lung cancer, molecular targeted agent
1. Introduction:
Liver kinase B1 (LKB1, also called STK11) is serine-threonine kinase that plays an important role in many cellular functions that include growth, metabolism, survival, and polarity. Germline mutation of LKB1 causes Peutz-Jeghers syndrome, which is an autosomal dominant disease characterized by mucocutaneous pigmentation and hamartomatous polyps. In non-small-cell lung cancer (NSCLC), LKB1 is among the most commonly mutated genes, with loss of function occurring in approximately 30-35% of lung adenocarcinomas [1,2].
Understanding molecular pathways responsible for key phenotypes such as tumor proliferation has allowed the development of targeted therapeutic strategies effective in the treatment of defined subsets of cancers. However, targeting mutated tumor suppressors represents a challenge compared to targeting the expressed protein from oncogene, because mutant proteins with loss of function cannot be directly targeted. As LKB1 is a tumor suppressor that undergoes loss-of-function mutations, identifying pathways that are activated with LKB1 loss may be the only way to target such tumors.
Anti-programmed death protein-1 (PD-1) or programmed death-ligand1 (PD-L1) therapy has been introduced as a standard first or second-line treatment for advanced NSCLC recently, and this therapy can produce a durable response in patients [3]. However, LKB1 genomic alterations are associated with primary resistance to PD-1/PD-L1 blockade therapy in NSCLC [4]. Therefore, defining novel therapy targeting LKB1-mutant NSCLC is especially important.
The PI3K (Phosphatidylinositol-4,5-bisphosphate 3-kinase)-Akt (protein kinase B)-mTOR (mammalian target of rapamycin) signaling pathway is one of the most frequently dysregulated pathways in human cancers. This pathway controls key cellular processes, such as metabolism, motility, growth, and proliferation that support the survival, expansion, and dissemination of cancer cells [5]. The most studied effectors downstream of mTORC1 (mammalian target of rapamycin complex 1) are the ribosomal protein S6 kinases (S6K1/2) and the eukaryotic protein synthesis initiation factor 4E-binding proteins (4E-BP1/2). mTORC2 (mammalian target of rapamycin complex 2) mediates activation of PKB/Akt and serum/glucocorticoidregulated kinase 1 (SGK1). LKB1 negatively regulates mTORC1 kinase activity through AMPK phosphorylation of TSC2 and Raptor, therefore, LKB1 inactivation results in mTORC1 hyperactivation [6]. Consequently, the inhibition of mTOR has been tested as a therapeutic approach to target LKB1 mutant lung cancer, but those studies have yielded mixed results. Rapamycin as a single agent has been shown to potently inhibit the growth and viability of endometrial carcinoma, and oviductal neoplasias in Lkb1−/− genetically engineered mouse models [7, 8]. In the Kras;Lkb1−/− mouse lung tumor model, the PI3K/mTOR inhibitor BEZ235 was effective only when combined with the MEK inhibitor AZD6244 and a multi-targeted kinase targeting the Src-family, dasatinib [9]. In an in vitro study using 5 lung cancer cell lines (Calu-1, H460, H1299, H1792, and A549), LKB1 mutant cell lines were not more sensitive to the mTOR inhibitor everolimus than the LKB1 wild type cell lines. Knockdown of LKB1 in H1299 cells did not increase the sensitivity to the everolimus. Everolimus combined with a PI3Kinhibitor, LY294002, enhanced the sensitivity in both LKB1 wild-type H1792 cells and LKB1 mutant A549 cells [10].
The goal of this study was to investigate whether mTOR/PI3K pathway inhibition can be used as a potential therapeutic strategy against LKB1 deficient NSCLC. We started with a new signaling pathway analysis method to identify the potential therapeutic targets and reposition existing drugs by integrating gene expression data with the Kyoto Encyclopedia of Genes and Genomes (KEGG) signaling pathway. In this new signaling pathway analysis method, we hypothesized that proteins sitting on the particular signaling loop substructures (starting from any protein in the loop, there is always at least one path to come back to the same protein) were prioritized as the therapeutic targets for drug repositioning. At the same time, we also hypothesize that drug’s impact not just to its single or several therapeutic targets, but to this extracted loop (network) should be used to predict its treatment effect. Therefore, in the following, a drug prediction model was proposed based on these two hypotheses to discover promising treatments for LKB1 mutant tumors, then a specific novel mTOR/PI3K inhibitor was investigated by in vitro and in vivo experiments.
We evaluated mTOR/PI3K inhibition on LKB1 loss lung cancer to demonstrate the feasibility of this approach. We showed the sensitivity to dual inhibition of mTOR and PI3K is higher in LKB1 mutant cell lines than wild-type cell lines and that this effect is synergistic. The mechanism behind this sensitivity appears to be an enhanced decrease in protein expression of cell cycle regulators such as cyclin A, CDK2, and phospho-RB in LKB1 deficient cells. This study suggests that the dual molecular targeted therapy for mTOR and PI3K may be a promising therapeutic strategy in specific populations of lung cancer patients with mutated LKB1.
2. Methods and Materials:
2.1. Cell line RNA expression data.
In our computational experiments, we analyzed RNA expression of the LKB1 loss (A549, HCC15, H1355, H2122, H1993, and H23) and wild type (HCC2935, HCC78, Calu-1, H522, and H292) cell lines which were available from the Cancer Cell Line Encyclopedia (CCLE) database [11].
2.2. KEGG signaling pathways
Different categories of pathways for systems biology research represented in the KEGG pathway database are selected as directed background molecular interaction network; and in this paper we focus on signal transduction pathways for humans [12]. The KEGG database includes 11 types of protein interactions: the activation and inhibition interactions were left unchanged, the remaining 9 protein-protein interactions (phosphorylation, dephosphorylation, ubiquitination, deubiquitination, glycosylation, methylation, indirect effect or state change, binding/association, and dissociation) were identified as either activation or inhibition according to their specific functional behaviors on a pair-by-pair basis.
2.3. Disease network and loop sub-structure extraction model
For a specific gene A, the expression ratio is defined as:
| (1) |
Where Expresmt(A) and Expreswt(A) denotes the average expression of gene A among LKB1 mutant and wide type cell lines.
2.3.1. Edge score model
We use the following equation to characterize the probability of occurrence of type I relation (activation or expression), the edge activation score (EAS) is defined as:
| (2) |
For type II relation (inhibition and repression), the edge inhibition score (EIS) is defined as:
| (3) |
Assuming A and B are two proteins, in our edge score model we always assume protein A sits on the left of the edge and protein B sits on the right of the edge. EAS stands for the probability of type I relation, when the expression ratio of both proteins A and B are higher expressed in tumor samples, the less the expression difference, the higher probability type I relation could occur. EIS stands for probability of type II relation, the first piece-wise function stands for the probability that protein A successfully inhibits protein B, while the second one stands for the probability that protein A fails to inhibit protein B. Under both cases, the higher the expression difference is, the higher occurrence probability will be. For all rest possible scenarios, the protein-protein interaction cannot be simply described only by gene expression, therefore, we set up a non-zero parameter ε uniformly as the probability estimation for edge score.
2.3.2. Pathway subroutine score model
For a specific pathway in the KEGG database, a complete subroutine is a sequence of protein family interactions starting from the receptor protein families on the cell membrane and ending at the terminal protein families in the nucleus or cytoplasm. The family subroutine sum score (FSSS) is the maximum of sum scores along all simple paths between any arbitrary header-terminal protein pair.
| (4) |
Where SA and SI are the activation/expression and inhibition/repression edge sets, separately with respect to a fixed family subroutine.
The final family subroutine score (FSS) which represents the probability of the subroutine activation (positive contribution in the context of a specific tumor) is defined as the average of the sum score.
| (5) |
All complete protein-protein interaction subroutines with occurrence probability greater than 50% are merged to form the final disease network.
2.3.3. Loop sub-structure extraction
The loop sub-structure extraction is fulfilled by shortest path theory. In detail, considering a protein A from the disease network, and protein X stands for one arbitrary protein from the complementary protein sets with respect to protein A. If there is no directed shortest path from A to X and at the same time, no directly shortest path from X to A, then there is no loop from A back to itself via X. If this applies to all complementary proteins with respect to protein A, then, there is no loop from A back to itself with respect to the derived disease network. The loop sub-structure extraction is achieved by R package “igraph”.
2.4. Drug prediction model
Any given drug (either a single or dual inhibitor) is ranked based on its impact to the loop substructure of the disease network, assuming that TARa is the target set of drugs A which, at the same time, belong to the extracted disease network as well. First, we define the impact of a single protein X to the loop sub-structure.
| (6) |
with
| (7) |
Here, SP(X, Y) denotes all shortest paths based on extracted disease network starting from protein X and terminating at protein Y. Again, R package “igraph” facilitates the shortest path extraction between any two given nodes. Equation (7) means for all shortest paths from X to Y, the protein X’s impact to protein Y is defined as the highest summation score among all feasible shortest paths. Finally, the drug A’s impact to the loop sub-structure is defined as:
| (8) |
Lastly, all computed drug scores are normalized according to the maximum computed drug scores.
2.5. Cell culture, reagents and gene transduction
Calu-1, HCC15, H23, H157, H358, H520, H1299, and H2087 cell lines were generously shared by John Minna and Luc Girard (University of Texas, Southwestern). A549 and H522 were purchased from ATCC (Rockville, MD). Cell lines were authenticated by DNA fingerprinting and tested for mycoplasma. Cells were cultured in Roswell Park Memorial Institute 1640 (RPMI1640) medium (GIBCO, Carlsbad, CA) containing 10% fetal bovine serum (FBS), penicillin (100 U/mL), and streptomycin (50 g/mL), in a humidified CO2 incubator at 37°C. All cells were passaged for less than 3 months before renewal from frozen, early-passage stocks.
Rapamycin (TORC1 inhibitor), BKM-120 (PI3K inhibitor) and GSK2126458 (TORC1, TORC2, and PI3K inhibitor) were obtained from Selleckchem (Houston, TX).
A CRISPR-Cas9 vector, targeting two specific regions of LKB1 exon 1 and exon 2, were designed using the px458 vector (Addgene, Cambridge, MA). Guide RNAs were designed using crispr.mit.edu; guides were designed for LKB1 exon 1 sequences CGCCGCAAGCGGGCCAAGCT and GTTGCGAAGGATCCCCAACG, which when co-transfected would create a 151-bp deletion with a frameshift. Guide RNAs for the respective CRISPR were under the regulation of a U6 promoter, whereas a cytomegalovirus promoter drove co-expression of the Cas9 enzyme and green fluorescent protein (GFP). H358 and H1299 cells were grown to 70%-90% confluence and transfected with the CRISPR plasmid using Lipofectamine 3000. Cells were sorted based on high expression of GFP and then seeded as single cells into 96-well dishes. After clonal expansion of the cells, genomic DNA was extracted, and the target regions were amplified by PCR using primer pairs for the expected deletion sites (GTTCATCCACCGCATCGACT and CCTGCGTTACGGACTTTCAC). Clones with double knockout of LKB1 produced a PCR product that was 151-bp shorter. Confirmation of knockout was made by sequencing PCR products and western blotting for LKB1 protein expression.
2.6. Proliferation and drug sensitivity assays
Cells were seeded at 4 × 10³ per well in 96-well plates, and incubated in antibiotic-containing RPMI 1640 with 10% FBS. After 24 h of incubation, various concentrations of rapamycin, BKM-120, rapamycin plus BKM-120, and GSK2126458 were added to each well, and incubation was continued for a further 48 hours. These cells were then used for proliferation assay, which was measured using the MTT (3-(4,5-dimethylthiazol-2-yl)-2,5-diphenyl tetrazolium) dye reduction method. An aliquot of MTT solution (2 mg/ml; Sigma, St Louis, MO, USA) was added to each well followed by incubation for 2 h at 37 °C. The media were removed and the dark blue crystals in each well were dissolved in 100 μ! of dimethyl sulfoxide (DMSO). Absorbance was measured with SynergyTM HT Multi-Mode Microplate Reader (Bio Tek Instruments, Winooski, VT, USA) at wavelengths of 570 nm. The percentage of growth is shown relative to untreated controls. Each sample was assayed in quadruplicate, with each experiment repeated at least three times independently.
2.7. Drug Combination Studies
Characterization of synergistic interactions was quantified by the isobologram and combination-index methods by Chou and Talalay equation using the CompuSyn software (ComboSyn, Inc., Paramus, NJ) [13]. The combination-index (CI) is a quantitative representation of between two-drug pharmacologic interactions. A CI of 1 indicates additivity between two agents, whereas a CI < 1 or CI > 1 indicates synergism or antagonism, respectively.
2.8. Immunoblots
Equal amounts of protein were mixed with SDS sample buffer and separated on SDS-PAGE before Western blot analysis. Lysates were homogenized and run on pre-cast SDS-PAGE gels (BioRad, Hercules, CA). The primary antibodies used were: LKB1 (27D10), AMPKα (23A3), phospho-AMPKα (Thr172) (40H9), p70 S6 Kinase (49D7), phospho-p70 S6 Kinase (Thr389), 4E-BP1 (53H11), Phospho-4E-BP1 (Thr37/46) (236B4), Akt (C67E7), phospho-Akt (Ser473) (D9E), Akt2 (D6G4), phospho-Akt2 (Ser474) (D3H2), CDK2 (78B2), Cyclin D1, phospho-Rb (Ser807/811) (D20B12), p27 Kip1 (D69C12), b-actin (all from Cell Signaling Technology, Danvers, MA), Cyclin A (H-432), and GAPDH (FL-335) (all from Santa Cruz Biotechnology, Dallas, TX). Quantification of the Western blot data were performed by measuring the intensity of the hybridization signals using ImageJ analysis program (National Institute of Health, Bethesda, MD).
2.9. Enzyme-linked immunosorbent assay (ELISA)
Cells were cultured in 10 mL RPMI1640 medium with 10% FBS with or without rapamycin 0.01μM for 2 hours. Tumor cells were lysed in cell lysis buffer supplemented with cOmplete mini-EDTA free protease inhibitor cocktail (Roche) and PhosSTOP (Roche), and their protein concentrations were determined using a BCA protein assay kit (Pierce; Thermo Fisher Scientific). The concentrations of total and phospho Akt1 in cell lysates were determined using enzyme-linked immunosorbent assay (ELISA) kits according to the manufacturer’s instructions (Cell Signaling Technology). All samples were run in duplicate.
2.10. Cell Cycle Analysis
Cells treated by GSK2126458 0.01μM for six or 24 hours, or without treatment were collected by centrifugation and resuspended at 1×10⁶ cells/mL in propidium iodide (PI) staining buffer (BD Bioscience, San Jose, CA). Cells were incubated at room temperature for 15 minutes. Cell-cycle histograms were generated after analysis of PI-stained cells by FACS with a BD FACSCalibur (BD Bioscience). For each culture, at least 1×10⁴ events were recorded. Histograms generated by FACS were analyzed by FACSDiv software (BD Bioscience).
2.11. Xenograft experiments
Suspensions of H358/control, H358/LKB1 knock out, H522, H157, and H522 cells (5×10⁶ cells) were injected into the flanks of 6-week-old non-obese diabetic severe combined immunodeficient (NOD-SCID) mice (the Jackson laboratories, Bar Harbor, ME). When tumor volumes reached approximately 200 mm3, the mice were randomized to receive GSK2126458, 0.5 mg/kg (days 1-5, 8-12, 15-19, 22-26), or vehicle orally. The dose and schedule of GSK2126458 used in vivo experiment were based on the previous studies [14, 15].Tumor volume was calculated as 1/2 × length (mm) × width (mm)2. Tumor size and mouse body weight were measured twice per week. Mice were sacrificed on day 28 of treatment. Mice were also sacrificed when tumors became ≥1.6 cm in diameter or moribund. The protocol was approved by Institutional Animal Care and Use Committee at The Ohio State University, Ohio (approval no. 2014A00000116), and carried out in accordance with institutional recommendations.
3. Results:
3.1. LKB1 loss is associated with activation of mTOR and PI3K pathway.
We applied a new in silico signaling analysis method to LKB1 mutant and wild-type cell lines from the CCLE as described in the Methods and found that the loop sub-structure in the disease network includes 152 proteins with multiple protein-protein interactions (Figure 1A), and cross talk between multiple signaling pathways (Figure 1A; Supplementary Table 1). Using the extracted loop structure, reasonable local paths (Figure 1B, red edges) exist for activation of PI3K when inhibiting mTOR alone. The presence of activation pathways for PI3K-Akt that function in the presence of mTOR inhibitors for the other pathway motivated us to evaluate the performance of combined inhibition of mTOR and PI3K.
Figure 1. Combined inhibition of mTOR and PI3K as a promising target for LKB1-deficient tumors in numerical experiments.
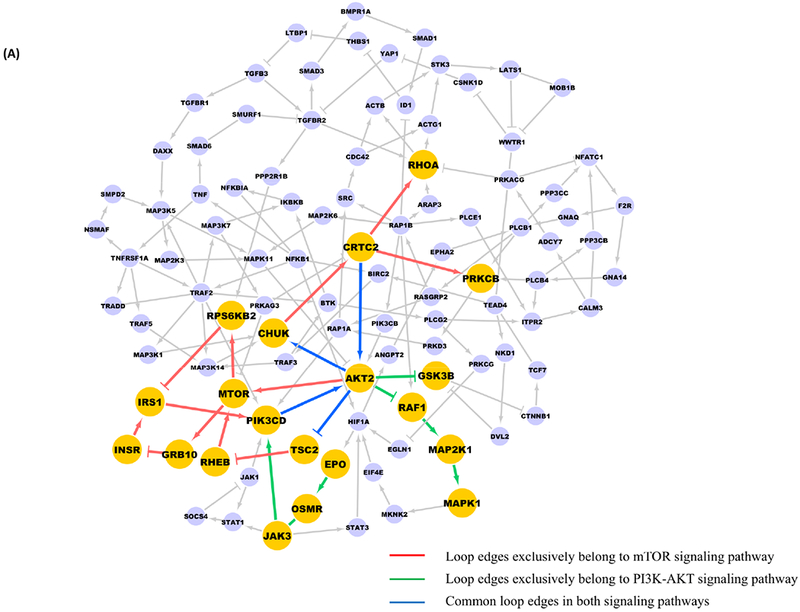
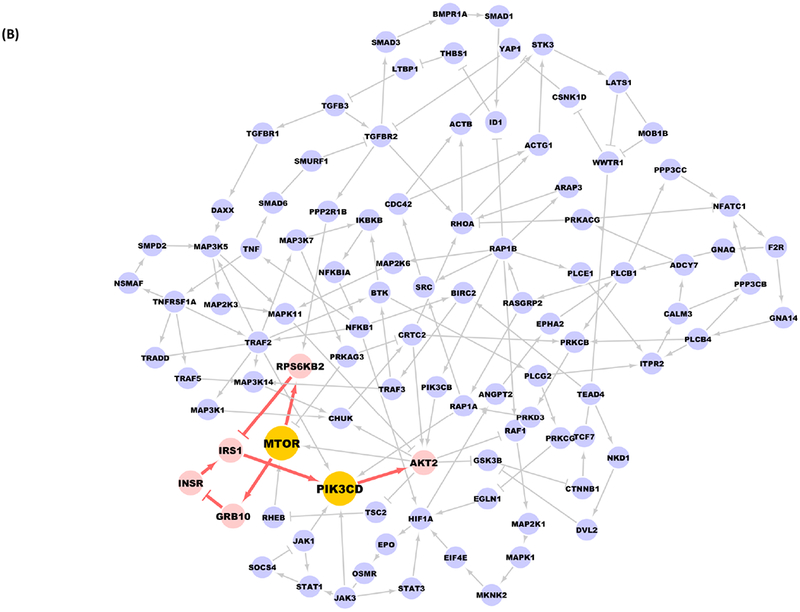
A, Yellow nodes are proteins from PI3K-Akt-mTOR signaling pathways, the red and green edges are the ones exclusively exist in mTOR and PI3K-Akt signaling pathways, respectively, blue edges are common edges with respect to both pathways. B, When adding mTOR inhibitors alone, there exists local paths (in red) in the loop structure which could finally activate PI3K and Akt.
3.2. In silico analysis identifies combined inhibition of mTOR and PI3K as a promising approach for LKB1-deficient tumors.
In the in silico analysis, we consider 235 Genomics of Drug Sensitivity in Cancer (GDSC) studied compounds with determined target information for NSCLC. The compounds and normalized predicted drug scores are attached in Supplementary Table 2. These predicted drug scores in Supplementary Table 2 are normalized scores of the maximum predicted score in Supplementary Table 3, which is a more detailed view of the drug’s impact to all loop proteins. Each computed drug score actually reflects its integrative impact to the extracted loop by summing up its individual impact to all loop nodes. For example, the loop substructure in Figure 1B involves mTOR and PI3K genes, and the normalized score of 1.0 for QL-X-138 indicates that this drug would be worth examining in LKB1-loss NSCLC. Two drugs, NVP-BEZ235, normalized score of 0.901, and GSK2126458, normalized score of 0.708, at the top of the list in Supplementary Table 2 are mTOR and PI3K inhibitors. The corresponding impact median and range to each loop node is attached in Supplementary Table 3 as well. According to our in silico results, all PI3K+mTORC1/2 dual inhibitors present more convincing capability to control the loop sub-structure when compared with either PI3K or mTOR inhibitors alone (Table 1).
Table 1:
Different types inhibitors’ impact to the loop sub-structure in the extracted disease network.
| RANK | DRUG | TARGET | COMPUTED_SCORE |
|---|---|---|---|
| 2 | NVP-BEZ235 | PI3K (Class 1) and mTORC1/2 | 0.901 |
| 3 | GSK2126458 | PI3K and mTORC1/2 | 0.708 |
| 7 | OSI-027 | mTORC1/2 | 0.456 |
| 36 | JW-7-52-1 | mTOR | 0.263 |
| 6 | AZD8055 | mTORC1/2 | 0.456 |
| 39 | Temsirolimus | mTOR | 0.263 |
| 38 | Rapamycin | mTOR | 0.263 |
| 66 | AZD6482 | PI3Kbeta | 0.220 |
| 10 | ZSTK474 | PI3K | 0.445 |
| 64 | CAL-101 | PI3Kdelta | 0.225 |
| 9 | GDC0941 (rescreen) | PI3K | 0.445 |
| 86 | AS605240 | PI3Kgamma | 0.000 |
| 67 | TGX221 | PI3Kbeta | 0.220 |
| 8 | GDC0941 | PI3K (class 1) | 0.445 |
| 65 | PIK-93 | PI4K, PI3K | 0.225 |
3.3. Synergistic effect between mTOR inhibition and PI3K inhibition in LKB1-deficient non-small cell lung cancer cells in vitro.
We measured sensitivity to rapamycin (TORC1 inhibitor), BKM-120 (PI3K α/β/γ/δ inhibitor), and their combination in 10 NSCLC cell lines, including 4 LKB1 mutants. Rapamycin alone or BKM-120 alone did not show significant differences in sensitivity between LKB1 wild type and mutant NSCLC cell lines (Figure 2A; rapamycin p = 0.1356, BKM-120 p = 0.8312 by Wilcoxon rank sum test). When BKM-120 was combined with rapamycin, the differences in sensitivity between LKB1 wild type and mutant cell lines became significant with mutant cell lines growing much slower than wild type (Figure 2A; p = 0.0190 by Wilcoxon rank sum test). Similarly, GSK2126458, the dual PI3K and mTORC1/2 inhibitor, showed significant difference in sensitivity between LKB1 wild type and mutant cell lines (Figure 2B; p = 0.0105 by Wilcoxon rank sum test).
Figure 2. Synergistic effect between mTOR inhibition and PI3K inhibition in LKB1-deficient non-small cell lung cancer cells in vitro.
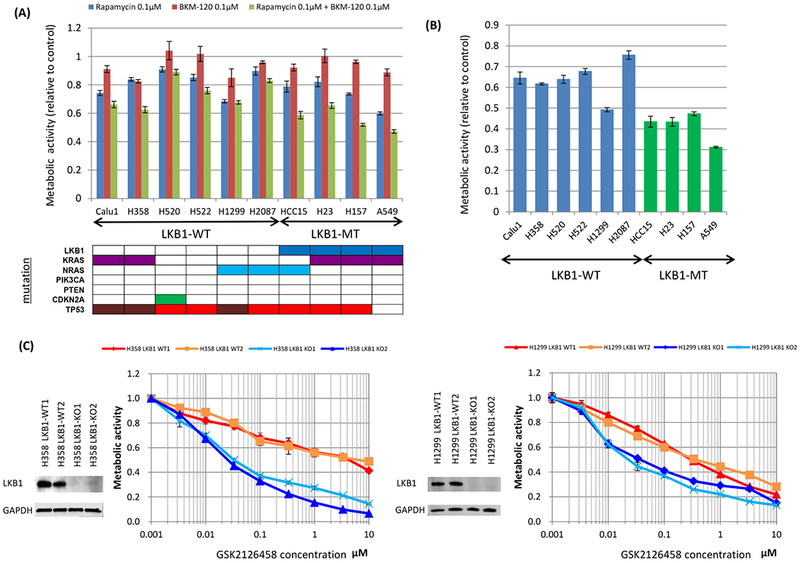
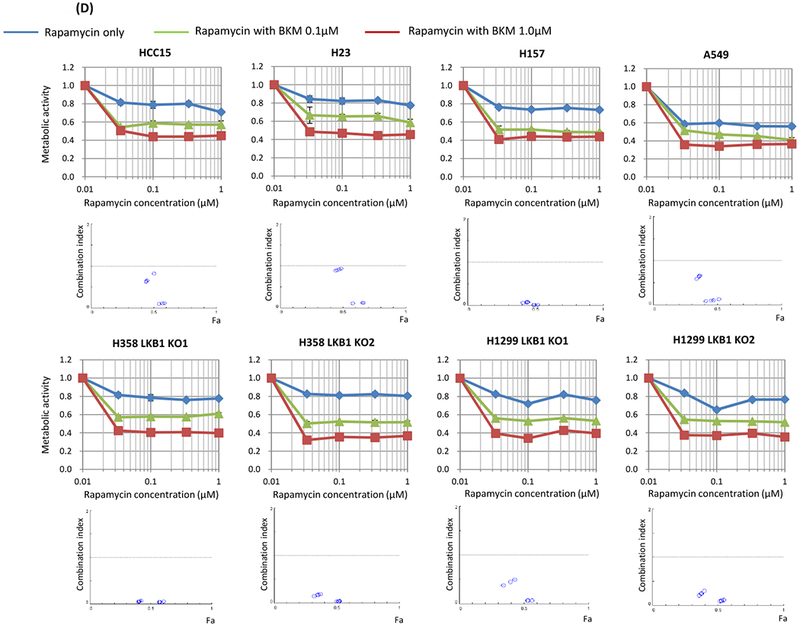
The MTT assay was used to assess sensitivity to the drugs for metabolic activity. Cells were seeded at 4 × 10³ per well of a 96-well plate and incubated for 48 hours with the drugs. Data are representative of three independent experiments. A, Non-small cell lung cancer cell lines without LKB1 mutation (Calu1, H358, H520, H522, H1299, and H2087) and with LKB1 mutation (HCC15, H23, H157, and A549) were incubated with rapamycin alone (100 nmol/L), BKM-120 alone (100 nmol/L), or in combination. When compared LKB1 mutant cells and LKB1 wild type cells, p values were 0.1356, 0.8312, and 0.0190 in rapamycin alone, BKM-120 alone, and their combination, respectively. B, Non-small cell lung cancer cell lines without LKB1 mutation (Calu1, H358, H520, H522, H1299, and H2087) and with LKB1 mutation (HCC15, H23, H157, and A549) were incubated with GSK2126458 alone (100 nmol/L). When compared LKB1 mutant cells and LKB1 wild type cells, p value was 0.0105. C, LKB1 knock out clones and wild-type clones of H358 and H1299 cells were incubated with GSK2126458 alone. LKB1 knock out clones were more sensitive than wild type clones. D, LKB1 mutated lung cancer cells (HCC15, H23, H157, and A549) and LKB1 knock out clones of H358 and H1299 were treated with various doses of rapamycin and BKM-120. Combination index values were analyzed according to the Chou and Talalay equation using the CompuSyn software. Abbreviations; WT; wild type, MT; mutant, KO; knock out.
CRISPR/Cas9 was used to knock out LKB1 expression in the LKB1 wild-type cell lines, H358 and H1299 (Figure 2C). Two LKB1 wild type clones and two LKB1 knock out clones were established for H358 and H1299. Resulting cells were then treated with GSK2126458 with knock out clones showing greater sensitivity to the drug than the control wild type clones (Figure 2C).
To assess the synergistic effect of mTOR inhibition and PI3K inhibition, we determined the CI using the method of Chou and Talalay. Our data showed that the treatment with rapamycin and BKM-120 resulted in CI values of less than 1.0 indicating synergy for 4 LKB1 mutant cell lines and 4 LKB1 knock out clones (Figure 2D).
3.4. LKB1 deficient cells show lower levels of AMPK phosphorylation and higher levels of mTOR pathway phosphorylation than LKB1 wild type cells
LKB1 and PI3K/mTOR related proteins were investigated by western blot in 6 LKB1 wild type and 4 LKB1 mutant cell lines (Figure 3A). The ratios of phosphorylated AMPKα to total AMPKa were significantly lower in LKB1 mutant cell lines than LKB1 wild type cell lines (Blots were quantified by ImageJ; p = 0.0105 by Wilcoxon rank sum test), though interestingly even homozygous knockout lines retained some level of phosphorylation. Examining pathways downstream of LKB1 and mTOR, the ratios of phosphorylated p70S6 to total p70S6 were significantly higher in LKB1 mutant cell lines than LKB1 wild type cell lines (p = 0.0330 for phosphor-p70S6/p70S6 by Wilcoxon rank sum test). Interestingly, expression of Akt2 normalized by βactin was higher in LKB1 mutant cell lines than in LKB1 wild type cell lines (p = 0.0330, Wilcoxon rank sum test).
Figure 3: LKB1 mutant cells show lower AMPK phosphorylation and higher mTOR pathway phosphorylation than LKB1 wild type cells. Inhibition of mTOR increases Akt phosphorylation more in LKB1 deficient cells than in LKB1 wild type cells, and addition of PI3K inhibition suppress Akt phosphorylation.
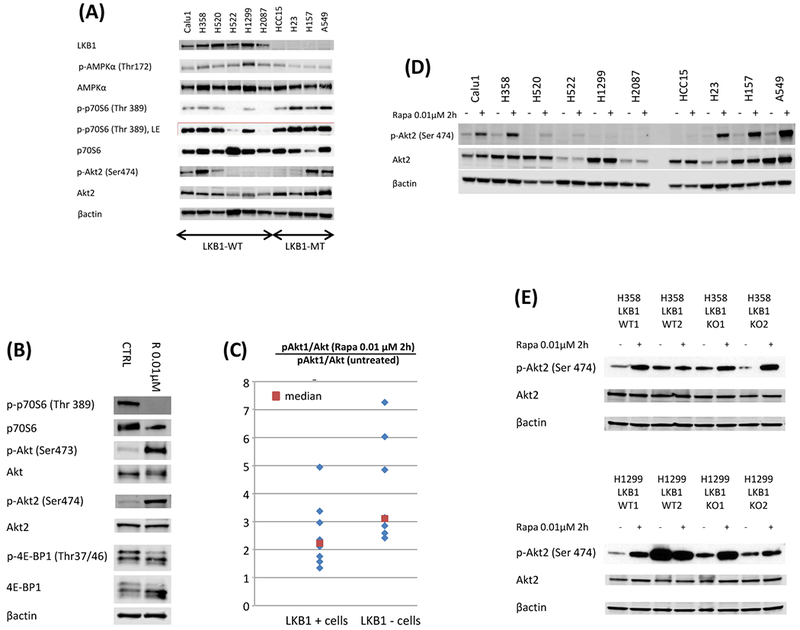
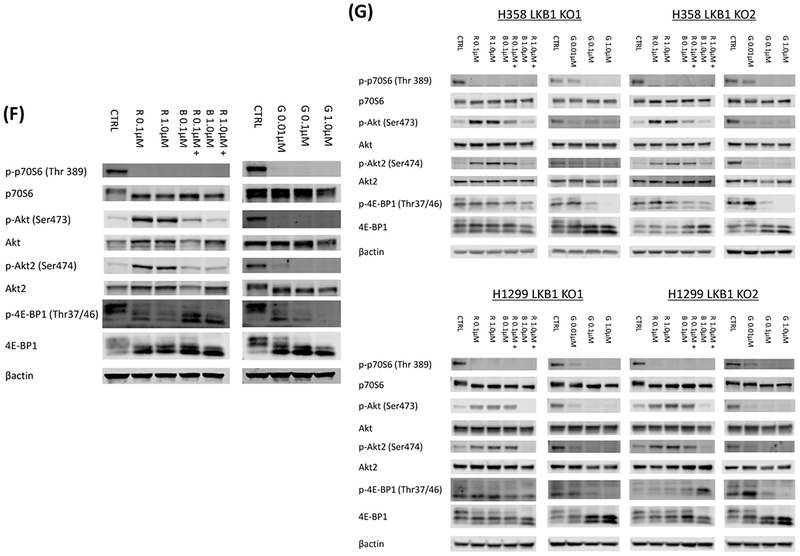
A, 6 LKB1 wild type cells (Calu1, H358, H520, H522, H1299, and H2087) and 4 LKB1 mutant cells (HCC15, H23, H157, and A549) were lysed and the indicated proteins were detected by immunoblotting. B, LKB1 mutant A549 cells were treated with rapamycin (0.01 μmol/L) for 2 hours. The cells were lysed and the indicated proteins were detected by immunoblotting. C, LKB1 deficient cells (HCC15, H23, H157, A549, two LKB1 knock out clones of H358, and two LKB1 knock out clones of H1299) and wild type cells (Calu1, H358, H520, H522, H1299, H2087, two LKB1 wild type clones of H358, and two LKB1 wild type clones of H1299) were incubated with rapamycin (0.01 μmol/L) for 2 hours. The cells were lysed and phospho Akt1 and total Akt were quantified with total Akt and phospho Akt1 sandwitch ELISA kit. Ratio of phospho Akt1 to total Akt after rapamycin treatment was divided by the ratio of phospho Akt1 to total Akt without treatment to evaluate rapamycin induced upregulation of Akt phosphorylation. When compared LKB1 deficient cells and wild type cells, p value was 0.0209. D, LKB1 wild type cell (Calu1, H358, H520, H522, H1299, H2087), and LKB1 deficient cells (HCC15, H23, H157, A549) were incubated with rapamycin (0.01 μmol/L) for 2 hours. The cells were lysed and the indicated proteins were detected by immunoblotting. E, Two LKB1 wild type clones of H358, two LKB1 knock out clones of H358, two LKB1 wild type clones of H1299, and two LKB1 knock out clones of H1299 were incubated with rapamycin (0.01 μmol/L) for 2 hours. The cells were lysed and the indicated proteins were detected by immunoblotting. D&E, Quantification of the Western blot data were performed by measuring the intensity of the hybridization signals using ImageJ analysis program (National Institute of Health). Ratio of phospho Akt2 to total Akt2 after rapamycin treatment was divided by the ratio of phospho Akt2 to total Akt2 without treatment to evaluate rapamycin induced upregulation of Akt2 phosphorylation. When compared LKB1 deficient cells and wild type cells by Wilcoxon rank sum test, p value was 0.0410. F, LKB1 mutant A549 cells were treated with various doses of rapamycin and BKM-120, or GSK2126458 for 2 hours. The cells were lysed and the indicated proteins were detected by immunoblotting. G, LKB1 knock out clones of H358 and H1299 cells were treated with various doses of rapamycin and BKM-120, or GSK2126458 for 2 hours. The cells were lysed and the indicated proteins were detected by immunoblotting. Abbreviations; LE; longer exposure, CTRL; control, R; Rapamycin, B; BKM-120, G; GSK2126458.
3.5. LKB1 deficient cells show higher levels of AKT phosphorylation than LKB1 wild type cells with mTOR inhibition
To investigate the synergistic mechanism of mTOR inhibition and PI3K inhibition in LKB1 deficient cells, we investigated downstream targets of mTOR and PI3K by western blot. While phosphorylation of p70S6 and 4E-BP1 were significantly inhibited after rapamycin exposure, phosphorylation of Akt1 and Akt2 was upregulated in A549 cells (Figure 3B). Next, we compared ratio of phosphorylated Akt1 and total Akt between LKB1 deficient and wild type cells after rapamycin exposure. The upregulation of phosphorylated Akt1 was significantly higher in LKB1 deficient cells than LKB1 wild type cells when concentrations of phosphorylated Akt1 and total Akt were measured with ELISA (Figure 3C; p = 0.0209 by Wilcoxon rank sum test). This trend was also confirmed by western blot (Supplementary Figure 1; p = 0.0100 by Wilcoxon rank sum test). The upregulation of phosphorylated Akt2 after rapamycin exposure was also significantly higher in LKB1 deficient cells than LKB1 wild type cells (Figure 3D and E; p = 0.0410 by Wilcoxon rank sum test). Addition of BKM-120 to rapamycin or use of the dual inhibitor GSK2126458 suppressed phosphorylation of Akt and Akt2 with continued suppression of p70S6 and 4E-BP1 phosphorylation in A549 cells and LKB1 knock out clones of H358 and H1299 (Figure 3F and3G).
3.6. Loss of LKB1 affects cell cycle proteins and increase susceptibility to mTOR and PI3K dual inhibition
Reduce cell numbers can be due to increased apoptosis or slowing of the cell cycle. After examining cleaved PARP by western blot (data not shown) we saw no indications of apoptosis at the concentrations where cell growth was inhibited, therefore, we looked at cell cycle proteins. The effects of LKB1 loss on cell cycle proteins were tested in LKB1 wild type and knock out clones of H358 and H1299 cells. Cells were harvested after treatment with GSK2126458, 0.1 μM, or vehicle for 48 hours. In LKB1 knock out clones of both H358 and H1299 cells, expression of cyclin A, phosphorylated-Rb, and CDK2 were significantly decreased after GSK2126458 treatment. In addition, expression of cyclin D1 could not be detected, and p27 was upregulated after GSK2126458 treatment of H358 LKB1 knock out clones (Figure 4A). When intensity of immunoblots were quantified and compared between LKB1 wild type and knock out clones by Wilcoxon rank sum test, expression of cyclin A, phosphorylated-Rb, and cyclin D1 were significantly lower in LKB1 knock out clones when compared to LKB1 wild type clones (p = 0.0209, 0.0209, 0.0433 by Wilcoxon rank sum test, respectively) after GSK2126458 exposure.
Figure 4: Loss of LKB1 affects cell cycle regulating proteins and increase susceptibility to mTOR and PI3K dual inhibition.
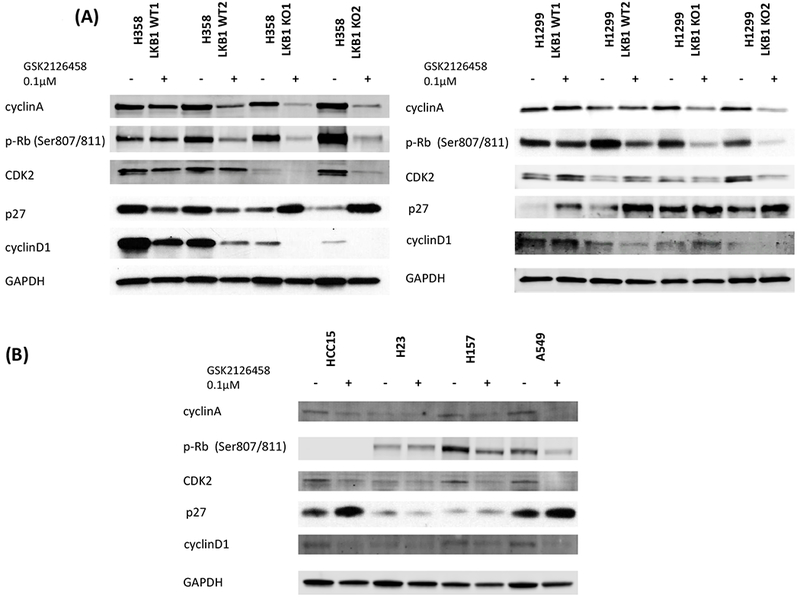
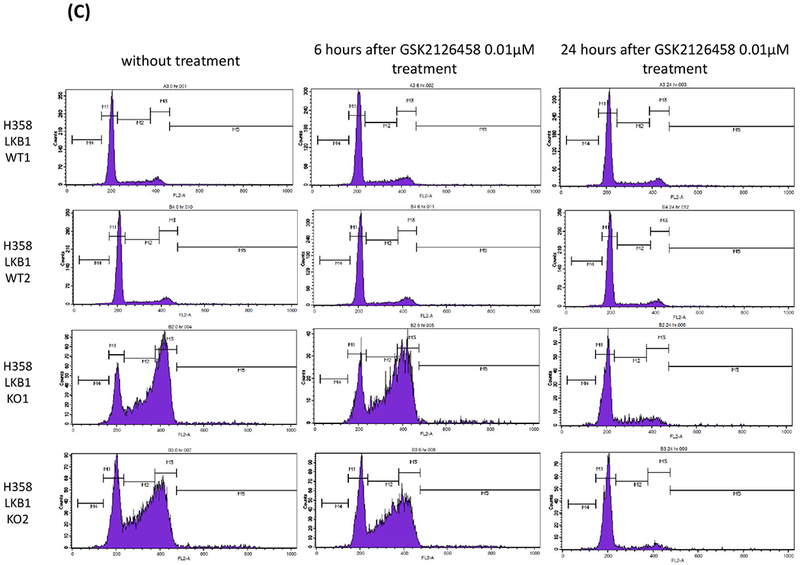
A, LKB1 knock out clones and wild type clones of H358 and H1299 cells were treated with GSK2126458 (0.1 μmol/L) for 48 hours. The cells were lysed, and the indicated proteins were detected by immunoblotting. Quantification of the Western blot data were performed by measuring the intensity of the hybridization signals using ImageJ analysis program (National Institute of Health). The indicated protein expression levels after GSK2126458 exposure for 48 hours were compared between LKB1 wild type and knock out clones. Expression levels were normalized by GAPDH, and Wilcoxon rank sum tests were performed (LKB1 WT vs KO; cyclin A p = 0.0209, phosphorylated-Rb p = 0.0209, CDK2 p = 0.1489, p27 p = 0.2482, cyclin D1 p = 0.0433, respectively). B, HCC15, H23, H157, and A549 were treated with GSK2126458 (0.1 μmol/L) for 48 hours. The cells were lysed, and the indicated proteins were detected by immunoblotting. C, LKB1 knock out clones and wild type clones of H358 cells were treated with GSK2126458 (0.01 μmol/L) for 6 hours and 24 hours. Cell-cycle histograms were generated after analysis of propidium iodide stained cells by FACS. Abbreviations; WT; wild type, KO; knock out.
Cell cycle regulating proteins were also investigated in LKB1-loss cell lines (Figure 4B). Cells were harvested after treatment with GSK2126458, 0.1 μM, or vehicle for 48 hours. The expression of Cyclin A, CDK2, Cyclin D1 were decreased after exposure to GSK2126458 in HCC15, H157, and A549 cells. The expression of phospho-RB was decreased after exposure to GSK2126458 in H157 and A549 cells. The expression of p27 was upregulated after exposure to GSK2126458 in HCC15 and A549 cells. These findings are similar to LKB1 knock out clones of H358 and H1299.
Cell cycle analysis was done in LKB1 knock out and wild type clones before GSK 2126458 treatment and 6 hours and 24 hours after treatment (Figure 4C). Before GSK2126458 treatment, the proportion of cells in G2/M phase was dramatically higher in LKB1 knock out clones. GSK2126458 reduced this G2/M accumulation especially in LKB1 knock out clones 24 hours after drug treatment.
3.7. Loss of LKB1 confers sensitivity to dual inhibition of mTOR and PI3K by GSK2126458 in vivo.
An LKB1 knock out clone and a wild type clone generated from H358 cells were injected subcutaneously to form xenograft tumors in the flanks of NOD-SCID mice. With vehicle treatment, LKB1 knock out clone tumors tended to grow more rapidly than wild type clone tumors. GSK2126458 significantly inhibited the growth of LKB1 knock out xenografts (Figure 5A; KO veh vs. KO GSK day 0 p = 0.5251, day 3 p = 0.0018, day 7 p = 0.0502, day 10 p = 0.0036, day 14 p = 0.0050, day 17 p = 0.0528, day 21 p = 0.0389, day 24 p = 0.0117, day 28 p = 0.0163; WT GSK vs. KO GSK day 0 p = 1.0000, day 3 p = 0.1052, day 7 p = 0.2976, day 10 p = 0.0206, day 14 p = 0.0078, day 17 p = 0.0707, day 21 p = 0.0282, day 24 p = 0.0707, day 28 p = 0.0528; Wilcoxon rank sum test). The efficacy of GSK2126458 was also tested on NSCLC cell lines with naturally occurring loss of LKB1 and a cell line with wild type LKB1 to confirm the results of the CRISPR generated knock out clones. LKB1 mutant cell lines, H157 and A549, and the LKB1 wild type cell, H522, were injected subcutaneously to form xenograft tumors in the flanks of NOD-SCID mice. GSK2126458 significantly inhibited the growth of H157 and A549 xenografts (Figure 5B and5C; H157 veh vs. H157 GSK day 0 p = 0.4698, day 3 p = 0.0138, day 7p = 0.0012; A549 veh vs. A549 GSK day 0 p = 0.7928, day 3 p = 0.0009, day 7 p = 0.0043, day 10 p = 0.0006, day 14 p = 0.0009; Wilcoxon rank sum test). The H157 cells grew very rapidly and the majority of the vehicle treated mice (10 of 11) had to be euthanized because they met early removal criteria by day seven and the study was stopped. Although tumors in the treated mice grew slower, several of the mice (5 of 11) treated with GSK2126458 also had to be euthanized due to meeting early removal criteria at day seven. For the A549 cell line, at day 14, most of the vehicle treated mice (9 of 11) met early removal criteria while GSK2126458 treated mice (4 of 11) met early removal criteria at this time and the study was stopped. The effect of GSK2126458 was not significant in H522 xenografts and recapitulated the result seen in Figure 5A with the H358 LKB1 wild type clone treated with vehicle or GSK2126458 (Figure 5D; H522 veh vs. H522 GSK day 0 p = 0.1988, day 3 p = 0.1208, day 7 p = 0.8206, day 10 p = 0.6230, day 14 p = 0.9397, day 17 p = 0.4963, day 21 p = 0.5967, day 24 p = 0.4057, day 28 p = 0.5453; Wilcoxon rank sum test). During treatment, there were no observable physical exam changes or evidence of severe loss in body weight in mice treated with GSK2126458 compared to those with vehicle (Supplementary Figure 2A–2D).
Figure 5: Loss of LKB1 confers sensitivity to dual inhibition of mTOR and PI3K by GSK2126458 in vivo.
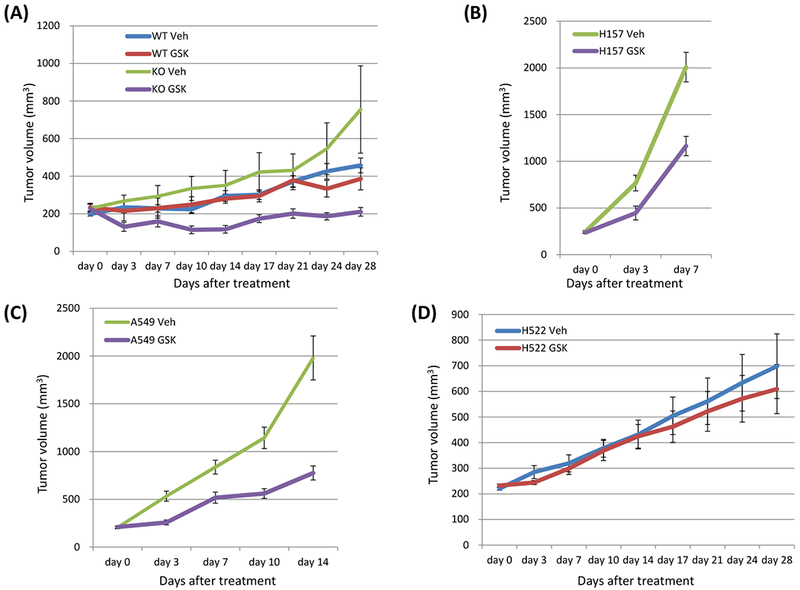
A, An LKB1 knock out clone and a wild type clone of H358 cells (5 × 10⁶ cells) were inoculated into the flank of NSG mice, and when tumor volumes reached approximately 200 mm3, the mice were treated with GSK2126458 0.5 mg/kg/mouse or vehicle, p.o.. days 1-5, 8-12, 15-19, and 22-26. Data shown are mean ± SE for 7 to 9 mice in each group (7 mice injected LKB1 knock out clones and 8 mice injected LKB1 wild type clones were treated with GSK2126458, and 9 mice injected LKB1 knock out clones and 9 mice injected LKB1 wild type clones were treated with vehicle). Xenograft tumors of mice were evaluated as described in Materials and Method. Tumor size was analyzed by Wilcoxon rank sum test (KO veh vs. KO GSK day 0 p = 0.5251, day 3 p = 0.0018, day 7 p = 0.0502, day 10 p = 0.0036, day 14 p = 0.0050, day 17 p = 0.0528, day 21 p = 0.0389, day 24 p = 0.0117, day 28 p = 0.0163; WT GSK vs. KO GSK day 0 p = 1.0000, day 3 p = 0.1052, day 7 p = 0.2976, day 10 p = 0.0206, day 14 p = 0.0078, day 17 p = 0.0707, day 21 p = 0.0282, day 24 p = 0.0707, day 28 p = 0528). B, C, D Two LKB1 mutant cells (H157 and A549) and one LKB1 wild type cells (H522) were inoculated into the flank of NSG mice, and when tumor volumes reached approximately 200 mm3, the mice were treated with GSK2126458 0.5 mg/kg/mouse or vehicle, p.o.. days 1-5, 8-12, 15-19, and 22-26. Data shown are mean ± SE for 10 to 11 mice in each group (11 mice injected H157 were treated with vehicle, 11 injected H157 were treated with GSK2126458, 11 injected A549 were treated with vehicle, 11 injected A549 were treated with GSK2126458, 10 injected H522 were treated with vehicle, and 10 injected H522 were treated with GSK2126458). Xenograft tumors of mice were evaluated as described in Materials and Method. Tumor size was analyzed by Wilcoxon rank sum test (H157 veh vs. H157 GSK day 0 p = 0.4698, day 3 p = 0.0138, day 7 p = 0.0012; A549 veh vs. A549 GSK day 0 p = 0.7928, day 3 p = 0.0009, day 7 p = 0.0043, day 10 p = 0.0006, day 14 p = 0.0009; H522 veh vs. H522 GSK day 0 p = 0.1988, day 3 p = 0.1208, day 7 p = 0.8206, day 10 p = 0.6230, day 14 p = 0.9397, day 17 p = 0.4963, day 21 p = 0.5967, day 24 p = 0.4057, day 28 p = 0.5453). The H157 cells grew very rapidly and the majority of the vehicle treated mice (10 of 11) had to be euthanized because they met early removal criteria by day seven and the study was stopped. Although tumors in the treated mice grew slower, several of the mice (5 of 11) treated with GSK2126458 also had to be euthanized due to meeting early removal criteria at day seven. For the A549 cell line, at day 14, most of the vehicle treated mice (9 of 11) met early removal criteria while GSK2126458 treated mice (4 of 11) met early removal criteria at this time and the study was stopped. Abbreviations; WT; wild type, KO; knock out, Veh; vehicle, GSK; GSK2126458.
4. Discussion:
Identifying therapeutic strategies for subsets of tumors with tumor suppressor loss is a challenging yet pressing need in clinical oncology. This is especially true for LKB1, where loss of function is seen in approximately 30% of lung adenocarcinomas, which are almost exclusively EGFR wild-type [2] and have been shown to be more resistant to anti-PD-1/PD-L1 therapy [4].
The PI3K-Akt-mTOR signaling pathway has been investigated as a therapeutic target for LKB1 mutant neoplasms, but those studies have yielded controversial results [7–10]. In this study, we used a new signaling analysis method to identify the potential therapeutic targets and reposition drugs by integrating gene expression data with the KEGG signaling pathway, and showed that inhibition of both mTOR and PI3K can be synergistically effective in LKB1 mutant NSCLC. We then demonstrated the synergistic effect of mTOR inhibition and PI3K inhibition in LKB1-deficient NSCLC cell lines in vitro and in vivo, and showed that dual inhibition of mTOR and PI3K can be a promising therapeutic strategy in LKB1-deficient tumors.
In a previous study from our group, LKB1 loss showed attenuation of PI3K-Akt possibly caused by feedback from mTOR activation [2]. However, our in silico analysis showed that the PI3K-Akt-mTOR signaling pathway was clearly identified as a promising target in LKB1-deficient cells. When we used rapamycin alone we found higher compensatory increase of Akt1 and Akt2 phosphorylation in LKB1-deficient cells when compared to LKB1 wild type cells, which is consistent with the previous finding of Akt1 in NK/T cell lymphoma cell lines [16]. PI3K is the primary upstream activator of Akt, and the higher compensatory increase of Akt phosphorylation appears to be related to mTOR inhibition as indicated by our in silico analysis. This feedback loop activating AKT through PI3K after mTOR inhibition is likely responsible for the synergistic effect of mTOR and PI3K inhibition in LKB1-deficient cells.
There are examples in the literature of LKB1 affecting the cell cycle without inducing apoptosis. Tiainen et al. introduced LKB1 back into the melanoma cell line, G361, and saw G1 cell cycle arrest without apoptosis [17]. Another example is the MDA-MB-435 breast cancer cell line that has very low basal expression of LKB1, where reintroduction of the LKB1 protein suppresses cell growth by up regulating p21 with subsequent G1 cell cycle block [18]. In contrast to lung cancer, both melanoma and breast cancer have very low frequencied of naturally occurring LKB1 loss. Drug treatments used in this study targeting mTOR and PI3K can also lead to alterations in the cell cycle and induce cell cycle arrest. Rapamycin induces G1 cell cycle arrest due to up-regulation of TGF-β signaling and down-regulation of Rb phosphorylation in MDA-MB-231 breast cancer cell lines [19], and GSK2126458 also induces G1 cell cycle arrest in a large panel of cell lines, including T47D and BT474 breast cancer lines [14]. In our study, knocking out LKB1 made wide variety of changes in cell cycle regulating proteins such as p27, cyclin D1, cyclin A, phosphorylated-Rb, and CDK2, and changes in these molecules after GSK2126458 treatment seem to be related to the observed difference of sensitivity to the drug between LKB1 wild type and knock out clones. Knocking out the LKB1 gene increased the proportion of G2/M phase in H358 cells, and GSK 2126458 induced a shift from G2/M to G1, indicating a cell cycle arrest at G1 in LKB1 knock out clones of H358 cells 24 hours after treatment. On the other hand, knocking out the LKB1 gene tended to increase the proportion of G2/M phase in H1299 cells, but not as significant as in H358 cells (data not shown). There were some discrepancies in the results of cell cycle regulating protein expressions like p27, and cyclin D1 between H358 and H1299 cell lines, and they might be correlated with the discrepancies in the results of cell cycle analyses.
In conclusion, this study suggests that the dual molecular targeted therapy for mTOR and PI3K may be a promising therapeutic strategy in specific populations of lung cancer patients whose tumors have LKB1 loss of function. Further investigation screening for LKB1 deficiency in an early phase clinical study is warranted to improve the outcome of this specific population, which accounts for 30-35% of NSCLC, and is in need of alternative therapy strategies, especially as it exhibits less efficacy to anti-PD-1/PD-L1 therapy.
Supplementary Material
Supplementary Figure 1: Western blot of downstream molecules of mTOR after rapamycin treatment in LKB1 deficient and wild type cells.
LKB1 deficient cells (HCC15, H23, H157, A549, two LKB1 knock out clones of H358, and two LKB1 knock out clones of H1299) and wild type cells (Calu1, H358, H520, H522, H1299, H2087, two LKB1 wild type clones of H358, and two LKB1 wild type clones of H1299) were incubated with rapamycin (0.01 μmol/L) for 2 hours. The cells were lysed and the indicated proteins were detected by immunoblotting. Quantification of the Western blot data were performed by measuring the intensity of the hybridization signals using ImageJ analysis program (National Institute of Health). Ratio of phospho Akt to total Akt after rapamycin treatment was divided by the ratio of phospho Akt to total Akt without treatment to evaluate rapamycin induced upregulation of Akt phosphorylation. When compared LKB1 deficient cells and wild type cells by Wilcoxon rank sum test, p value was 0.0100.
Supplementary Figure 2: Effect of GSK2126458 in the change of mouse weight.
A, An LKB1 knock out clone and a wild type clone of H358 cells (5 × 10⁶ cells) were inoculated into the flank of NSG mice, and when tumor volumes reached approximately 200 mm3, the mice were treated with GSK2126458 0.5 mg/kg/mouse or vehicle, p.o.. days 1-5, 8-12, 15-19, and 22-26. Data shown are mean ± SE for 7 to 9 mice in each group (7 mice injected LKB1 knock out clones and 8 mice injected LKB1 wild type clones were treated with GSK2126458, and 9 mice injected LKB1 knock out clones and 9 mice injected LKB1 wild type clones were treated with vehicle). Weights of mice were evaluated as described in Materials and Method. B, C, D Two LKB1 mutant cells (H157 and A549) and one LKB1 wild type cells (H522) were inoculated into the flank of NSG mice, and when tumor volumes reached approximately 200 mm3, the mice were treated with GSK2126458 0.5 mg/kg/mouse or vehicle, p.o.. days 1-5, 8-12, 15-19, and 22-26. Data shown are mean ± SE for 10 to 11 mice in each group (11 mice injected H157 were treated with vehicle, 11 injected H157 were treated with GSK2126458, 11 injected A549 were treated with vehicle, 11 injected A549 were treated with GSK2126458, 10 injected H522 were treated with vehicle, and 10 injected H522 were treated with GSK2126458). Weights of mice were evaluated as described in Materials and Method. Abbreviations; WT; wild type, KO; knock out, Veh; vehicle, GSK; GSK2126458.
Acknowledgements:
We appreciate the gift of the Calu-1, HCC15, H23, H157, H358, H520, H1299, and H2087 cells that were provided by John Minna and Luc Girard (University of Texas, Southwestern, Dallas, TX). This work was supported by a Lilly Oncology Fellowship from The Japanese Respiratory Society, an alumni scholarship from the Juntendo University School of Medicine, a research fellowship from Uehara Memorial Foundation, a Pelotonia postdoctoral fellowship (to TS).
Financial support:
This study was supported by the DallePezze Thoracic Oncology Fund, a grant from the National Cancer Institute (5U10CA180950; to DPC), and Shared Resource at The Ohio State University Comprehensive Cancer Center (P30CA016058).
Footnotes
Publisher's Disclaimer: This is a PDF file of an unedited manuscript that has been accepted for publication. As a service to our customers we are providing this early version of the manuscript. The manuscript will undergo copyediting, typesetting, and review of the resulting proof before it is published in its final citable form. Please note that during the production process errors may be discovered which could affect the content, and all legal disclaimers that apply to the journal pertain.
Conflict of interest statement:
TS reports personal fees from Eli Lilly and Company, Nichi-Iko Pharmaceutical Co., and Sanofi, outside the submitted work. DPC reports personal fees from Abbvie, Adaptimmune, Agenus, Amgen, Ariad, AstraZeneca, Biocept, Boehringer Ingelheim, Celgene, Clovis, EMD Serono, Foundation Medicine, Genentech/Roche, Gritstone, Guardant Health, Helsinn, Humana, Incyte, Inivata, Inovio, Janssen, Kyowa Kirin, Merck, Merck Sharp Dohme (MSD), Novartis, Palobiofarma, Pfizer, prIME Oncology, Stemcentrx, Takeda, Teva, and grants and personal fees from Bristol Myers-Squibb, outside the submitted work.
References
- 1.Ji H, Ramsey MR, Hayes DN, Fan C, McNamara K, Kozlowski P, et al. LKB1 modulates lung cancer differentiation and metastasis. Nature. 2007;448:807–10. 10.1038/nature06030. [DOI] [PubMed] [Google Scholar]
- 2.Kaufman JM, Amann JM, Park K, Arasada RR, Li H, Shyr Y, Carbone DP. LKB1 loss induces characteristic patterns of gene expression in human tumors associated with NRF2 activation and attenuation of PI3K-AKT. J Thoracic Oncol. 2014;9:794–804. 10.1097/JTO.0000000000000173. [DOI] [PMC free article] [PubMed] [Google Scholar]
- 3.Shukuya T, Carbone DP. Predictive Markers for the Efficacy of Anti-PD-1/PD-L1 Antibodies in Lung Cancer. J Thorac Oncol. 2016. July;11(7):976–88. 10.1016/j.jtho.2016.02.015. [DOI] [PMC free article] [PubMed] [Google Scholar]
- 4.Skoulidis F, Goldberg ME, Greenawalt DM, Hellmann MD, Awad MM, Gainor JF, et al. STK11/LKB1 Mutations and PD-1 Inhibitor Resistance in KRAS-Mutant Lung Adenocarcinoma. Cancer Discov. 2018. July;8(7):822–835. 10.1158/2159-8290.CD-18-0099. [DOI] [PMC free article] [PubMed] [Google Scholar]
- 5.Janku F, Yap TA, Meric-Bernstam F. Targeting the PI3K pathway in cancer: are we making headway? Nat Rev Clin Oncol. 2018. May;15(5):273–291. 10.1038/nrclinonc.2018.28. [DOI] [PubMed] [Google Scholar]
- 6.Momcilovic M, Shackelford DB. Targeting LKB1 in cancer - exposing and exploiting vulnerabilities. Br J Cancer. 2015. August 11;113(4):574–84. 10.1038/bjc.2015.261. [DOI] [PMC free article] [PubMed] [Google Scholar]
- 7.Contreras CM, Akbay EA, Gallardo TD, Haynie JM, Sharma S, Tagao O, et al. Lkb1 inactivation is sufficient to drive endometrial cancers that are aggressive yet highly responsive to mTOR inhibitor monotherapy. Dis Model Mech. 2010. Mar-Apr;3(3-4):181–93. 10.1242/dmm.004440. [DOI] [PMC free article] [PubMed] [Google Scholar]
- 8.Tanwar PS, Kaneko-Tarui T, Zhang L, Tanaka Y, Crum CP, Teixeira JM. Stromal liver kinase B1 [STK11] signaling loss induces oviductal adenomas and endometrial cancer by activating mammalian Target of Rapamycin Complex 1. PLoS Genet. 2012;8(8):e1002906 10.1371/journal.pgen.1002906. [DOI] [PMC free article] [PubMed] [Google Scholar]
- 9.Carretero J, Shimamura T, Rikova K, Jackson AL, Wilkerson MD, Borgman CL, et al. Integrative genomic and proteomic analyses identify targets for Lkb1-deficient metastatic lung tumors. Cancer Cell. 2010. June 15;17(6):547–59. 10.1016/j.ccr.2010.04.026. [DOI] [PMC free article] [PubMed] [Google Scholar]
- 10.Xiao P, Sun LL, Wang J, Han RL, Ma Q, Zhong DS. LKB1 gene inactivation does not sensitize non-small cell lung cancer cells to mTOR inhibitors in vitro. Acta Pharmacol Sin. 2015. September;36(9):1107–12. 10.1038/aps.2015.19. [DOI] [PMC free article] [PubMed] [Google Scholar]
- 11.Broad Institute. Cancer Cell Line Encyclopedia. https://portals.broadinstitute.org/ccle
- 12.Kanehisa Laboratories. KEGG Pathway Database. https://www.genome.jp/kegg/pathway.html
- 13.Chou TC. Drug combination studies and their synergy quantification using the Chou-Talalay method. Cancer Res. 2010. January 15;70(2):440–6. 10.1158/0008-5472.CAN-09-1947. [DOI] [PubMed] [Google Scholar]
- 14.Knight SD, Adams ND, Burgess JL, Chaudhari AM, Darcy MG, Donatelli CA, et al. Discovery of GSK2126458, a Highly Potent Inhibitor of PI3K and the Mammalian Target of Rapamycin. ACS Med Chem Lett. 2010. January 19;1(1):39–43. 10.1021/ml900028r. [DOI] [PMC free article] [PubMed] [Google Scholar]
- 15.Liu T, Sun Q, Li Q, Yang H, Zhang Y, Wang R, et al. Dual PI3K/mTOR inhibitors, GSK2126458 and PKI-587, suppress tumor progression and increase radiosensitivity in nasopharyngeal carcinoma. Mol Cancer Ther. 2015. February;14(2):429–39. 10.1158/1535-7163.MCT-14-0548. [DOI] [PubMed] [Google Scholar]
- 16.Kawada J, Ito Y, Iwata S, Suzuki M, Kawano Y, Kanazawa T, et al. mTOR inhibitors induce cell-cycle arrest and inhibit tumor growth in Epstein-Barr virus-associated T and natural killer cell lymphoma cells. Clin Cancer Res. 2014. November 1;20(21):5412–22. 10.1158/1078-0432.CCR-13-3172. [DOI] [PubMed] [Google Scholar]
- 17.Tiainen M, Ylikorkala A, Mäkelä TP. Growth suppression by Lkb1 is mediated by a G(1) cell cycle arrest. Proc Natl Acad Sci U S A. 1999. August 3;96(16):9248–51. 10.1073/pnas.96.16.9248. [DOI] [PMC free article] [PubMed] [Google Scholar]
- 18.Shen Z, Wen XF, Lan F, Shen ZZ, Shao ZM. The tumor suppressor gene LKB1 is associated with prognosis in human breast carcinoma. Clin Cancer Res. 2002. July;8(7):2085–90. [PubMed] [Google Scholar]
- 19.Chatterjee A, Mukhopadhyay S, Tung K, Patel D, Foster DA. Rapamycin-induced G1 cell cycle arrest employs both TGF-β and Rb pathways. Cancer Lett. 2015. May 1;360(2):134–40. 10.1016/j.canlet.2015.01.043. [DOI] [PMC free article] [PubMed] [Google Scholar]
Associated Data
This section collects any data citations, data availability statements, or supplementary materials included in this article.
Supplementary Materials
Supplementary Figure 1: Western blot of downstream molecules of mTOR after rapamycin treatment in LKB1 deficient and wild type cells.
LKB1 deficient cells (HCC15, H23, H157, A549, two LKB1 knock out clones of H358, and two LKB1 knock out clones of H1299) and wild type cells (Calu1, H358, H520, H522, H1299, H2087, two LKB1 wild type clones of H358, and two LKB1 wild type clones of H1299) were incubated with rapamycin (0.01 μmol/L) for 2 hours. The cells were lysed and the indicated proteins were detected by immunoblotting. Quantification of the Western blot data were performed by measuring the intensity of the hybridization signals using ImageJ analysis program (National Institute of Health). Ratio of phospho Akt to total Akt after rapamycin treatment was divided by the ratio of phospho Akt to total Akt without treatment to evaluate rapamycin induced upregulation of Akt phosphorylation. When compared LKB1 deficient cells and wild type cells by Wilcoxon rank sum test, p value was 0.0100.
Supplementary Figure 2: Effect of GSK2126458 in the change of mouse weight.
A, An LKB1 knock out clone and a wild type clone of H358 cells (5 × 10⁶ cells) were inoculated into the flank of NSG mice, and when tumor volumes reached approximately 200 mm3, the mice were treated with GSK2126458 0.5 mg/kg/mouse or vehicle, p.o.. days 1-5, 8-12, 15-19, and 22-26. Data shown are mean ± SE for 7 to 9 mice in each group (7 mice injected LKB1 knock out clones and 8 mice injected LKB1 wild type clones were treated with GSK2126458, and 9 mice injected LKB1 knock out clones and 9 mice injected LKB1 wild type clones were treated with vehicle). Weights of mice were evaluated as described in Materials and Method. B, C, D Two LKB1 mutant cells (H157 and A549) and one LKB1 wild type cells (H522) were inoculated into the flank of NSG mice, and when tumor volumes reached approximately 200 mm3, the mice were treated with GSK2126458 0.5 mg/kg/mouse or vehicle, p.o.. days 1-5, 8-12, 15-19, and 22-26. Data shown are mean ± SE for 10 to 11 mice in each group (11 mice injected H157 were treated with vehicle, 11 injected H157 were treated with GSK2126458, 11 injected A549 were treated with vehicle, 11 injected A549 were treated with GSK2126458, 10 injected H522 were treated with vehicle, and 10 injected H522 were treated with GSK2126458). Weights of mice were evaluated as described in Materials and Method. Abbreviations; WT; wild type, KO; knock out, Veh; vehicle, GSK; GSK2126458.


