Fig. 7.
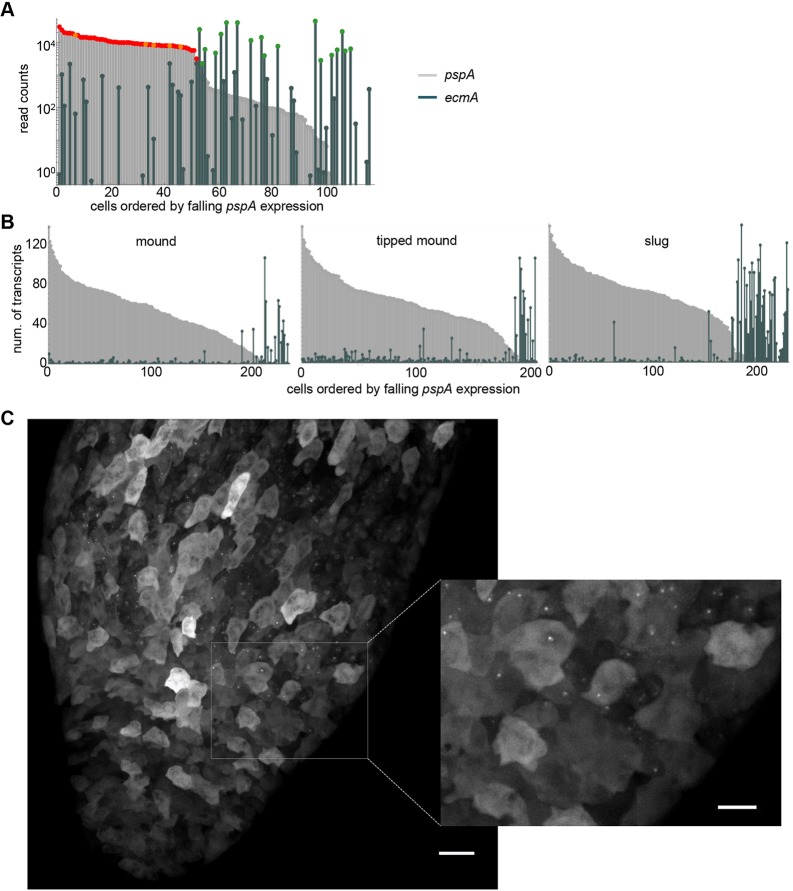
Quantifying spillover of fate-specific markers. (A) scRNA-seq detects co-expression of pspA and ecmA in mound cells. Cells are ordered by the level of pspA expression, with their pspA and ecmA expression levels shown in parallel (as light grey and dark green bars, respectively). For reference, pspA expression in prespore and early prespore cells is marked in red and orange, respectively, and ecmA expression in prestalk cells is marked in green. (B) Single cell transcript counts for pspA and ecmA in disaggregated cells from early mounds (232 cells), late (tipped) mounds (200 cells) and slugs (227 cells). Transcript counts were determined using smFISH. Data shown are from one representative of three independent experiments. The AX2 cell line was used to facilitate greater temporal homogeneity in development. (C) Live imaging of pspA transcription in intact slugs. 128 MS2 repeats were inserted into the pspA gene. Nascent transcripts were detected by expression of MCP-GFP. The inset shows a close-up of the boundary between prespore and prestalk regions, showing no detectable nascent transcripts in the prestalk region. Images are representative of 12 slugs, from two independent experiments on two independent pspA-MS2 cell lines. Scale bars: 20 µm; 10 µm in inset.

