Abstract
Context
The literature on gait kinematics and muscle activation in chronic ankle instability (CAI) is limited. A comprehensive evaluation of all relevant gait measures is needed to examine alterations in gait neuromechanics that may contribute to recurrent sprain.
Objective
To compare walking neuromechanics, including kinematics, muscle activity, and kinetics (ie, ground reaction force [GRF], moment, and power), between participants with and those without CAI by applying a novel statistical analysis to data from a large sample.
Design
Controlled laboratory study.
Setting
Biomechanics laboratory.
Patients or Other Participants
A total of 100 participants with CAI (49 men, 51 women; age = 22.2 ± 2.3 years, height = 174.0 ± 9.7 cm, mass = 70.8 ± 14.4 kg) and 100 individuals without CAI serving as controls (55 men, 45 women; age = 22.5 ± 3.3 years, height = 173.1 ± 13.3 cm, mass = 72.6 ± 18.7 kg).
Intervention(s)
Participants performed 5 trials of walking (shod) at a self-selected speed over 2 in-ground force plates.
Main Outcome Measure(s)
Three-dimensional GRFs, lower extremity joint angles, internal joint moments, joint powers, and activation amplitudes of 6 muscles were recorded during stance.
Results
Compared with the control group, the CAI group demonstrated (1) increased plantar flexion or decreased dorsiflexion, increased inversion or decreased eversion, decreased knee flexion, decreased knee abduction, and increased hip-flexion angles; (2) increased or decreased inversion, increased plantar flexion, decreased knee extension, decreased knee abduction, and increased hip-extension moments; (3) increased vertical, braking, and propulsive GRFs; (4) increased hip eccentric and concentric power; and (5) altered muscle activation in all 6 lower extremity muscles.
Conclusions
The CAI group demonstrated a hip-dominant strategy by limiting propulsive forces at the ankle while increasing force generation at the hip. The different walking neuromechanics exhibited by the CAI group could represent maladaptive strategies that developed after the initial sprain or an injurious gait pattern that may have predisposed the participants to their initial injuries. Increased joint loading and altered kinematics at the foot and ankle complex during initial stance could affect the long-term health of the ankle articular cartilage.
Keywords: walking gait, foot, sensorimotor integration
Key Points
During most of stance, the chronic ankle instability (CAI) group displayed altered foot neuromechanics that may increase their susceptibility to recurrent ankle sprains.
The CAI group had increased impact and impulsive loading, with the hip appearing to play a role in dissipating and generating forces.
Participants with CAI appeared to use a hip-dominant gait strategy for power production (ie, concentric energy) by reweighting joint power distally (ankle and knee) to proximally (hip).
The distal hip joint also appeared to present altered walking neuromechanics via an increased hip-flexion angle and hip-extension moment and decreased gluteus maximus and medius activation.
Increased joint loading (ie, impact ground reaction force and plantar-flexion moment) and altered kinematics at the foot and ankle complex during initial stance could affect the long-term health of the ankle articular cartilage.
After a single ankle sprain, most individuals sustain subsequent ankle sprains, which often develop into chronic ankle instability (CAI). This condition is characterized by chronic residual symptoms, including pain, swelling, loss of function, joint instability, recurrent episodes of the ankle giving way, and recurrent sprains.1 It is thought to result from sensorimotor (ie, alterations in strength, postural control, reflex function, arthrogenic muscle inhibition, proprioception, or movement patterns) or mechanical (ie, arthrokinematic and osteokinematic restrictions, pathologic ligament laxity, articular cartilage changes, or synovial changes) deficits.1
Some researchers2–8 have described altered walking kinematics in patients with CAI. These patients have consistently demonstrated increased rearfoot, forefoot, or foot (single-segment) inversion angle2,5–8 and increased plantar-flexion or reduced dorsiflexion angle during stance.2–4 These gait pathomechanics are believed to increase the risk of recurrent lateral ankle sprains by placing the foot in a more vulnerable position when it is combined with the kinetic gait profiles of patients with CAI who have a laterally deviated center of pressure (COP) of the foot throughout the gait cycle.9–11
Whereas the kinematic gait profiles have been consistent among studies,2–8 the muscle-activity gait profiles of patients with CAI have been inconsistent. For example, Hopkins et al9 observed increased tibialis anterior and peroneus longus activation during stance in patients with CAI. These results are consistent with those of Delahunt et al,7 who noted increased peroneus longus activation, and Louwerens et al,12 who demonstrated increased tibialis anterior activity.7 Feger et al13 reported an earlier activation onset and a longer activation duration for the peroneus longus and an earlier activation onset for the rectus femoris. However, these findings from surface electromyography (sEMG) were inconsistent with those of other studies10,13–15 in which authors observed no differences in the sEMG activity of the proximal and distal musculature in the lower extremity during walking between the CAI and control groups. The reference task for sEMG normalization differed among studies,7,9,10,12–15 which makes comparisons difficult when examining how much of the group difference was due to the task itself or to the normalization.
Researchers have investigated kinetic gait profiles of patients with CAI, including ground reaction force (GRF),3,16,17 joint impulse,3 moment,5 power,5 and COP,9–11 but a comprehensive evaluation of the entire lower extremity or all relevant gait kinetic measures in the literature is limited. Investigators have reported increased peak braking and propulsive forces,16,17 greater eversion moment5 and concentric ankle power in the frontal plane,5 and a laterally deviated COP throughout stance.9–11 Impaired sensorimotor function,18 maladaptive supraspinal motor-control strategies,19,20 and arthrokinematic restrictions21,22 have been implicated as potential causes of altered gait neuromechanics in patients with CAI.
The inconsistent results of walking neuromechanics in patients with CAI may be attributed to several factors: (1) small sample sizes of 7 to 25 patients with CAI in previous studies,2–17,23–27 leading to type 2 statistical error and limitations in the statistical analyses that could be performed; (2) heterogeneous inclusion criteria across studies before the position statement on inclusion of participants with CAI was available23,24; (3) different experimental protocols (ie, treadmill versus level walking and shod versus barefoot)23,24; and (4) varied reference tasks for sEMG normalization (ie, maximal voluntary isometric contraction versus quiet standing versus a squatting position). Therefore, a comprehensive set of all relevant biomechanical data needs to be examined in a single investigation so that we can obtain gait profiles of patients with CAI and understand potential mechanisms related to the condition. Therefore, the purpose of our study was to examine walking neuromechanics, including kinematics, muscle activity, and kinetics (ie, GRF, moment, and power), between participants with and those without CAI using a novel statistical analysis among a large sample. We hypothesized that patients with CAI would exhibit alterations in all outcome measures during the stance phase of walking compared with matched, healthy individuals serving as controls.
METHODS
Design
This study was designed as a descriptive cohort controlled laboratory trial. Participants completed a single data-collection session, which took place in a biomechanics laboratory. The independent variable was group (CAI, control). The dependent variables were lower extremity (1) 3-dimensional (3D) GRFs; (2) joint powers; (3) internal joint moments; (4) joint angles; and (5) muscle-activation amplitudes of the tibialis anterior, peroneus longus, medial gastrocnemius, vastus lateralis, gluteus medius, and gluteus maximus.
Participants
We believed a sample size of 200 would provide adequate power for all outcome measures. To reduce the variance in participant selection, we followed inclusion criteria in accordance with current recommendations.28 We used the same experimental protocols (ie, shod, level walking) and the same reference task for sEMG normalization to reduce the effect of varied methodologic differences in the literature.
A total of 200 physically active individuals, consisting of 100 patients with CAI and 100 controls, were recruited from a university population and were between 18 and 35 years old. Physical activity levels were matched between the groups. All individuals had participated in moderate physical activity, as defined by the World Health Organization29 at the time of the study, at least 3 times per week, for a total of 90 minutes, in the 3 months before study enrollment. Inclusion and exclusion criteria were based on the position statement of the International Ankle Consortium.28 Inclusion criteria for the CAI group were (1) a history of at least 2 recurrent unilateral ankle sprains, the most recent sprain having occurred 3 months before study enrollment and the previous ankle sprain(s) having caused acute inflammatory symptoms (eg, pain, swelling) and at least 1 interrupted day of desired physical activity; (2) a history of at least 2 episodes of giving way in the injured ankle in the 6 months before study enrollment; (3) at least 2 responses of yes on questions 4 to 8 (ie, a feeling of an unstable ankle during functional activity) of the Modified Ankle Instability Instrument; (4) a score of less than 90% on the Functional Ankle Ability Measure (FAAM)–Activities of Daily Living; and (5) a score of less than 80% on the FAAM–Sports. Inclusion criteria for the control group were (1) no history of ankle sprain, (2) no responses of yes on questions 4 to 8 of the Modified Ankle Instability Instrument, (3) a score of 100% on the FAAM–Activities of Daily Living, and (4) a score of 100% on the FAAM–Sports. Exclusion criteria for both groups were (1) a history of surgery to the lower extremity musculoskeletal structures (ie, bones, joint structures, or nerves), (2) a history of lower extremity fracture requiring realignment, and (3) acute sport-related injury to the lower extremity musculoskeletal structures in the 3 months before the study that resulted in at least 1 interrupted day of desired physical activity. Of the participants with CAI, 30 had a history of unilateral ankle sprains and 70 had a history of bilateral ankle sprains. Participants with bilateral CAI selected the limb they perceived as having greater instability as their testing limb. The testing limb was matched between groups. Participant demographics are presented in the Table. All participants provided written informed consent, and the study was approved by Brigham Young University Institutional Review Board for Human Subjects.
Table.
Participant Demographics
|
Characteristic |
Group |
P Value |
F1,198 Value |
|
|
Chronic Ankle Instability |
Control |
|||
|
No. |
||||
| Sex (male/female) | 49/51 | 55/45 | ||
|
Mean ± SD |
||||
| Age, y | 22.2 ± 2.3 | 22.5 ± 3.3 | .77 | 0.39 |
| Height, cm | 174.0 ± 9.7 | 173.1 ± 13.3 | .32 | 0.90 |
| Mass, kg | 70.8 ± 14.4 | 72.6 ± 18.7 | .49 | 0.59 |
| Foot and Ankle Ability Measure, % | ||||
| Activities of Daily Living subscale | 82.5 ± 9.2 | 100.0 ± 0.0 | <.001 | 365.00 |
| Sports subscale | 62.2 ± 12.8 | 100.0 ± 0.0 | <.001 | 871.00 |
| Modified Ankle Instability Index, No. of yes responses | 3.6 ± 1.2 | 0.0 ± 0.0 | <.001 | 867.00 |
| Ankle sprains, No. | 4.6 ± 3.0 | 0.0 ± 0.0 | <.001 | 234.00 |
| Duration, mo | 19.4 ± 17.2 | 0.0 ± 0.0 | <.001 | 116.00 |
Procedures
To facilitate motion analysis during the walking trials, participants dressed in standardized spandex clothing and athletic shoes (T-Lite XI; Nike, Beaverton, OR). We placed reflective markers on the head; over the C7 and T7 vertebrae; over the sternum; and bilaterally over the acromion process, inferior angle of the scapula, lateral humeral epicondyle, ulnar head, anterior- and posterior-superior iliac spines, greater trochanter, medial and lateral femoral condyles, medial and lateral malleoli, posterior medial heel, posterior lateral heel, posterior superior heel, navicular, base of the third metatarsal, base of the fifth metatarsal, and between the second and third metatarsal heads. Foot markers were attached directly to the outside of the footwear without creating holes in the shoes. Rigid clusters of 4 reflective markers were attached bilaterally to the lateral thigh and shank.30 Twelve high-speed video cameras (models T10 and 40S; Vicon, Centennial, CO) recorded the spatial position of the reflective markers during the gait trials at a rate of 250 Hz.
To facilitate sEMG data collection during the gait trials, we applied wireless, rectangular, 27 × 37 × 15-mm surface electrodes (Trigno IM Sensor; Delsys, Boston, MA), sampling at a rate of 2500 Hz, over the tibialis anterior, peroneus longus, medial gastrocnemius, vastus lateralis, gluteus medius, and gluteus maximus muscles. The sensor placement for sEMG was based on the recommendations of Merletti and Di Torino,31 including preparing the skin with a shaver and alcohol wipes; determining the sensor location using anatomic landmarks; placing the sensor halfway between 2 landmarks; orienting the sensor parallel to the muscle fibers and affixing it using double-sided, adhesive stretch tape (Powerflex; Andover Healthcare Inc, Salisbury, MA); and testing the connection.
For the walking trials, participants walked at a self-selected speed over 2 force plates (model OR6-6-1; AMTI, Watertown, MA) embedded in the laboratory floor and sampling at a rate of 2500 Hz; 1 foot contacted each force plate. During pilot testing, walking speed was recorded using a Brower timing system (TCi system; Draper Timing Systems, Draper, UT) to determine the optimal number of practice walking trials before the testing trials. Participants completed 8 to 10 practice trials followed by 5 testing trials, walking at their normal stride and in their normal gait pattern at self-selected speed (±5% between trials) in a consistent way. During the practice trials, we used a predetermined location (4 m from the center of the force plates) for all participants to begin their walking trials. For the walking trials, we chose a starting location that was approximately 4 m away from the force plates and was either the location of the starting limb (right or left) during practice trials or a slightly shorter or longer distance from that location. We marked this location on the laboratory floor with white tape. Therefore, participants initiated and ended each walking trial approximately 4 m from the center of the force plates.
Data Processing
Details of the data processing have been described.30,32 The spatial trajectories of the reflective markers were tracked using Vicon software and exported into Visual 3D (C-Motion, Germantown, MD), and 3D kinematics and kinetics were calculated. Marker trajectories and force-plate data were smoothed using a fourth-order, low-pass Butterworth filter with a cutoff frequency of 6 Hz. The smoothed marker coordinates were used to calculate lower extremity kinematics. We determined 3D joint kinematics using a Cardan rotation sequence of flexion-extension, abduction-adduction, and internal-external rotation. The 3D internal net hip-, knee-, and ankle-joint moments were estimated via synchronized joint kinematics, GRFs, and anthropometric data using the method of Dempster.33 Reference muscle-activation data were obtained using a goniometer (model EGM-422; Elite Medical Instruments, Inc, Fullerton, CA) during a 3-second isometric double-legged squat position (45° of knee flexion and 30° of hip flexion) before the walking trials.32,34 Muscle-activation data were smoothed using a root mean square algorithm with a moving window of 125 milliseconds and normalized to the smoothed reference muscle-activation data using custom-written algorithms in MATLAB (The MathWorks, Inc, Natick, MA).32,34
The stance phase of walking was defined as the time when the involved foot was in contact with the force plate. A vertical GRF of 15 N was used as the threshold to determine heel strike and toe-off of the involved limb during walking. Walking speed was recorded using the Vicon motion-capture system and force plates and was calculated using the Visual 3D software using a stride length and stance time from heel strike to heel strike for the testing limb (1 full stride) for the statistical analysis of walking speed.
The gait cycle during walking is 60% stance phase and 40% swing phase. Given that we analyzed the stance phase of walking, we converted 60% of stance phase to 100% of stance phase (0% = heel strike, 100% = toe-off). Therefore, we use the following terms: early stance (1%–17% of stance), midstance (18%–50% of stance), terminal stance (51%–83% of stance), and preswing (84%–100% of stance).
Statistical Analysis
We analyzed biomechanical data using a novel statistical analysis approach called functional data analysis (functional linear models; R Program, version 1.1.383; RStudio, Boston, MA).34 The analysis was described in a previous article.35 Briefly, this analysis evaluated patterns of walking neuromechanics using polynomial functions (curves) from the control group as a normal “function” for all dependent variables (ie, walking kinematics, kinetics, and muscle activation) when compared with the CAI group. This functional approach provided us with an estimate of effect sizes (ie, 95% confidence intervals [CIs]) across the entire stance phase of walking, which allowed a comprehensive comparison of walking neuromechanics between the CAI and control groups. When 95% CIs did not cross zero, the group values were considered different. This novel statistical approach also addressed the limitations of traditional statistical analyses by analyzing discrete time points or averaging certain time periods over the gait cycle.3,5,7,12,15,16,36
A 1-way analysis of variance was performed using JMP Pro 13 (SAS Institute Inc, Cary, NC) to assess potential between-groups differences in walking speed. The α level was set at .05.
RESULTS
Participant Demographics
No between-groups differences existed for participant demographics, including age (P = .77), height (P = .32), and mass (P = .49; Table).
Summary of Walking Neuromechanics
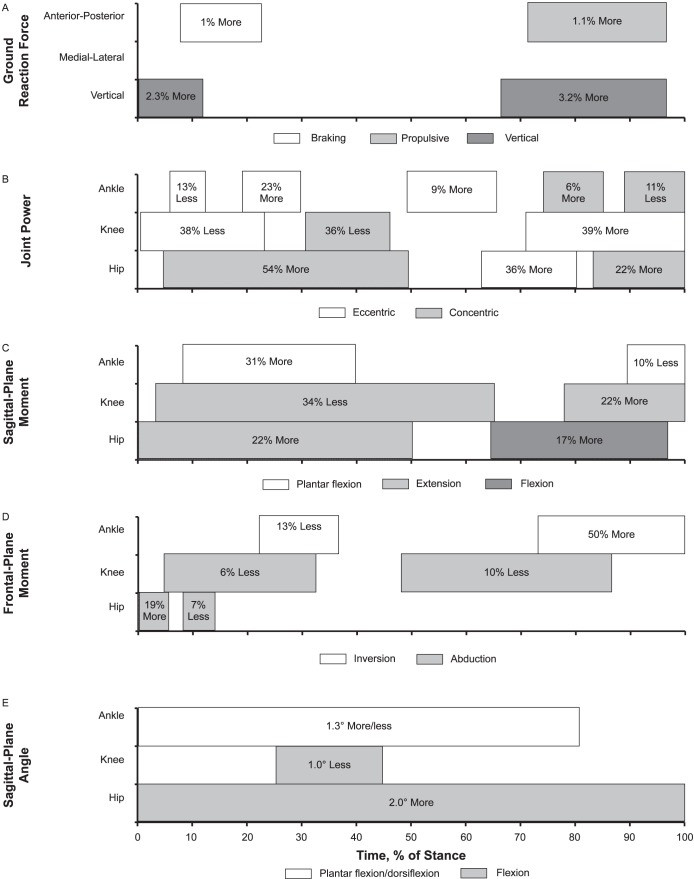
Our findings for all outcome measures, including GRF, power, moment, angle, and muscle activity, across the stance phase of walking between groups are provided in Figure 1.
Figure 1.
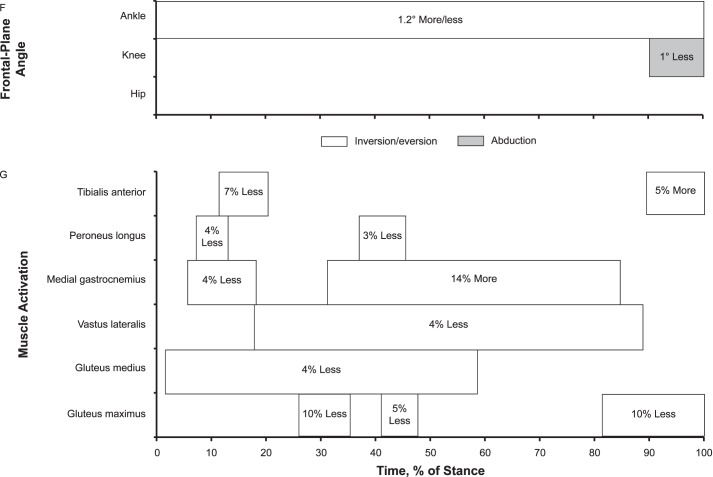
A summary model for gait neuromechanics in chronic ankle instability during stance: 1%–17% = early stance, 18%–50% = midstance, 51%–83% = terminal stance, and 84%–100% = preswing. Between-groups differences for A, ground reaction force; B, joint power; C, sagittal-plane moment; D, frontal-plane moment; E, sagittal-plane angle; F, frontal-plane angle; and, G, muscle activation. Continued on next page.
Figure 1.
Continued from previous page.
Ground Reaction Forces
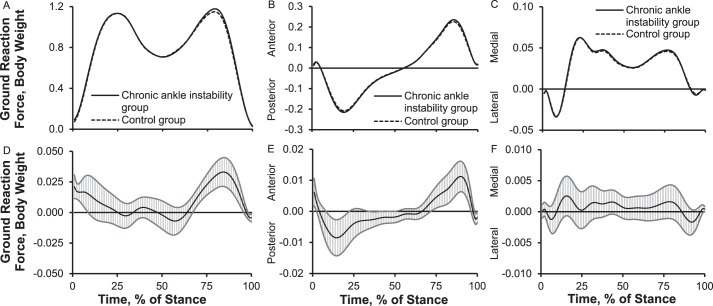
The CAI group demonstrated up to 2.3% (0.023 body weight [BW]) more vertical GRF during early stance and 3.2% (0.032 BW) more vertical GRF between terminal stance and preswing than the control group. The CAI group also displayed 1.0% (0.01 BW) more braking GRF during early stance and 1.1% (0.011 BW) more propulsive GRF between terminal stance and preswing. Medial-lateral GRF did not differ between the groups (Figure 2).
Figure 2.
Ground reaction forces (GRFs) over the stance phase of walking: 1%–17% = early stance, 18%–50% = midstance, 51%–83% = terminal stance, and 84%–100% = preswing. A, Vertical GRF. B, Anterior-posterior GRF. C, Medial-lateral GRF. D, Between-groups differences for vertical GRF. E, Between-groups differences for anterior-posterior GRF. F, Between-groups differences for medial-lateral GRF. When 95% confidence intervals (shaded gray area) did not cross zero, the group values were different.
Joint Power
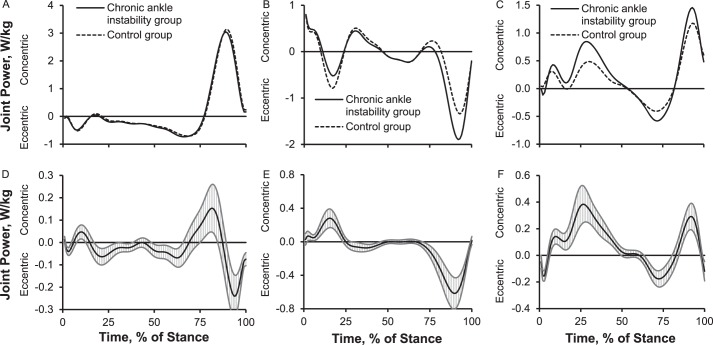
We observed up to 13% (0.05 W/kg) less ankle eccentric power during early stance, 9% to 23% (0.06 W/kg) more ankle eccentric power between midstance and terminal stance, 6% (0.15 W/kg) more ankle concentric power during terminal stance, and 11% (0.23 W/kg) less ankle concentric power during preswing in the CAI group than the control group. The CAI group also exhibited 38% (0.27 W/kg) less knee eccentric power during early stance, 36% (0.11 W/kg) less knee concentric power during midstance, and 39% (0.61 W/kg) more knee eccentric power between terminal stance and preswing than the control group. Compared with the control group, the CAI group exerted 54% (0.38 W/kg) more hip concentric power between early stance and midstance, 36% (0.6 W/kg) more hip eccentric power during terminal stance, and 22% (0.3 W/kg) more hip concentric power during preswing (Figure 3).
Figure 3.
Lower extremity sagittal-plane joint powers over the stance phase of walking: 1%–17% = early stance, 18%–50% = midstance, 51%–83% = terminal stance, and 84%–100% = preswing. A, Ankle-joint power. B, Knee-joint power. C, Hip-joint power. D, Between-groups differences for ankle-joint power. E, Between-groups differences for knee-joint power. F, Between-groups differences for hip-joint power. When 95% confidence intervals (shaded gray area) did not cross zero, group values were different.
Joint Moments
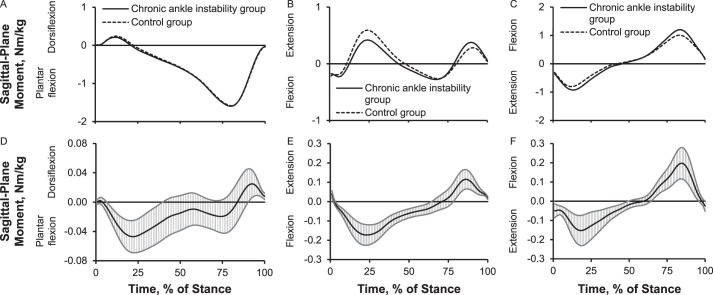
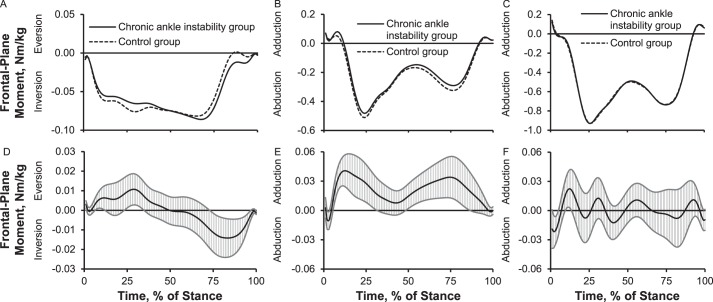
Up to 31% (0.05 Nm/kg) more plantar-flexion moment between early stance and midstance and 10% (0.02 Nm/kg) less plantar-flexion moment during preswing occurred in the CAI group than in the control group. The CAI group showed 34% (0.1 Nm/kg) more knee-flexion moment between early stance and terminal stance, 34% (0.17 Nm/kg) less knee-extension moment during midstance, and 22% (0.1 Nm/kg) more knee-extension moment during preswing than the control group. The CAI group also displayed 22% (0.15 Nm/kg) more hip-extension moment between early stance and midstance and 17% (0.2 Nm/kg) more hip-flexion moment between terminal stance and preswing (Figure 4). Compared with the control group, the CAI group exhibited up to 13% (0.01 Nm/kg) less inversion moment between early stance and midstance and 50% (0.014 Nm/kg) more inversion moment between terminal stance and preswing; 6% to 10% (0.04 Nm/kg) less knee-abduction moment during early stance, midstance, and terminal stance; and 19% (0.02 Nm/kg) more hip-adduction moment and 7% (0.02 Nm/kg) less hip-abduction moment during early stance (Figure 5).
Figure 4.
Lower extremity sagittal-plane internal joint moments over the stance phase of walking: 1%–17% = early stance, 18%–50% = midstance, 51%–83% = terminal stance, and 84%–100% = preswing. Sagittal plane: A, ankle moment; B, knee moment; C, hip moment. Between-groups differences for sagittal plane: D, ankle moment; E, knee moment; F, hip moment. When 95% confidence intervals (shaded gray area) did not cross zero, group values were different.
Figure 5.
Lower extremity frontal-plane internal joint moments over the stance phase of walking: 1%–17% = early stance, 18%–50% = midstance, 51%–83% = terminal stance, and 84%–100% = preswing. Frontal plane: A, ankle moment; B, knee moment; C, hip moment. Between-groups differences for frontal plane: D, ankle moment; E, knee moment; F, hip moment. When 95% confidence intervals (shaded gray area) did not cross zero, group values were different.
Joint Angles
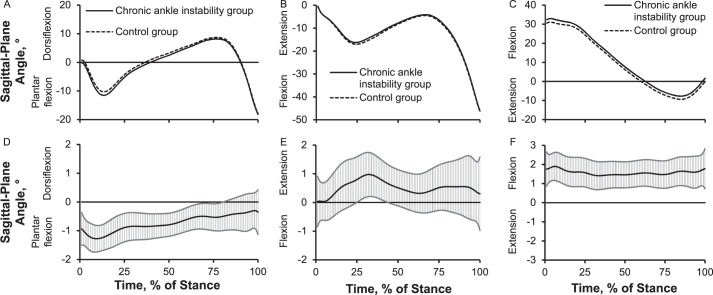
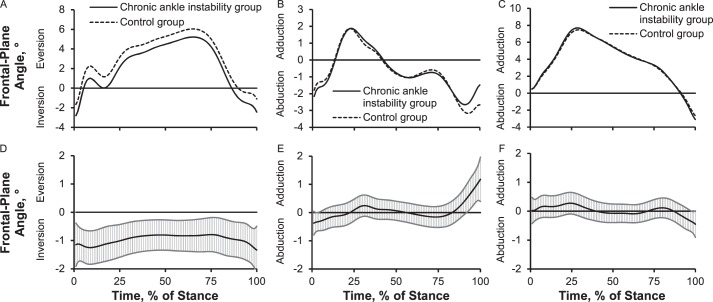
Up to 1.3° more plantar flexion or less dorsiflexion across most of stance, 1.0° less knee flexion during midstance, and 2.0° more hip flexion throughout the entire stance phase of walking was present in the CAI group than in the control group (Figure 6). We also noted that the CAI group demonstrated up to 1.2° more inversion or less eversion over the entire stance phase and 1.0° less knee abduction during preswing. However, the hip frontal-plane angle did not differ between groups (Figure 7).
Figure 6.
Lower extremity sagittal-plane joint angles over the stance phase of walking: 1%–17% = early stance, 18%–50% = midstance, 51%–83% = terminal stance, and 84%–100% = preswing. Sagittal plane: A, ankle angle; B, knee angle; C, hip angle. Between-groups differences for sagittal plane: D, ankle angle; E, knee angle; F, hip angle. When 95% confidence intervals (shaded gray area) did not cross zero, group values were different.
Figure 7.
Lower extremity frontal-plane joint angles over the stance phase of walking: 1%–17% = early stance, 18%–50% = midstance, 51%–83% = terminal stance, and 84%–100% = preswing. Frontal plane: A, ankle angle; B, knee angle; C, hip angle. Between-groups differences for frontal plane: D, ankle angle; E, knee angle; F, hip angle. When 95% confidence intervals (shaded gray area) did not cross zero, group values were different.
Muscle Activation
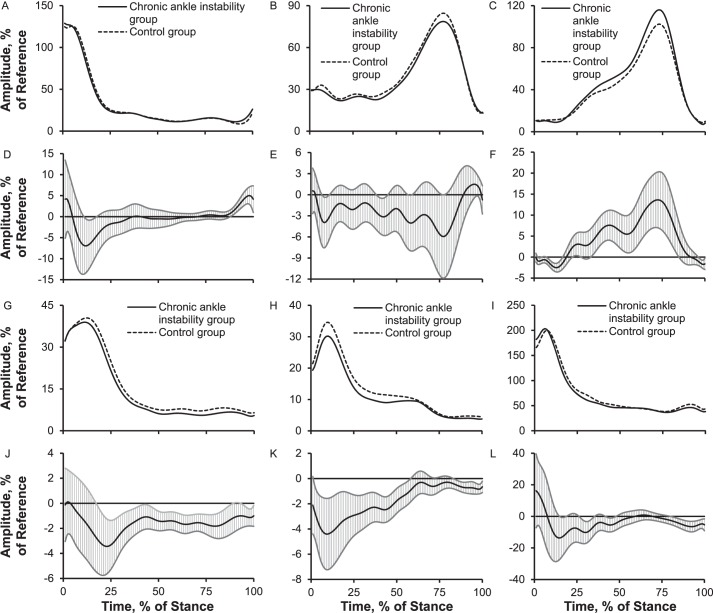
Compared with the control group, the CAI group presented up to 7% less tibialis anterior EMG activation during brief parts of early stance and 5% more during preswing; 3% to 4% less peroneus longus EMG activation between brief parts of early stance and midstance; 4% less medial gastrocnemius EMG activation during early stance and 14% more throughout most of stance; 4% less vastus lateralis EMG activation throughout most of stance; 4% less gluteus medius EMG activation throughout most of stance; and 5% to 10% less gluteus maximus EMG activation during brief parts of early stance, midstance, and preswing (Figure 8).
Figure 8.
Electromyography activation amplitudes of 6 lower extremity muscles over the stance phase of walking: 1%–17% = early stance, 18%–50% = midstance, 51%–83% = terminal stance, and 84%–100% = preswing. A, Tibialis anterior. B, Peroneus longus. C, Medial gastrocnemius. Between-groups differences for D, the tibialis anterior; E, the peroneus longus; F, the medial gastrocnemius; G, vastus lateralis; H, gluteus medius; I, gluteus maximus. Between-groups differences for J, the vastus lateralis; K, the gluteus medius; L, the gluteus maximus. When 95% confidence intervals (shaded gray area) did not cross zero, group values were different.
Walking Speed
We found no between-groups differences for walking speed (P = .51). Average self-selected walking speeds were 1.55 ± 0.13 m/s for the CAI group and 1.56 ± 0.14 m/s for the control group.
DISCUSSION
To our knowledge, we are the first to comprehensively and simultaneously examine walking neuromechanics between CAI and control groups in a single study. Our results generally supported our hypotheses. To summarize the gait analysis, the CAI group showed increased braking, propulsive, and vertical forces; slightly increased ankle eccentric power but less ankle concentric peak power; less knee eccentric power but more concentric power; increased hip concentric and eccentric power; increased plantar-flexion angle and moment; less knee-flexion angle and knee-extension moment; increased hip-flexion angle and hip-extension moment; increased inversion angle and moment; and decreased muscle activation of the proximal and distal musculature except the medial gastrocnemius. Therefore, increased impact and propulsive loading such that the hip seemed to play an important role in dissipating and generating the forces were evident in the CAI group. During most of stance, the CAI group had altered foot neuromechanics that may increase their susceptibility to recurrent lateral ankle sprain (ie, increased plantar-flexion angle and moment, medial gastrocnemius activation, and inversion angle; less or more inversion moment; and less tibialis anterior activation). Along with the proximal-joint disablement during stance in the CAI group, the distal hip joint also appeared to display altered walking neuromechanics in the form of increased hip-flexion angle and hip-extension moment and decreased gluteus maximus and medius activation. The altered motor-control strategies exhibited by the CAI group were consistent with previous data.23,24
Increased GRF and Implications for Lower Extremity Joint Health
The CAI group displayed 2.3% more vertical GRF and 1.0% more braking GRF during early stance and 3.2% more vertical GRF and 1.1% more propulsive GRF between terminal stance and preswing than the control group. To our knowledge, the authors of only 3 articles3,16,17 have reported GRF, and only peak braking and propulsive force were measured during walking among participants with CAI. Our findings are consistent with the studies16,17 in which the researchers noted increased braking and propulsive GRF during walking among participants with CAI. Increased vertical, braking, and propulsive GRF (1.0%–3.2%) may be attributed to sensorimotor impairments that lead to the inability to appropriately modulate impact force during walking, indicating altered feedforward and feedback motor control among participants with CAI.16,17 They may have also voluntarily tried to control loading of the foot by splinting the segment during early stance as a protective mechanism, only to compensate later in stance by increasing propulsion. These alterations could have resulted in altered feedforward motor control as they were reinforced during walking.19,27 Furthermore, in previous studies, participants exhibited a laterally deviated COP during walking9 and running37 and an inverted foot position during walking2,5–8 and running.4,25,36 Given these findings, it might seem reasonable to expect participants with CAI to show greater lateral GRF during early stance and less medial GRF during midstance and terminal stance. Whereas we did not find between-groups differences in medial-lateral GRF, our data may still be consistent with earlier results of laterally deviated COP trajectories during walking. Considering whole-body movement, the center of mass could move laterally with increased inversion of the foot, maintaining the expected medial-lateral GRF while shifting the COP under the foot to the lateral side.
Although the main causes of 1.0% to 3.2% more vertical, braking, and propulsive GRF and their long-term effects on ankle articular cartilage health are not fully understood, a greater magnitude of vertical and braking GRF during early stance may alter loading of lower extremity cartilage and bone. Increased vertical and braking GRF and altered kinematics may affect articular cartilage metabolism and health.38,39 Denning et al38 showed that changes in BW and GRF altered articular cartilage catabolism due to walking. Calhoun et al39 reported that the ankle plantar-flexion position reduced the contact area but increased the average high pressure in the ankle; therefore, this inverted foot position increased the contact area of the medial facet of the ankle. Based on these findings, 1.2° more inversion or less eversion and 1.3° plantar-flexion foot kinematics along with 1.0% to 3.2% greater vertical and braking GRF during early stance in our study could increase the interstitial compressive and tensional contact stresses in the medial areas of the talus, narrowing the joint space in the medial ankle and opening the joint space in the lateral ankle, as shown in a 3D human ankle-joint model.39 Moreover, arthroscopic studies have indicated that 62% of cartilage lesions were in the medial areas of the talus among patients with CAI,40 and unbalanced mechanical loading in the medial ankle joint appeared to be a main cause of degenerative arthritis of the ankle.41 Therefore, unbalanced mechanical loading acting on the talus and increased local compressive and tensional contact stress in the medial areas of the talus during functional tasks may alter cartilage tissue remodeling in patients with CAI.42 If unbalanced mechanical loading acts on the talus at a high rate over the long term, even during walking among patients with CAI, the structural properties of the ankle articular cartilage (ie, collagen, proteoglycans, water content) may be affected.42
Hip-Dominant Gait Strategy (Kinetic and Kinematic)
To our knowledge, only Monaghan et al5 have studied walking joint power, but their outcomes were limited to frontal-plane ankle-joint power. Therefore, our results provide a valuable addition to the literature. Joint power is the product of net internal joint moment and joint angular velocity and reflects absorption and production of kinetic energy about a joint. Furthermore, the simultaneous consideration of ankle-, knee-, and hip-joint power can provide insight into segmental and joint coordination during walking. Our work suggested that, for patients with CAI, the hip plays a relatively large role in producing and absorbing kinetic energy during different parts of the gait cycle. We find it interesting that among the CAI group, the ankle (9%–23% more eccentric power) and hip (36% more eccentric power) muscles appeared to absorb energy via eccentric action; however, the hip appeared to generate only 22% more forward acceleration via concentric power, and the knee absorbed 38% less energy eccentrically during early stance. Given that the plantar flexors play a substantial role in generating power for forward acceleration during preswing, the 22% more hip concentric joint power during preswing that we observed may be attributed to 11% less ankle concentric power. This reduction may be due to decreased plantar-flexor function as previously reported among patients with CAI.43,44 According to our findings, patients with CAI appear to use a hip-dominant gait strategy for power production (ie, concentric energy) by reweighting joint power from the distal (ankle and knee) to the proximal (hip) joint.
The aforementioned hip-dominant gait strategy has also been documented in patients with CAI during landing and cutting.34,45 They appear to rely more on the hip joint by increasing hip-joint stiffness, hip-flexion angle, hip-extension moments, and eccentric and concentric joint powers during jump landing and cutting to compensate for reduced ankle-joint stiffness, plantar-flexion moments, and eccentric and concentric powers.34,45 One possible explanation for this hip-dominant movement strategy in patients with CAI may be sensorimotor deficits in proprioception, motor-neuron pool excitability, reflex reactions, muscular strength, and postural control, as suggested by Hertel.18 We believe that these sensorimotor deficits, along with mechanical deficits (ie, ligament laxity, arthrokinematic restrictions, and osteokinematic restrictions), could result in a maladaptive movement strategy, regardless of the task,26 via the spinal or supraspinal sensorimotor pathways.1,19,20,27 It seems likely that the hip is a centerpiece for lower extremity compensatory motor control during walking, jump landing. and cutting, which might be due to mechanical advantages (ie, longer muscle fiber, greater muscle mass, greater muscle strength). More data are needed to better understand the consequences of this hip-dominant movement strategy on the risk of recurrent sprains for patients with CAI.
Contrary to previous findings5,7 of no differences in knee and hip sagittal-plane angles and moments during walking, we observed altered joint coordination in the lower extremity joints. The CAI group demonstrated sagittal-plane movement compensation with 2.0° more hip flexion and 22% more hip-extension moment across most of stance. We believe that 2.0° more hip flexion may be associated with our finding of 1.3° less dorsiflexion, in which limited ankle kinematic displacement in the sagittal plane could result in greater compensation at the hip, as shown during jump landing and cutting by Son et al.34 A reduction of 1.3° dorsiflexion during walking, likely due to arthrokinematic restrictions after lateral ankle sprains,21,22 is commonly observed among patients with CAI during walking,2–4 running,25,46 jump landing,34 and cutting.34 Our findings of sagittal-plane kinematics coincided with 31% more plantar-flexion moment, 34% less knee-extension moment, and 22% more hip-extension moment during a similar stance.
From a clinical standpoint, 1.3° less dorsiflexion or more plantar flexion during stance may reduce the ability to absorb impact at heel strike and generate power for forward acceleration through the plantar flexors. For example, a more dorsiflexed foot position at heel strike is considered a stable, rigid, close-packed position, which helps to properly transmit the impact to the proximal joints. Moreover, increased dorsiflexion between midstance and terminal stance can theoretically assist in absorbing more energy via the eccentric action of the plantar flexors, which could generate more kinetic energy concentrically for forward acceleration during terminal stance and preswing. Clinical interventions for patients with CAI should focus on intrajoint coordination of all 3 lower extremity joints by reducing the hip-flexion angle and increasing dorsiflexion and the knee-flexion angle so the body can modulate mechanical loading appropriately across all 3 lower extremity joints during walking.
Foot Positions That May Increase Susceptibility to a Lateral Ankle Sprain
The CAI group exhibited an injurious foot and ankle position during stance that may contribute to episodes of giving way and recurrent lateral ankle sprains. For example, the CAI group demonstrated 1.3° more plantar-flexion or less dorsiflexion angle across most of stance and 1.2° more inversion or less eversion angle across the entire stance phase. These positions are consistent with previous findings2–8 and likely increase the reinjury risk. This altered foot and ankle position may be a conserved pattern across various functional tasks in patients with CAI.26 It is important to note that 1.3° more plantar flexion during early stance is likely associated with 31% more plantar-flexion moment between early and midstance, 13% less ankle eccentric power in early stance, and 23% more ankle eccentric power between midstance and terminal stance. Moreover, 1.2° more inversion angle, along with 13% less inversion moment and 3% to 4% less peroneus longus EMG activation during early stance and midstance, may indicate poor dynamic stability of the ankle joint in patients with CAI. Given that the CAI group demonstrated more vertical (2.3%) and braking (1.0%) GRFs and 4% to 7% less activation of the ankle musculature (ie, tibialis anterior, peroneus longus, and medial gastrocnemius) during early stance, they appeared to use a maladaptive gait strategy in the distal joint, which may have been due to disrupted sensory integration and subsequent motor response after ankle injury.18
In our study, limited dorsiflexion (1.3°) angle during midstance may have been due to a mechanical deficit after ankle injury. Lateral ankle sprains have been shown to lead to arthrokinematic restrictions in which the talus is displaced more anteriorly, internally, and superiorly relative to the tibia,21,22 which can result in reduced dorsiflexion or increased plantar-flexion angle during walking.2–4 As such, a repeated gait task with arthrokinematic restrictions (ie, limited dorsiflexion) may lead to altered gait patterns. This local alteration is key to developing a maladaptive gait strategy via the spinal and supraspinal pathways as postinjury adaptations.18–20,27 Therefore, the motor control that existed before ankle injury would be replaced with altered motor control, and this altered gait pattern may become permanent if the tasks (ie, walking, running, or jump landing) are repeated frequently over the long term.
A maladaptive kinematic gait pattern (ie, increased inversion or decreased eversion and increased plantar flexion or reduced dorsiflexion) has been consistently observed during walking,2–8 running,4,25,36,46 and jump landing15,36,47 among patients with CAI. Given these similar findings regardless of the functional task,26 it would be reasonable to attribute a lateral ankle sprain to changes in global, central, and supraspinal motor control as a feedforward mechanism during functional tasks.19,20,26 The risk of a lateral ankle sprain could be increased if altered foot kinematics are present during more dynamic, multiplanar tasks, such as jump landing and cutting, because most sprains (75%) occur during landing and cutting.48 Specifically, altered foot and ankle positions have been consistently reported in this population with CAI during a single-legged drop landing,47 single-legged cutting,15 and double-legged stop-jump landing.36
Neural-Activation Deficits in the Gluteus Medius
Researchers43,49,50 have suggested a possible interaction between CAI and hip-abductor weakness. The gluteus medius muscle contributes to balance control of the pelvis, trunk, upper extremities, and head in the frontal plane during the early stance and midstance phases of walking.51 An inability to control the balance of the pelvis, trunk, upper extremities, and head would influence foot placement in the frontal plane during walking.51 MacKinnon and Winter51 suggested that total-body balance in the frontal plane during walking is regulated by the subtalar and hip joints that control the center-of-mass position and upper extremity motion (ie, pelvis, trunk, upper extremities, and head). The ankle corrects small errors in faulty foot placement, and the hip corrects large errors in faulty foot position; therefore, the ankle and hip work in synergy. When the foot is placed into a vulnerable position for lateral ankle sprain (ie, greater inversion) in the frontal plane, faulty foot placement could be corrected via an interplay between evertors and hip abductors, suggesting the importance of gluteus medius function in CAI. Given that reduced gluteus medius function would increase hip adduction (ie, lateral pelvic tilt) and create poor balance of the pelvic, trunk, upper extremities, and head, the center of mass would move laterally, potentially predisposing patients with CAI to lateral ankle sprains. When our results of increased inversion angle and decreased gluteus medius activation are combined with previously reported hip-abductor weakness43,49,50 and a laterally deviated COP position during walking,9–11 they are consistent with the idea that patients with CAI might be at greater risk for lateral ankle sprains.
Alterations in muscle activation existed between groups. Some differences help explain the kinetic and kinematic profiles in our study and were consistent, whereas others conflict with previous studies.
Altered Muscle Activation in Various Lower Extremity Muscles
Muscle activation of 6 lower extremity muscles was altered across various portions of stance between the CAI and control groups. Reduced muscle activation of the tibialis anterior (7%), peroneus longus (4%), and vastus lateralis (4%) and increased muscle activation of the medial gastrocnemius (14%) and tibialis anterior (5% during preswing) appeared to be associated with kinematics and kinetics that were in less or more muscle-demanding positions, leading to more plantar flexion, less inversion (and more inversion during preswing), and less knee-extension moment across various stance phases. However, less muscle activation of the gluteus medius (4%) and gluteus maximus (5%–10%) may suggest neural-activation deficits in the CAI group given that no between-groups difference existed in hip frontal-plane angle and the CAI group had 2° more hip-flexion angle (a more muscle-demanding position). Caution should be taken when interpreting our muscle-activation results for walking. For example, our findings conflict with those of authors who reported a 10% to 12% increase in peroneus longus muscle activation during heel strike and preswing,9 a 42.5% increase in peroneus longus muscle activation (averaged activation) during early stance (heel strike to 80 milliseconds after heel strike),7 a 35.2% increase in peroneus longus muscle-activation time during the gait cycle,13 or no difference between CAI and control groups.12,15 The reference task for sEMG normalization differed among numerous studies, which makes comparison across studies difficult. In our study, the mean of a 3-second squatting position was used as the reference task, whereas other researchers used maximal voluntary isometric contraction or quiet standing. Therefore, it is difficult to know whether patients with CAI or control participants used more or less motor activity during those normalization tasks, which makes it challenging to determine how much of the group difference was due to the task itself and how much was due to normalization.
LIMITATIONS
Our results should be interpreted in light of several limitations. First, our university population had a mean age of 22 years. Because age plays a role in walking neuromechanics, our findings can be generalized to only the targeted populations. Second, we included participants with unilateral and bilateral ankle sprains. Participants with bilateral ankle sprains selected the involved limb based on their perceptions of instability. We did not compare bilateral walking neuromechanics, which may alter the neuromechanics of the involved limb. Third, the sex ratios of the CAI and control groups were not perfectly matched, which was due to systematic errors found in force-plate data during data processing (lost data from 40 participants). This relatively small unequal sex ratio potentially compromised our results. Fourth, we conducted a retrospective cohort study, so we cannot confirm whether the observed changes in walking neuromechanics were mainly caused by ankle sprain or whether the CAI group may have had altered walking neuromechanics before injury.
CONCLUSIONS
The CAI group demonstrated a hip-dominant strategy by limiting propulsive forces at the ankle while increasing force generation at the hip. The different walking neuromechanics exhibited by the CAI group may represent maladaptive strategies that developed after the initial sprain or an injurious gait pattern that may have predisposed the group to the initial injury. Increased joint loading and altered kinematics at the foot and ankle complex during initial stance could affect the long-term health of the ankle articular cartilage.
REFERENCES
- 1.Hertel J. Functional anatomy, pathomechanics, and pathophysiology of lateral ankle instability. J Athl Train. 2002;37(4):364–375. [PMC free article] [PubMed] [Google Scholar]
- 2.Dingenen B, Deschamps K, Delchambre F, Van Peer E, Staes FF, Matricali GA. Effect of taping on multi-segmental foot kinematic patterns during walking in persons with chronic ankle instability. J Sci Med Sport. 2017;20(9):835–840. doi: 10.1016/j.jsams.2017.04.004. [DOI] [PubMed] [Google Scholar]
- 3.Spaulding SJ, Livingston LA, Hartsell HD. The influence of external orthotic support on the adaptive gait characteristics of individuals with chronically unstable ankles. Gait Posture. 2003;17(2):152–158. doi: 10.1016/s0966-6362(02)00072-3. [DOI] [PubMed] [Google Scholar]
- 4.Chinn L, Dicharry J, Hertel J. Ankle kinematics of individuals with chronic ankle instability while walking and jogging on a treadmill in shoes. Phys Ther Sport. 2013;14(4):232–239. doi: 10.1016/j.ptsp.2012.10.001. [DOI] [PubMed] [Google Scholar]
- 5.Monaghan K, Delahunt E, Caulfield B. Ankle function during gait in patients with chronic ankle instability compared to controls. Clin Biomech (Bristol, Avon) 2006;21(2):168–174. doi: 10.1016/j.clinbiomech.2005.09.004. [DOI] [PubMed] [Google Scholar]
- 6.Wright CJ, Arnold BL, Ross SE, Pidcoe PE. Individuals with functional ankle instability, but not copers, have increased forefoot inversion during walking gait. Athl Train Sports Health Care. 2013;5(5):201–209. [Google Scholar]
- 7.Delahunt E, Monaghan K, Caulfield B. Altered neuromuscular control and ankle joint kinematics during walking in subjects with functional instability of the ankle joint. Am J Sports Med. 2006;34(12):1970–1976. doi: 10.1177/0363546506290989. [DOI] [PubMed] [Google Scholar]
- 8.Drewes LK, McKeon PO, Paolini G, et al. Altered ankle kinematics and shank-rear-foot coupling in those with chronic ankle instability. J Sport Rehabil. 2009;18(3):375–388. doi: 10.1123/jsr.18.3.375. [DOI] [PubMed] [Google Scholar]
- 9.Hopkins JT, Coglianese M, Glasgow P, Reese S, Seeley MK. Alterations in evertor/invertor muscle activation and center of pressure trajectory in participants with functional ankle instability. J Electromyogr Kinesiol. 2012;22(2):280–285. doi: 10.1016/j.jelekin.2011.11.012. [DOI] [PubMed] [Google Scholar]
- 10.Koldenhoven RM, Feger MA, Fraser JJ, Saliba S, Hertel J. Surface electromyography and plantar pressure during walking in young adults with chronic ankle instability. Knee Surg Sports Traumatol Arthrosc. 2016;24(4):1060–1070. doi: 10.1007/s00167-016-4015-3. [DOI] [PubMed] [Google Scholar]
- 11.Nyska M, Shabat S, Simkin A, Neeb M, Matan Y, Mann G. Dynamic force distribution during level walking under the feet of patients with chronic ankle instability. Br J Sports Med. 2003;37(6):495–497. doi: 10.1136/bjsm.37.6.495. [DOI] [PMC free article] [PubMed] [Google Scholar]
- 12.Louwerens JW, van Linge B, de Klerk LW, Mulder PG, Snijders CJ. Peroneus longus and tibialis anterior muscle activity in the stance phase: a quantified electromyographic study of 10 controls and 25 patients with chronic ankle instability. Acta Orthop Scand. 1995;66(6):517–523. doi: 10.3109/17453679509002306. [DOI] [PubMed] [Google Scholar]
- 13.Feger MA, Donovan L, Hart JM, Hertel J. Lower extremity muscle activation in patients with or without chronic ankle instability during walking. J Athl Train. 2015;50(4):350–357. doi: 10.4085/1062-6050-50.2.06. [DOI] [PMC free article] [PubMed] [Google Scholar]
- 14.Kautzky K, Feger MA, Hart JM, Hertel J. Surface electromyography variability measures during walking: effects of chronic ankle instability and prophylactic bracing. Athl Train Sports Health Care. 2015;7(1):14–22. [Google Scholar]
- 15.Koshino Y, Ishida T, Yamanaka M, et al. Kinematics and muscle activities of the lower limb during a side-cutting task in subjects with chronic ankle instability. Knee Surg Sports Traumatol Arthrosc. 2016;24(4):1071–1080. doi: 10.1007/s00167-015-3745-y. [DOI] [PubMed] [Google Scholar]
- 16.Wikstrom EA, Bishop MD, Inamdar AD, Hass CJ. Gait termination control strategies are altered in chronic ankle instability subjects. Med Sci Sports Exerc. 2010;42(1):197–205. doi: 10.1249/MSS.0b013e3181ad1e2f. [DOI] [PubMed] [Google Scholar]
- 17.Wikstrom EA, Hass CJ. Gait termination strategies differ between those with and without ankle instability. Clin Biomech (Bristol, Avon) 2012;27(6):619–624. doi: 10.1016/j.clinbiomech.2012.01.001. [DOI] [PubMed] [Google Scholar]
- 18.Hertel J. Sensorimotor deficits with ankle sprains and chronic ankle instability. Clin Sports Med. 2008;27(3):353–370. doi: 10.1016/j.csm.2008.03.006. [DOI] [PubMed] [Google Scholar]
- 19.Hass CJ, Bishop MD, Doidge D, Wikstrom EA. Chronic ankle instability alters central organization of movement. Am J Sports Med. 2010;38(4):829–834. doi: 10.1177/0363546509351562. [DOI] [PubMed] [Google Scholar]
- 20. Bastien M, Moffet H, Bouyer LJ, Perron M, Hebert LJ, Leblond J. Alteration in global motor strategy following lateral ankle sprain BMC Musculoskelet Disord 2014. 15 436. [DOI] [PMC free article] [PubMed] [Google Scholar]
- 21.Wikstrom EA, Hubbard TJ. Talar positional fault in persons with chronic ankle instability. Arch Phys Med Rehabil. 2010;91(8):1267–1271. doi: 10.1016/j.apmr.2010.04.022. [DOI] [PubMed] [Google Scholar]
- 22.Caputo AM, Lee JY, Spritzer CE, et al. In vivo kinematics of the tibiotalar joint after lateral ankle instability. Am J Sports Med. 2009;37(11):2241–2248. doi: 10.1177/0363546509337578. [DOI] [PMC free article] [PubMed] [Google Scholar]
- 23.Moisan G, Descarreaux M, Cantin V. Effects of chronic ankle instability on kinetics, kinematics and muscle activity during walking and running: a systematic review. Gait Posture. 2017;52:381–399. doi: 10.1016/j.gaitpost.2016.11.037. [DOI] [PubMed] [Google Scholar]
- 24.Liu K, Uygur M, Kaminski TW. Effect of ankle instability on gait parameters: a systematic review. Athl Train Sports Health Care. 2012;4(6):275–281. [Google Scholar]
- 25.Deschamps K, Dingenen B, Pans F, Van Bavel I, Matricali GA, Staes F. Effect of taping on foot kinematics in persons with chronic ankle instability. J Sci Med Sport. 2016;19(7):541–546. doi: 10.1016/j.jsams.2015.07.015. [DOI] [PubMed] [Google Scholar]
- 26.Donovan L, Feger MA. Relationship between ankle frontal plane kinematics during different functional tasks. Gait Posture. 2017;54:214–220. doi: 10.1016/j.gaitpost.2017.03.017. [DOI] [PubMed] [Google Scholar]
- 27.Wikstrom EA, Hubbard-Turner T, McKeon PO. Understanding and treating lateral ankle sprains and their consequences: a constraints-based approach. Sports Med. 2013;43(6):385–393. doi: 10.1007/s40279-013-0043-z. [DOI] [PubMed] [Google Scholar]
- 28.Gribble PA, Delahunt E, Bleakley C, et al. Selection criteria for patients with chronic ankle instability in controlled research: a position statement of the International Ankle Consortium. Br J Sports Med. 2014;48(13):1014–1018. doi: 10.1136/bjsports-2013-093175. [DOI] [PubMed] [Google Scholar]
- 29.Global strategy on diet, physical activity, and health: physical activity and adults. Recommended levels of physical activity for adults aged 18–64 years. World Health Organization Web site. 2019. https://www.who.int/dietphysicalactivity/factsheet_adults/en/. Accessed March 5.
- 30.Son SJ, Kim H, Seeley MK, Hopkins JT. Efficacy of sensory transcutaneous electrical nerve stimulation on perceived pain and gait patterns in individuals with experimental knee pain. Arch Phys Med Rehabil. 2017;98(1):25–35. doi: 10.1016/j.apmr.2016.05.022. [DOI] [PubMed] [Google Scholar]
- 31.Merletti R, Di Torino P. Standards for reporting EMG data. J Electromyogr Kinesiol. 1999;9(1):3–4. [Google Scholar]
- 32.Kim H, Son S, Seeley MK, Hopkins JT. Functional fatigue alters lower extremity neuromechanics during a forward-side jump. Int J Sports Med. 2015;36(14):1192–1200. doi: 10.1055/s-0035-1550050. [DOI] [PubMed] [Google Scholar]
- 33.Dempster WT. US Air Force Technical Report 55-159. Wright-Patterson Air Force Base, OH: US Air Force; 1955; 2019. Space Requirements of the Seated Operator: Geometrical, Kinematic, and Mechanical Aspects of the Body With Special Reference to the Limbs. http://www.dtic.mil/dtic/tr/fulltext/u2/087892.pdf. Accessed February 26. [Google Scholar]
- 34.Son SJ, Kim H, Seeley MK, Hopkins JT. Movement strategies among groups of chronic ankle instability, coper, and control. Med Sci Sports Exerc. 2017;49(8):1649–1661. doi: 10.1249/MSS.0000000000001255. [DOI] [PubMed] [Google Scholar]
- 35.Park J, Seeley MK, Francom D, Reese CS, Hopkins JT. Functional vs traditional analysis in biomechanical gait data: an alternative statistical approach. J Hum Kinet. 2017;60:39–49. doi: 10.1515/hukin-2017-0114. [DOI] [PMC free article] [PubMed] [Google Scholar]
- 36.Lin CF, Chen CY, Lin CW. Dynamic ankle control in athletes with ankle instability during sports maneuvers. Am J Sports Med. 2011;39(9):2007–2015. doi: 10.1177/0363546511406868. [DOI] [PubMed] [Google Scholar]
- 37.Morrison KE, Hudson DJ, Davis IS, et al. Plantar pressure during running in subjects with chronic ankle instability. Foot Ankle Int. 2010;31(11):994–1000. doi: 10.3113/FAI.2010.0994. [DOI] [PubMed] [Google Scholar]
- 38.Denning WM, Winward JG, Pardo MB, Hopkins JT, Seeley MK. Body weight independently affects articular cartilage catabolism. J Sports Sci Med. 2015;14(2):290–296. [PMC free article] [PubMed] [Google Scholar]
- 39.Calhoun JH, Li F, Ledbetter BR, Viegas SF. A comprehensive study of pressure distribution in the ankle joint with inversion and eversion. Foot Ankle Int. 1994;15(3):125–133. doi: 10.1177/107110079401500307. [DOI] [PubMed] [Google Scholar]
- 40.Hintermann B, Boss A, Schafer D. Arthroscopic findings in patients with chronic ankle instability. Am J Sports Med. 2002;30(3):402–409. doi: 10.1177/03635465020300031601. [DOI] [PubMed] [Google Scholar]
- 41.Harrington KD. Degenerative arthritis of the ankle secondary to long-standing lateral ligament instability. J Bone Joint Surg Am. 1979;61(3):354–361. [PubMed] [Google Scholar]
- 42.Grodzinsky AJ, Levenston ME, Jin M, Frank EH. Cartilage tissue remodeling in response to mechanical forces. Annu Rev Biomed Eng. 2000;2:691–713. doi: 10.1146/annurev.bioeng.2.1.691. [DOI] [PubMed] [Google Scholar]
- 43.Hubbard TJ, Kramer LC, Denegar CR, Hertel J. Contributing factors to chronic ankle instability. Foot Ankle Int. 2007;28(3):343–354. doi: 10.3113/FAI.2007.0343. [DOI] [PubMed] [Google Scholar]
- 44.Fox J, Docherty CL, Schrader J, Applegate T. Eccentric plantar-flexor torque deficits in participants with functional ankle instability. J Athl Train. 2008;43(1):51–54. doi: 10.4085/1062-6050-43.1.51. [DOI] [PMC free article] [PubMed] [Google Scholar]
- 45.Kim H, Son SJ, Seeley MK, Hopkins JT. Kinetic compensations due to chronic ankle instability during landing and jumping. Med Sci Sports Exerc. 2018;50(2):308–317. doi: 10.1249/MSS.0000000000001442. [DOI] [PubMed] [Google Scholar]
- 46.Drewes LK, McKeon PO, Kerrigan DC, Hertel J. Dorsiflexion deficit during jogging with chronic ankle instability. J Sci Med Sport. 2009;12(6):685–687. doi: 10.1016/j.jsams.2008.07.003. [DOI] [PubMed] [Google Scholar]
- 47.Delahunt E, Monaghan K, Caulfield B. Changes in lower limb kinematics, kinetics, and muscle activity in subjects with functional instability of the ankle joint during a single leg drop jump. J Orthop Res. 2006;24(10):1991–2000. doi: 10.1002/jor.20235. [DOI] [PubMed] [Google Scholar]
- 48.McKay GD, Goldie PA, Payne WR, Oakes BW. Ankle injuries in basketball: injury rate and risk factors. Br J Sports Med. 2001;35(2):103–108. doi: 10.1136/bjsm.35.2.103. [DOI] [PMC free article] [PubMed] [Google Scholar]
- 49.Friel K, McLean N, Myers C, Caceres M. Ipsilateral hip abductor weakness after inversion ankle sprain. J Athl Train. 2006;41(1):74–78. [PMC free article] [PubMed] [Google Scholar]
- 50.Nicholas JA, Strizak AM, Veras G. A study of thigh muscle weakness in different pathological states of the lower extremity. Am J Sports Med. 1976;4(6):241–248. doi: 10.1177/036354657600400602. [DOI] [PubMed] [Google Scholar]
- 51.MacKinnon CD, Winter DA. Control of whole body balance in the frontal plane during human walking. J Biomech. 1993;26(6):633–644. doi: 10.1016/0021-9290(93)90027-c. [DOI] [PubMed] [Google Scholar]


