Abstract
The WashU Epigenome Browser (https://epigenomegateway.wustl.edu/) provides visualization, integration and analysis tools for epigenomic datasets. Since 2010, it has provided the scientific community with data from large consortia including the Roadmap Epigenomics and the ENCODE projects. Recently, we refactored the codebase, redesigned the user interface, and developed various novel features. New features include: (i) visualization using virtual reality (VR), which has implications in biology education and the study of 3D chromatin structure; (ii) expanded public data hubs, including data from the 4DN, ENCODE, Roadmap Epigenomics, TaRGET, IHEC and TCGA consortia; (iii) a more responsive user interface; (iv) a history of interactions, which enables undo and redo; (v) a feature we call Live Browsing, which allows multiple users to collaborate remotely on the same session; (vi) the ability to visualize local tracks and data hubs. Amazon Web Services also hosts the redesign at https://epigenomegateway.org/.
INTRODUCTION
Genome browsers were originally developed as web-based displays to visualize the reference genome draft created by the Human Genome Project (1). Nowadays, they are an invaluable tool for genome research and are used to search, visualize, analyze and download specific genomic regions annotated with experimental data (2). The result is an integrated view of experimental data, which facilitates scientific interpretation of the genome.
The most successful and representative conventional genome browsers are the UCSC Genome Browser (3,4) and the Ensembl Browser (5,6). Our browser, The WashU Epigenome Browser (https://epigenomegateway.wustl.edu/), was invented in 2010 (7). We aim to develop general-purpose software with pioneering features; these include the new features described in this update. Past accomplishments include being the first to allow investigators to zoom and pan their view, rearrange tracks, and visualize and manipulate hundreds of genomic datasets. We have been the de facto gateway to data generated by the Roadmap Epigenomics Project (8), and we also host data from other large consortia such as ENCyclopedia Of DNA Elements (ENCODE) (9), International Human Epigenome Consortium (IHEC) (10), The Cancer Genome Atlas (TCGA) (11), Toxicant Exposures and Responses by Genomic and Epigenomic Regulators of Transcription (TaRGET) (12), and 4D Nucleome Project (4DN) (13). In addition, we host users’ custom tracks and data hubs upon request. Finally, users worldwide employ the Browser for their research, including ANISEED 2017 (14), the 3D Genome Browser (15), epilogos (https://epilogos.altiusinstitute.org), Cistrome Data Browser (16), among many others.
The WashU Epigenome Browser has undergone rapid development both conceptually and in software and IT infrastructure since its creation, and it has built a large user base (see Supplementary Table S1 for access statistics). Importantly, in addition to maintaining data, functionality and infrastructure, we strive to engage with the genomics community, and we place major emphasis on developing visualization solutions to meet the emerging needs that accompany rapidly evolving genomic technology. For example, we introduced functions to explore long-range chromatin interaction data (11); deployed a much more expressive data track for visualizing and analyzing whole genome bisulfite data (12); and developed a novel concept called the Data Hub Cluster to host, organize and display over 20 000 datasets produced by the Roadmap, ENCODE and mouse ENCODE consortia and to use these data to annotate genetic variants associated with complex traits (17).
With this retrospective in mind, we now summarize and provide an outlook for the new iteration of the WashU Epigenome Browser. The evolution and maturation of web technologies bring invaluable opportunities to improve user productivity. The major update from the past 2 years’ effort is a newly designed and streamlined codebase using the latest web technologies. We use React.js (https://reactjs.org) to increase the maintainability of the codebase. The application programming interface (API) is now based on a serverless architecture, which eliminates the need for users to compile from source during installation. Hosting on Amazon Cloud should now increase uptime and reliability. Local track capabilities have been enhanced: users may now read larger files in more formats, without having to host files on a remote server. Local track files can also be organized into a local data hub allowing customization of track settings. Our new Live Browsing feature allows multiple users to interact remotely with the same visualization, greatly facilitating collaboration. Finally, as far as we know, we are the first to integrate virtual reality in a genome browser.
NEW FEATURES
Redesigned code architecture
We have rewritten the codebase with a new software architecture and the latest web technology. The new architecture splits the UI into modular parts that manage tasks independently (Figure 1). From the developer’s perspective, the benefits are numerous. Innovation becomes much more rapid and less error-prone because making new features only requires modification of one part of the code instead of many. In the future, this architecture could easily incorporate an extension system that can load new features dynamically, much like Google Chrome’s extension system. We envision bioinformaticians developing and sharing extensions, which would enable an unprecedented level of personalization and increase the likelihood of important discoveries.
Figure 1.
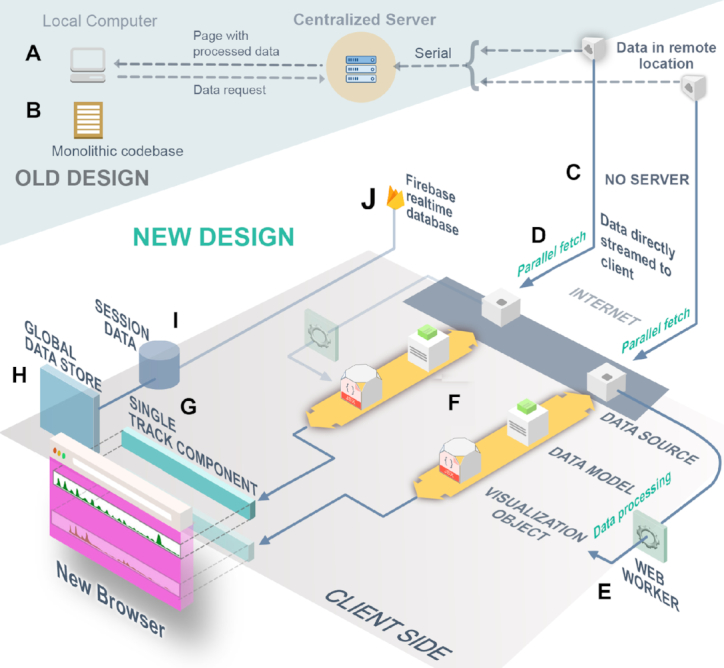
Component-based design of the new software architecture. The area with a darker background (A and B) represents the old design; the rest (C–J) represents the new design. (A) In the old design, a centralized server retrieves data from a remote location, processes it and sends it to the user. This creates a bottleneck, as data processing for all users must happen on the server. (B) Our old codebase lacked encapsulation of functions and organization, making it extremely difficult to maintain. (C) In the new design, clients directly request data from where it is stored, eliminating the bottleneck that (A) describes. (D) Data are fetched in parallel, boosting performance. (E) Data processing, which used to happen on the central server, instead runs on worker threads on the client’s machine. This adds parallelization and improves the software’s responsiveness. (F) Each step of the data pipeline is a separate module in our codebase, which improves organization and reduces bugs. (G) Track components or visualizers are also separated into modules. (H) A global data store orchestrates information sharing between components and powers features like Undo/Redo and history. (I) Local session storage mirrors the global data store and ensures that no work is lost if there is a crash or if the user reloads the page. (J) When a Live session is established, session data are synced with Firebase. When any device updates Firebase, the changes are pushed to the global data store (H), which updates the visualization components.
Developers are not the only ones who saw benefits. As a result of the code rewrite, users saw a variety of performance and stability improvements. In the previous version, if one track had a bug or failed to fetch data, it could cause the other tracks to fail too, resulting in lost work. Now, issues in one track will not affect other tracks, and users can attempt a reload without losing work. In addition, we have incorporated multithreading (web workers), which significantly improves performance.
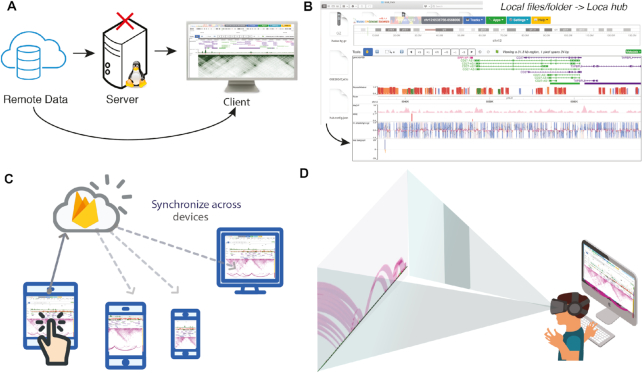
A serverless architecture, or the absence of a centralized backend server to deliver basic features, also improves performance (Figure 2A). This resolves slowdown caused by bursts of concurrent users, as there is no backend server bottleneck. In addition, anyone who wants to control and customize their own version of the Browser can now do so without needing to set up and maintain a backend infrastructure.
Figure 2.
A sample of the new features. (A) Serverless design. Clients directly request data from where it is stored, eliminating the bottleneck of a server. (B) Local folders or files can now be organized into a local data hub. Local files help protect data privacy and load faster than files hosted on remote servers. (C) Live Browsing can synchronize the same view across multiple computers, simplifying collaboration. (D) Virtual Reality prototype. The current prototype can visualize chromatin interactions and numerical tracks in 3D space for viewing with a VR headset.
New functions
Local tracks and data hubs
We realized that not every research group can set up a web server to host track files, although we host track files upon request. To simplify this process, tracks can now read data from local files. The user may upload individual files or entire folders grouped as a data hub (Figure 2B, also see Supplementary Data for user’s guide). Local tracks and data hubs avoid network traffic and usually load faster than tracks hosted remotely. This feature is crucial for researchers who wish to ensure data security, especially for clinical data where patient privacy must be carefully protected.
Undo, redo and history of operations
Sometimes, a user might accidentally delete or misconfigure a track, or go to an undesired region; users may now revert these operations by using the new Undo/Redo/History toolset. Undo and Redo are self-explanatory. The History tool shows a list of recent operations. By clicking on an operation, the software’s state is set to what it was immediately after the operation was performed. The new ‘Undo/Redo/History’ functions are mechanistically different from the ‘save session’ function. These functions enable an easier and more flexible navigation and viewing experience. To our knowledge, no other mainstream genome browsers have this feature. There is a video tutorial on YouTube to demonstrate this feature: https://youtu.be/RCYFCoRtdm4.
Live browsing
Investigators in different places can now interact and annotate collaboratively in the same fashion as a Google Doc (Figure 2C). We call this collaborative mode Live Browsing. Live Browsing synchronizes the user’s view to Firebase (https://firebase.google.com/), a real-time database developed by Google (Figure 1J). When this feature is enabled, the software generates a ‘Live’ URL, which, when shared, enables others to see and operate in the same view in real-time. Operations such as jumping to a new region and editing tracks are synchronized for all users with the same URL. This feature, which to our knowledge is unique among genome browsers, can facilitate a new level of communication and sharing among investigators. A video demo of this feature can be found on YouTube: https://youtu.be/nBKkz0ION4Y.
VR integration
Virtual Reality (VR) provides not only a more immersive viewing experience, but also a more intuitive one. Instead of viewing the genome from a distance, users can ‘walk’ inside the genome. Currently, numerical and long-range chromatin interaction tracks are supported in VR mode (Figure 2D, also see Supplementary Data for a VR mode guide). A demo can be found on YouTube: https://youtu.be/t_6OJCdM1iI. In the video, one H3K4me3 (green), one ATAC-seq (red) and one HiC track (purple) are displayed. Note that the HiC track straddles the numerical tracks, which allows the interaction arcs to be adjacent to all the tracks at the same time, which is impossible in 2D mode.
As is common with emerging technology, the current VR implementation admittedly has limitations. VR mode requires a powerful computer to run, and the traditional 2D view is still more appropriate for most use cases. Nonetheless, we see important contributions. It represents an outreach tool that can better attract the interest of non-biologists, especially educators and younger audiences. In addition, it represents a good starting point for visualizations that can answer more biological questions, especially once we incorporate 3D models of chromatin structure.
Easier installation and better documentation
The new code architecture greatly simplifies installation of personal Browser mirrors. A typical setup now takes fewer than 5 min—users only need to install Node.js (https://nodejs.org/) and run a few terminal commands. Since Node runs on MacOS, Windows and Linux, nearly any computer can run the Browser. We have also prepared a Docker image available at https://cloud.docker.com/repository/docker/epgg/eg-react for users to launch a personal mirror easily. Additionally, we have written detailed documentation, which is hosted at https://epigenomegateway.readthedocs.io. This includes guides on general use, track formats, building a data hub, installation and more. We will continue to update the documentation site whenever we add a new feature or dataset, or upon users’ feedback.
New user interface
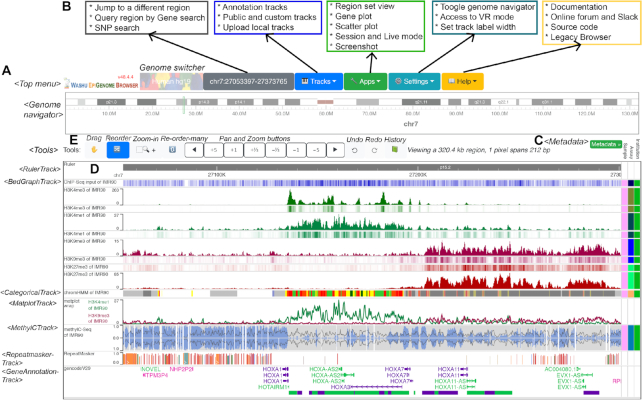
We have redesigned the user interface, as shown in Figure 3. The current user interface contains three main components: menus, chromosome ideogram and a container for track display. The top menus allow users to switch genome assembly; query genes, SNPs (by using the Ensembl REST API (18)) and specific genomic locations; manage tracks and data hubs; manage sessions; and access a suite of tools including region/gene set view, gene plot, scatter plot and a publication-quality figure generator. The Help menu allows users to access documentation, get help from the online forum and Slack channel and access our legacy Browser. The chromosome ideogram displays an overview of the current chromosome; the ideogram highlights the currently displayed region and allows users to select and jump to a new region.
Figure 3.
Guide to the new UI. This screenshot illustrates default tracks loaded from the Roadmap GEO public hub after adjusting track order and heights to display heat maps. (A) UI elements are modular components in the codebase; the left column indicates the names of these components. (B) Functions for each menu item. (C) The right column contains the metadata management interface and metadata colormap. Each unique color represents a metadata value, such as pink meaning IMR90. The metadata column is customizable and provides a way to select adjacent tracks that share the same metadata values. (D) The main visualization displays the HOXA gene cluster. From top to bottom: a genome ruler track, histone modification tracks, a chromatin state (chromHMM) track, a matplot track, whole genome bisulfite sequencing data in a ‘methyl’ track, a Repeatmasker track and a Gencode version 29 gene track. (E) From left to right: four toggleable tools that change how the mouse behaves, which include dragging, zooming and reordering tracks; a set of pan and zoom buttons; and the Undo, Redo and History tools.
Below the chromosome ideogram are the genomic tracks. Each track is a separate component whose behavior is dependent on track type. The metadata colormap is located to the right of the tracks, and can be used to label, sort and organize genomic tracks according to their metadata (Figure 3C). The main track navigation features are organized into tools that support dragging, reordering tracks, and zoom and pan. The ‘re-order many’ tool simplifies the reordering of many tracks and reduces the need to drag tracks long distances. Users can also switch tools using keyboard shortcuts; a list of such operations is provided in Supplementary Table S2. To the right of the tools, a set of zoom and pan buttons is provided. Finally, the Undo, Redo and History function buttons are located to the right of the zoom and pan buttons (Figure 3E).
Data collection
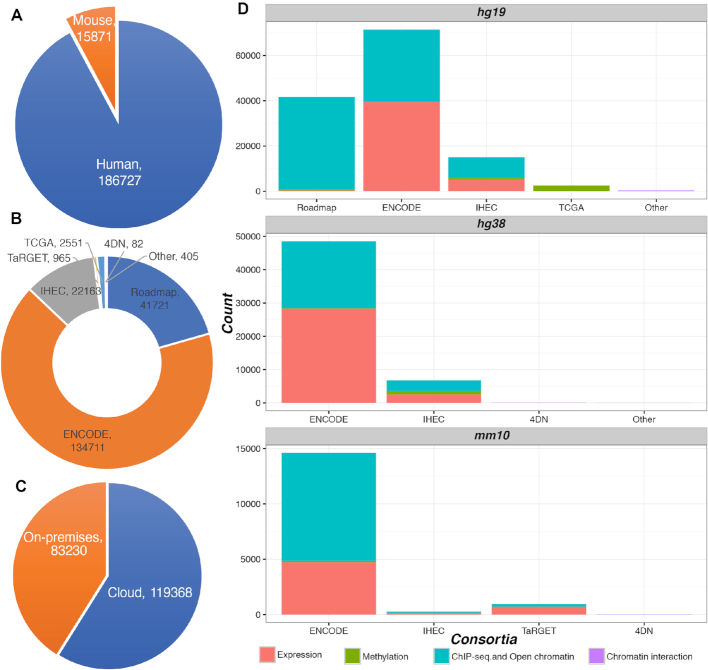
The Browser now integrates data from the 4DN, ENCODE, Roadmap, IHEC, TCGA and TaRGET consortia. In all, we host 202 598 tracks for human and mouse genomes (Figure 4). More than half of these tracks are provided by their respective consortium and are accessed remotely. Tracks are annotated using the metadata provided by each consortium and are by default grouped by the sample and assay categories. The metadata structure allows users to search for desired tracks by using the metadata. We support most data formats, including bigWig, bigBed and BAM. For chromatin interaction data formats, we support most formats invented so far: hic by Juicebox (19), cool by HiGlass (20), bigInteract by UCSC and longrange by WashU. Supplementary Table S3 lists the current supported track types and formats.
Figure 4.
Statistics of tracks hosted by the WashU Epigenome Browser. (A) Statistics on the number of human and mouse tracks. (B) Tracks grouped by consortia. (C) Hosting location of tracks. More than half of the tracks are hosted on the cloud, with each consortium’s data portal providing access. We host the remainder on our own servers (‘on-premises’). (D) Track statistics for three genome assemblies, grouped by consortia. Tracks are categorized by experiment type, including expression, methylation, ChIP-seq & open chromatin and chromatin interaction.
Use cases
Visualizing and analyzing cell type-specific JunD binding over transposable elements (TEs)
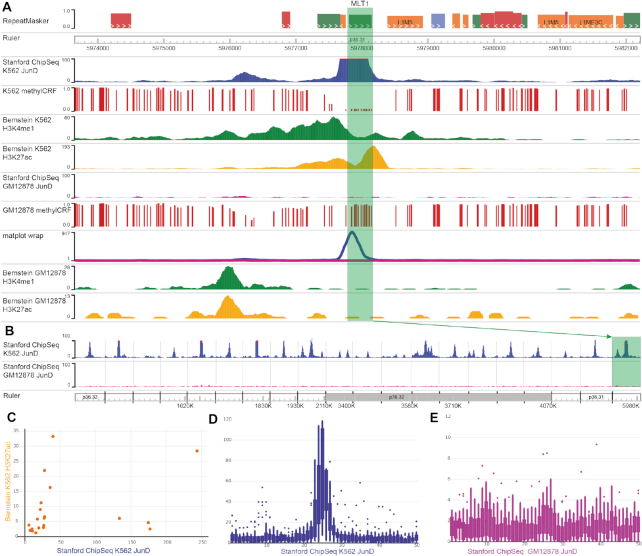
In this use case, we use ENCODE datasets to analyze the cell type specificity of the interaction between transcription factor JunD and specific TEs. We first load JunD ChIP-seq and DNA methylation data from GM12878 and K562 cells, which was produced by ENCODE (21). We then navigate to chr1:5929104–6030354, where the transposable element MLT1 lies. We can clearly see a peak representing a JunD-binding site in K562, but not in GM12878 (Figure 5A). The Matplot function, which merges numerical tracks, can confirm this peak was specific to K562 cells (Figure 5A, the ‘matplot wrap’ track). Next, we use Region Set View to simultaneously visualize 20 such TEs, and observe a common pattern of K562-specific JunD binding (Figure 5B). Next, we apply the Scatter Plot function to examine the correlation between JunD ChIP-seq signal and signal of H3K27Ac over these 20 TEs (Figure 5C). Finally, we use Gene Plot to generate a boxplot representing average ChIP-seq signals in the 2.5 kb regions surrounding the TEs (Figure 5D and E, respectively). These plots provided a consistent view supporting the hypothesis that the selected TEs were K562 cell type-specific enhancers bound by JunD. These summary graphs can be downloaded as SVG files for making publication-quality figures. Details of this workflow are in User Guide 1 as part of the Supplementary Data.
Figure 5.
Cell type-specific analysis and visualization of JunD binding on transposable elements (TEs), demonstrated in the new Browser. (A) A JunD-binding peak on an MLT1 transposable element, highlighted in green. methylCRF tracks show the predicted methylation level of CpG sites, where 0 means fully unmethylated, and 1 means fully methylated. (B) A region set view of 20 TEs shows the binding happens specifically on TE elements in the K562 sample. MLT1 is the rightmost region. (C) Scatter plot shows the relationship between mean signals for K562 H3K27ac (y-axis) and K562 JunD ChIP-seq (x-axis) in the 20 TEs. Each dot represents a TE and its flanking region. (D and E) Box plots of GM12878 (D) and K562 (E) samples indicate the average signal from 20 TEs and the regions flanking them. Each region is split into 50 bins (hence the x-axis ranges from 0 to 50), and is displayed from 5′ to 3′.
Chromatin domain analysis and visualization
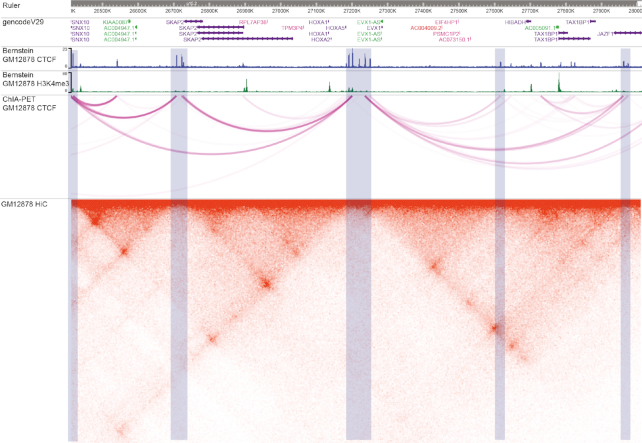
Higher order chromatin interactions describe the complex packaging and folding of DNA in 3D space. DNA folding can place important genomic features such as enhancers and promoters in close physical proximity, where they can interact. In addition, folding takes place at multiple levels, from simple loops to topologically associating domains (TADs). Chromatin conformation capture techniques, such as HiC (22) and ChIA-PET (Chromatin Interaction Analysis by Paired End Sequencing), can measure these complex structures (23). In this use case, we illustrate how to visualize and compare chromatin interactions assayed by different technologies. We load HiC, ChiA-PET, CTCF and H3K4me3 ChIP-seq tracks. By configuring the HiC track using specific parameters including the normalization vector, resolution (bin size) and score scale, we can clearly visualize the genome’s loops and TADs. Light blue regions indicate CTCF peaks, which correlate with ChIA-PET anchors and HiC domain boundaries (Figure 6). Details of this workflow are in User Guide 2 as a part of the Supplementary Data.
Figure 6.
Chromatin domain analysis and visualization of GM12878 cells, demonstrated in the new Browser. The tracks from top to bottom are a genome ruler, GencodeV29 gene annotations, and CTCF ChIP-seq, H3K4me3, ChIA-PET and HiC data from GM12878 cells. Light blue highlighted regions indicate CTCF peaks, correlated with ChIA-PET anchors and HiC domain boundaries.
OUTLOOK
While we have added many new features, not all features from the old version have been ported. Since many users are used to the old look and feel, we will also provide support for the old version at http://epigenomegateway.wustl.edu/legacy/. However, only the current version will see major updates and new releases in the future. Future work will include enhancing the VR functions, such as visualizing and interacting with a 3D model of predicted chromatin structure and ensuring compatibility with the latest data that biologists generate. As genome technology and visualization techniques mature, we anticipate continued evolution of the genome-browsing experience.
DATA AVAILABILITY
The WashU Epigenome Browser is accessible from https://epigenomegateway.wustl.edu/ as well as from https://epigenomegateway.org/ that is hosted on Amazon Cloud services. Both HTTP and HTTPS protocol are supported. The WashU Epigenome Browser is an open-source collaborative initiative, and is available on GitHub (https://github.com/lidaof/eg-react).
Supplementary Material
ACKNOWLEDGEMENTS
We would like to thank the IGV team for the hic-straw library, and GMOD team for the bbi-js library. We thank the HiGlass team for providing the Cool track API. We also thank the system admins from the ENCODE, IHEC and 4DN projects for enabling CORS access to the track files hosted at each project’s data portal. Finally, we thank the three anonymous reviewers whose comments and suggestions helped improve this manuscript.
Notes
Present address: Silas Hsu, Siebel Center for Computer Science, Department of Computer Science, University of Illinois, 201 North Goodwin Avenue, Urbana, IL 61801, USA.
SUPPLEMENTARY DATA
Supplementary Data are available at NAR Online.
FUNDING
NIH [R01HG007354, R01HG007175, R01ES024992, U01CA200060, U24ES026699, U01HG009391]; American Cancer Society [RSG-14-049-01-DMC]. Funding for open access charge: NIH [R01HG007354, R01HG007175, R01ES024992, U01CA200060, U24ES026699, U01HG009391]; American Cancer Society [RSG-14-049-01-DMC].
Conflict of interest statement. None declared.
REFERENCES
- 1. Lander E.S., Linton L.M., Birren B., Nusbaum C., Zody M.C., Baldwin J., Devon K., Dewar K., Doyle M., FitzHugh W. et al.. Initial sequencing and analysis of the human genome. Nature. 2001; 409:860–921. [DOI] [PubMed] [Google Scholar]
- 2. Nielsen C.B., Cantor M., Dubchak I., Gordon D., Wang T.. Visualizing genomes: techniques and challenges. Nat. Methods. 2010; 7:S5–S15. [DOI] [PubMed] [Google Scholar]
- 3. Kent W.J., Sugnet C.W., Furey T.S., Roskin K.M., Pringle T.H., Zahler A.M., Haussler D.. The human genome browser at UCSC. Genome Res. 2002; 12:996–1006. [DOI] [PMC free article] [PubMed] [Google Scholar]
- 4. Casper J., Zweig A.S., Villarreal C., Tyner C., Speir M.L., Rosenbloom K.R., Raney B.J., Lee C.M., Lee B.T., Karolchik D. et al.. The UCSC Genome Browser database: 2018 update. Nucleic Acids Res. 2018; 46:D762–D769. [DOI] [PMC free article] [PubMed] [Google Scholar]
- 5. Spudich G., Fernandez-Suarez X.M., Birney E.. Genome browsing with Ensembl: a practical overview. Brief. Funct. Genomic Proteomic. 2007; 6:202–219. [DOI] [PubMed] [Google Scholar]
- 6. Zerbino D.R., Achuthan P., Akanni W., Amode M.R., Barrell D., Bhai J., Billis K., Cummins C., Gall A., Giron C.G. et al.. Ensembl 2018. Nucleic Acids Res. 2018; 46:D754–D761. [DOI] [PMC free article] [PubMed] [Google Scholar]
- 7. Zhou X., Maricque B., Xie M., Li D., Sundaram V., Martin E.A., Koebbe B.C., Nielsen C., Hirst M., Farnham P. et al.. The Human Epigenome Browser at Washington University. Nat. Methods. 2011; 8:989–990. [DOI] [PMC free article] [PubMed] [Google Scholar]
- 8. Roadmap Epigenomics C., Kundaje A., Meuleman W., Ernst J., Bilenky M., Yen A., Heravi-Moussavi A., Kheradpour P., Zhang Z., Wang J. et al.. Integrative analysis of 111 reference human epigenomes. Nature. 2015; 518:317–330. [DOI] [PMC free article] [PubMed] [Google Scholar]
- 9. Consortium, E.P. An integrated encyclopedia of DNA elements in the human genome. Nature. 2012; 489:57–74. [DOI] [PMC free article] [PubMed] [Google Scholar]
- 10. Bujold D., Morais D.A.L., Gauthier C., Cote C., Caron M., Kwan T., Chen K.C., Laperle J., Markovits A.N., Pastinen T. et al.. The international human epigenome consortium data portal. Cell Syst. 2016; 3:496–499. [DOI] [PubMed] [Google Scholar]
- 11. Hutter C., Zenklusen J.C.. The cancer genome Atlas: Creating lasting value beyond its data. Cell. 2018; 173:283–285. [DOI] [PubMed] [Google Scholar]
- 12. Wang T., Pehrsson E.C., Purushotham D., Li D., Zhuo X., Zhang B., Lawson H.A., Province M.A., Krapp C., Lan Y. et al.. The NIEHS TaRGET II Consortium and environmental epigenomics. Nat. Biotechnol. 2018; 36:225–227. [DOI] [PMC free article] [PubMed] [Google Scholar]
- 13. Dekker J., Belmont A.S., Guttman M., Leshyk V.O., Lis J.T., Lomvardas S., Mirny L.A., O'Shea C.C., Park P.J., Ren B. et al.. The 4D nucleome project. Nature. 2017; 549:219–226. [DOI] [PMC free article] [PubMed] [Google Scholar]
- 14. Brozovic M., Dantec C., Dardaillon J., Dauga D., Faure E., Gineste M., Louis A., Naville M., Nitta K.R., Piette J. et al.. ANISEED 2017: extending the integrated ascidian database to the exploration and evolutionary comparison of genome-scale datasets. Nucleic Acids Res. 2018; 46:D718–D725. [DOI] [PMC free article] [PubMed] [Google Scholar]
- 15. Wang Y., Song F., Zhang B., Zhang L., Xu J., Kuang D., Li D., Choudhary M.N.K., Li Y., Hu M. et al.. The 3D Genome Browser: a web-based browser for visualizing 3D genome organization and long-range chromatin interactions. Genome Biol. 2018; 19:151. [DOI] [PMC free article] [PubMed] [Google Scholar]
- 16. Mei S., Qin Q., Wu Q., Sun H., Zheng R., Zang C., Zhu M., Wu J., Shi X., Taing L. et al.. Cistrome Data Browser: a data portal for ChIP-Seq and chromatin accessibility data in human and mouse. Nucleic Acids Res. 2017; 45:D658–D662. [DOI] [PMC free article] [PubMed] [Google Scholar]
- 17. Zhou X., Li D., Zhang B., Lowdon R.F., Rockweiler N.B., Sears R.L., Madden P.A., Smirnov I., Costello J.F., Wang T.. Epigenomic annotation of genetic variants using the Roadmap Epigenome Browser. Nat. Biotechnol. 2015; 33:345–346. [DOI] [PMC free article] [PubMed] [Google Scholar]
- 18. Yates A., Beal K., Keenan S., McLaren W., Pignatelli M., Ritchie G.R., Ruffier M., Taylor K., Vullo A., Flicek P.. The Ensembl REST API: Ensembl data for any language. Bioinformatics. 2015; 31:143–145. [DOI] [PMC free article] [PubMed] [Google Scholar]
- 19. Robinson J.T., Turner D., Durand N.C., Thorvaldsdottir H., Mesirov J.P., Aiden E.L.. Juicebox.js provides a Cloud-Based visualization system for Hi-C data. Cell Syst. 2018; 6:256–258. [DOI] [PMC free article] [PubMed] [Google Scholar]
- 20. Kerpedjiev P., Abdennur N., Lekschas F., McCallum C., Dinkla K., Strobelt H., Luber J.M., Ouellette S.B., Azhir A., Kumar N. et al.. HiGlass: web-based visual exploration and analysis of genome interaction maps. Genome Biol. 2018; 19:125. [DOI] [PMC free article] [PubMed] [Google Scholar]
- 21. Sundaram V., Cheng Y., Ma Z., Li D., Xing X., Edge P., Snyder M.P., Wang T.. Widespread contribution of transposable elements to the innovation of gene regulatory networks. Genome Res. 2014; 24:1963–1976. [DOI] [PMC free article] [PubMed] [Google Scholar]
- 22. Belton J.M., McCord R.P., Gibcus J.H., Naumova N., Zhan Y., Dekker J.. Hi-C: a comprehensive technique to capture the conformation of genomes. Methods. 2012; 58:268–276. [DOI] [PMC free article] [PubMed] [Google Scholar]
- 23. Li G., Fullwood M.J., Xu H., Mulawadi F.H., Velkov S., Vega V., Ariyaratne P.N., Mohamed Y.B., Ooi H.S., Tennakoon C. et al.. ChIA-PET tool for comprehensive chromatin interaction analysis with paired-end tag sequencing. Genome Biol. 2010; 11:R22. [DOI] [PMC free article] [PubMed] [Google Scholar]
Associated Data
This section collects any data citations, data availability statements, or supplementary materials included in this article.
Supplementary Materials
Data Availability Statement
The WashU Epigenome Browser is accessible from https://epigenomegateway.wustl.edu/ as well as from https://epigenomegateway.org/ that is hosted on Amazon Cloud services. Both HTTP and HTTPS protocol are supported. The WashU Epigenome Browser is an open-source collaborative initiative, and is available on GitHub (https://github.com/lidaof/eg-react).


