


Abstract
High-throughput experiments produce increasingly large datasets that are difficult to analyze and integrate. While most data integration approaches focus on aligning metadata, data integration can be achieved by abstracting experimental results into gene sets. Such gene sets can be made available for reuse through gene set enrichment analysis tools such as Enrichr. Enrichr currently only supports gene sets compiled from human and mouse, limiting accessibility for investigators that study other model organisms. modEnrichr is an expansion of Enrichr for four model organisms: fish, fly, worm and yeast. The gene set libraries within FishEnrichr, FlyEnrichr, WormEnrichr and YeastEnrichr are created from the Gene Ontology, mRNA expression profiles, GeneRIF, pathway databases, protein domain databases and other organism-specific resources. Additionally, libraries were created by predicting gene function from RNA-seq co-expression data processed uniformly from the gene expression omnibus for each organism. The modEnrichr suite of tools provides the ability to convert gene lists across species using an ortholog conversion tool that automatically detects the species. For complex analyses, modEnrichr provides API access that enables submitting batch queries. In summary, modEnrichr leverages existing model organism databases and other resources to facilitate comprehensive hypothesis generation through data integration.
INTRODUCTION
Gene set enrichment analysis is a leading computational method for placing newly acquired high content data in the context of prior biological knowledge (1). Gene set enrichment analysis tools such as DAVID (2), GenePattern (3), WebGestalt (4), AmiGO (5), Babelomics (6), GeneVestigator (7), GOEAST (8), Panther (9) and Enrichr (10,11) have been widely used, demonstrating the utility and relevance of this approach for many diverse studies. While most of these enrichment analysis tools are specific for mammalian organisms, some also support model organisms. The tools that support enrichment analyses in model organisms include, for example, AmiGO (5), DAVID (2), g-Profiler (12), KOBAS (13), LRpath (14), Lynx (15), modPhEA (16), STRING (17), ToppFun (18), WebGestalt (4) and WormBase (19). All these digital resources provide web-based organism-specific enrichment analyses, which offer users various interactive features, gene set libraries and visualizations of results (Table 1).
Table 1.
Summary of model organism web-based enrichment analysis tools
| Library categories | Results format | ||||||||||||||
|---|---|---|---|---|---|---|---|---|---|---|---|---|---|---|---|
| Tool | Interactive | Unique result URL | API | Ortholog conversion | User background upload | Model organisms | Libraries | Diseases | Ontologies | Pathways | Text-mining | Transcription | Bar graph | Plot | Table |
| AmiGO | + | + | 104 | 9 | + | + | |||||||||
| DAVID | + | + | + | 65 000 | 68 | + | + | + | + | + | + | + | |||
| g:Profiler | + | + | + | + | + | 467 | 12 | + | + | + | + | + | + | ||
| KOBAS | + | + | + | 7 | 9 | + | + | + | + | ||||||
| LRpath | + | + | 7 | 16 | + | + | + | + | + | + | + | ||||
| Lynx | + | + | + | 1 | 16 | + | + | + | + | + | + | ||||
| modEnrichr | + | + | + | + | 6 | 260 | + | + | + | + | + | + | + | ||
| modPhEA | + | + | + | 6 | 6 | + | + | + | |||||||
| STRING | + | + | + | 5090 | 11 | + | + | + | + | + | + | ||||
| ToppFun | + | + | + | 1 | 99 | + | + | + | + | + | + | + | |||
| WebGestalt | + | + | 12 | 192 | + | + | + | + | + | + | + | ||||
| WormBase | + | 1 | 3 | + | + | + | |||||||||
Most model organism-focused enrichment tools cover a limited set of resources that are primarily based on literature curation, i.e. either from pathway databases such as KEGG (20) and WikiPathways (21), protein databases such as InterPro (22) and Pfam (23), or from the Gene Ontology (24). However, there are other sources and resources that can be organized into gene set libraries for model organisms. These include gene expression signatures from transcriptomics and proteomics studies, gene sets created from protein interaction databases, gene sets generated from resources such as the gene reference into function (GeneRIF) (25), and gene sets generated from gene-PubMed ID (PMID) associations determined using Tagger (26), a named entity recognition (NER) application. In general, sources for non-mammalian model organism gene sets are sparser compared to those available for human and mouse. Hence, model organism researchers would benefit from querying gene set libraries created by applying gene-function prediction algorithms. Gene function predictions based on co-expression, co-regulation, or co-occurrence in publications, and predictions made via data integration have been extensively applied (27–31). However, gene function predictions have not been widely utilized to produce collections of gene set libraries for gene set enrichment analyses.
modEnrichr is an extension of Enrichr (10,11) for fish, fly, worm, and yeast. The web server already contains an extensive collection of over 100 000 annotated gene sets. These gene sets are derived from literature-based resources such the Gene Ontology (GO), GeneRIF, text-mining using Tagger, and pathway databases, as well as other data from various omics resources (10,11). To expand the collection of annotated libraries, systematic automated predictions of gene function were employed with uniformly processed RNA-seq co-expression data from GEO for each of the four organisms (32).
MATERIALS AND METHODS
Data processing to create the modEnrichr gene-set libraries
Libraries created from the Gene Ontology
The Gene Ontology libraries were constructed using organism-specific annotations, excluding associations with an Inferred from Electronic Annotation (IEA) evidence code. GO terms were divided into three gene set libraries: Biological Process (BP), Molecular Function (MF) and Cellular Component (CC). The go-basic.obo graph was used to assign depth to terms, and only terms with a depth greater than three were added to the library. Genes associated with a term are also assigned to parent terms up to a depth of four. At last, only genes that are protein-coding are included in the gene sets. Terms with less than five genes were excluded.
Libraries created from Wikipathways
Wikipathways (v. 20180610d) data for each species was used to construct Wikipathways libraries where each term is a pathway PathwayName_WPID. Terms with less than five genes were excluded.
Libraries created from KEGG
To generate the KEGG pathway libraries, we retrieved genes to pathways mappings for each model organism from the KEGG database data using the Biopython (33) package and filtered out pathways with less than five genes.
Libraries created from Pfam and Interpro
To generate the Pfam and Interpro libraries, we retrieved genes associated with each protein domain within each database and filtered out domains with less than five genes.
Libraries created from TF2DNA
Transcription factors-gene associations were ranked by their P-values as provided by TF2DNA, and the gene sets were limited to genes with P-values lower or equal to the P-value of the 2000th ranked gene. TF2DNA libraries have terms with the form TF_PMID, where the TF is the transcription factor, and PMID is a reference to the paper that describes the association. Terms with >2999 or less than five genes were excluded.
Libraries created from BioGRID
Protein–protein interactions (PPI) for each organism were divided by the ‘Experimental System Type’ flag, which has the values ‘physical’ and ‘genetic’. Only physical interactions were used to build the PPI hubs libraries while genetic interactions were used to build the Genetic Interactions hubs libraries. All interactions were considered as bidirectional. For WormEnrichr, hubs were considered to be genes with at least five interactors and outliers with greater than 175 interactors were excluded. For YeastEnrichr, hubs were considered to be genes with at least fifty interactors and outliers with >1000 interactors were excluded.
Libraries created from WormBase
Ontologies from the WormBase WB266 release were used to build four libraries. Anatomic associations were limited to ‘Certain.’ The anatomy_ontology.WS266.obo was used to determine the level of an anatomic term, and the ‘is_a’ relation was used to propagate a gene up the tree to the parent terms. Disease terms were converted using disease_ontology.WS266.obo. Phenotype terms were converted using phenotype_ontology.WS266.obo. For all libraries, terms with less than five genes were excluded.
Libraries created from DroID
miRNA–gene and transcription factor-gene libraries were generated using data from the Drosophila Interactions Database (DroID) version 2015_12. The Courage, Finley, and Hybrigenics PPI libraries were generated using data from yeast-two-hybrid screens from DroID version 2017_08. To determine hubs for the PPI library, a PPI network was constructed using all interactions appearing in at least one of the three screens. Hubs were determined to be proteins which directly interacted with at least 17 other proteins, representing the 10% of all proteins. These are the most connected proteins. The hubs were used as terms, and their interactors identified in any of the three screens made up the gene sets.
Libraries created from GenomeRNAi
The RNAi screen library was generated using data from GenomeRNAi version 17. Each gene set represent hits from a specific screen.
Libraries created from FlyBase
The following libraries were generated from FlyBase version 2017_05: (i) The allele phenotypes library represents fly phenotypes and sets of genes with alleles (of any kind) associated with a phenotype. The library was created by processing the data from the file allele_phenotypic_data_fb_2017_05.tsv; (ii) The allele LoF phenotypes library was created in the same way as (i), but only includes genes in which null, or hypomorphic, alleles produce the phenotype; (iii) The human disease library represents fly models of human disease, and sets of genes that have been modified to produce those models. The library was created using the file allele_human_disease_model_data_fb_2017_05.tsv from FlyBase. For all FlyBase gene set libraries, a minimum gene set length of five was required for a gene set to be included in any library. To remove gene synonyms from the fly libraries, gene symbols were converted to the most current symbol accepted by FlyBase using the file fb_synonym_fb_2017_05.tsv. Greek letters appearing in gene symbols were converted to their corresponding English spelling, for example, ‘alpha’.
Automatically generated libraries with GeneRIF and AutoRIF
To automatically add libraries to modEnrichr, lists of anatomical parts, phenotypes, GO biological processes, GO molecular functions, and GO cellular components were generated for each organism using the obo ontology files, and text files from YeastGenome (34) and ZFIN (35). For each term, we queried PubMed and extracted all the PMIDs. If more that 10 000 PMIDs were returned, the top 10 000 most recent results were obtained. Using GeneRIF (25) or AutoRIF, we converted PubMed IDs associated with each term to gene symbols. For each organism, an AutoRIF file associating PMIDs to genes was created. This was accomplished by first downloading organism-specific Ensembl ID—PMID association data from the Jensen Lab website (https://jensenlab.org/). These associations were generated using Tagger (26). Protein IDs were converted to gene symbols for each organism using the STRING v10.x version_mapping files, and STRING display names files, for each organism. These files were downloaded from the STRING database (17). Protein IDs that could not be converted to gene symbols using these files were converted using BioMart (36). Gene sets consisting of less than five genes were removed and only the top 100 genes with the most PMIDs within each gene set were included. For yeast, there was not enough GeneRIF data to create gene sets with more than five genes.
Aligning RNA-seq samples of model organisms from SRA
We created gene–gene co-expression networks to predict gene function using RNA-seq data from published studies. To accomplish this, we first aligned all available RNA-seq samples for the four species from the Sequence Read Archive (SRA) (37). The number of analyzed samples for each organism were: Drosophila melanogaster (9924 samples), Caenorhabditis elegans (2935), Danio rerio (4004) and Saccharomyces cerevisiae (3268). The reference genome and genome annotations were downloaded from Ensembl (Table 2). In total, we processed 35 067 RNA-seq gene expression samples. Transcript quantification was performed using a modified version of the ARCHS4 pipeline (32). Kallisto (38) was utilized to build a reference index using the genome and annotation of each species. Gene counts were computed from the transcript counts. Transcript counts, as well as TPM, are directly reported from the Kallisto output. We mapped transcript counts to gene counts using the Ensembl genome annotation information. If multiple transcripts map to the same gene we summed all matching transcript counts to a unified gene count.
Table 2.
Referene genome versions used for alignment by ARCHS4 Zoo
| Species | Genome annotation version |
|---|---|
| Caenorhabditis elegans | WBcel235.92 |
| Danio rerio | GRCz11.92 |
| Drosophila melanogaster | BDGP6.93 |
| Saccharomyces cerevisiae | R64-1-1.92 |
Predicted gene set libraries
For each organism, a matrix of gene–gene co-expression correlation between all genes using all samples was created using the ARCHS4 Zoo gene expression data. The samples were quantile normalized and then the correlation was computed with the Pearson's correlation coefficient method. For each library, this co-expression matrix was used to determine the mean correlation between each gene and all genes in each gene set. These mean correlations were then sorted to generate a ranked list of predicted genes for each gene set term. The top 200 genes with a z-score >1.95 were included for each predicted gene set. Predicted gene sets consisting of five or fewer genes were removed.
Benchmarking gene predictions from the co-expression data
In order to benchmark the ability of the gene–gene co-expression matrices to predict relevant genes for each term, we used the gene–gene correlation matrix for each organism as described above. For each gene set within a library, the average correlation between each gene and each gene set was calculated and used to rank genes based on their likelihood to be associated with each gene set. The average area under the curve (AUC) for each gene set library was then calculated from the known gene-term associations. To compare the results to a baseline, AUCs were also calculated after randomly shuffling terms. Additionally, to demonstrate the robustness of these predictions, the same benchmarking strategy was performed after removing half of the most redundant gene sets from each library. To accomplish this, the Jaccard index was used to compute the similarity between all gene sets. The gene set with the highest average similarity to all other gene sets within a library was removed and this process was repeated until half of the most redundant gene sets were removed.
The modEnrichr web server implementation
modEnrichr is a freely available web-based platform built with the codebase of Enrichr (10,11). modEnrichr is a Java web server application running on Tomcat 8 on a Debian operating system. The landing page and each organism web servers are running as separate Docker containers (39) deployed with Apache Mesos (40). Mesosphere Marathon (41) orchestrates these containers by scaling and automatically restoring applications to guarantee high-availability and fault-tolerance. The modEnrichr's ortholog conversion tool is a Flask web server that provides API for a MySQL database of orthologs of selected organisms extracted from OrthoDB v10 (42). modEnrichr sends POST requests with an input gene list and a target organism to the ortholog conversion tool to automatically identify the input organism, and the to return the list of target orthologs.
RESULTS
modEnrichr is a suite of search engines presented within a unifying landing page (Figure 1). Each of the four model organism web server applications is forked implementations of the original Enrichr (10,11). The landing page contains a gene set input form that automatically identifies the model organism from which the gene list originates. Once the organism is detected, the modEnrichr application suggests the model organism version of Enrichr that the list should be submitted to. On the ‘Ortholog conversion’ tab the input gene list can be converted to a gene list of orthologs from the selected target model organism. Once converted, the gene set is submitted to the matching organism enrichment web server. The organism detection and the ortholog detection strategies are described in the methods section.
Figure 1.
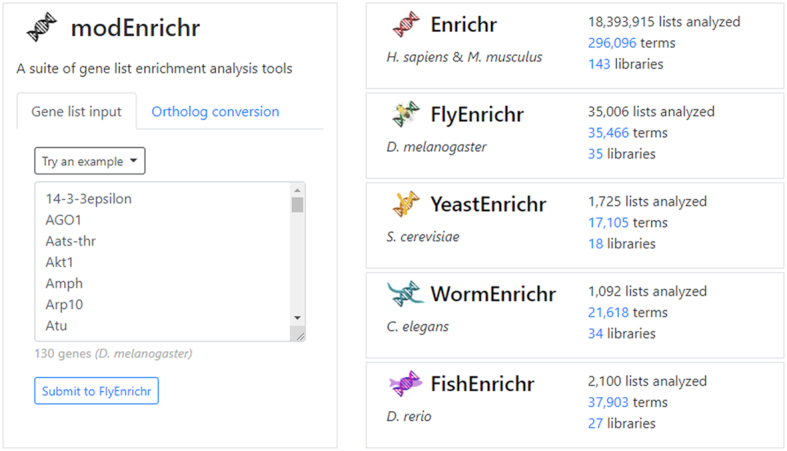
Screenshot of the modEnrichr's landing page. The input form on the left enables users to submit gene lists with an option to convert them to their orthologs in alternative species. The panel on the right provides names, logos, and links to the collection of modEnrichr tools with statistics about submissions, libraries, and annotated gene sets.
Another way to input data to modEnrichr is by uploading a BED-file. modEnrichr contains the most commonly used reference genomes for each model organism, including hg18/19/38 for human, mm8/9 for mouse, dm6 for fly, sacCer3 for yeast, ce11 for worm and danRer11 for zebrafish. Settings of the BED-file upload form enable users to specify the number of genes to retain based on the distance to the transcription start site. A Java module in modEnrichr maps the chromosome coordinates listed in the input BED files to their nearest coding genes. To achieve this, modEnrichr reads the position data for the selected species, takes the middle of the peak from the BED file, and adds the best match to the preliminary list. Then, it removes duplicates and returns the remaining genes. Figure 2 provides a workflow diagram that summarizes the various input options and the flow into the web-server platform.
Figure 2.

Flow chart depicting the various options provided to modEnrichr users for submitting gene set queries.
For batch requests, modEnrichr support access via RESTful API for each of the model organisms. The API web services support gene set enrichment analysis, and the gene-to-model-organism-ortholog conversion service. To maximize the Findability, Accessibility, Interoperability and Reusability (FAIR) (43) of modEnrichr, the web services API are documented with Swagger (44) and deposited into the smartAPI repository for community interoperability (45). modEnrichr stores input gene lists in a MySQL database and assigns a unique URL to each resulting analysis. This feature enables users to restore their results and share them with their colleagues. To produce the analysis results, modEnrichr calculates four alternative scores of statistical significance for each term: (i) a P-value using the Fisher exact test, (ii) an adjusted P-value using the Benjamini–Hochberg method to correct for multiple hypotheses testing, (iii) a Z-score that is the deviation from expected rank as previously described (10), and (iv) a combined score that is calculated by multiplying the Z-score with the negative logarithm of the P-value. modEnrichr visualizes the results in two general ways. The first is a bar graph that displays the top 10 terms sorted by P-value, Z-score, or the combined score. The second way is an interactive table that lists the four enrichment scores and the overlapping genes for each term. The table can be sorted by enrichment score and filtered by any part of a matching term.
modEnrichr currently has 35 libraries for D. melanogaster, 27 libraries for D. rerio, 34 libraries for C. elegans and 18 libraries for S. cerevisiae for a total of over 100 000 annotated gene sets. These libraries were created by directly processing data from the Gene Ontology (24) cutting the biological process, molecular function and cellular component organism-specific trees at various levels to create gene sets from each tree; organism-specific WikiPathways (21) by converting each pathway into a gene set; organism-specific KEGG pathways (20); transcription factor targets from the TF2DNA (46), a resource that contains organism-specific transcription factor targets gene sets based on transcription factor binding motifs; BioGRID (47) gene sets created from direct PPI of highly connected proteins; phenotypes from RNAi screens recorded in the GenomeRNAi database (48); other datasets processed into gene set libraries from the organism-specific databases WormBase (19), DroID (49), FlyBase (50), SGD (51) and ZFIN (35).
To expand the collection of modEnrichr libraries, we created additional libraries by first submitting lists of unique terms from a specific theme, for example, anatomical parts, phenotypes, pathways, cellular compartments, and gene families, to PubMed using the NCBI e-utilities API. We then converted these lists of PMIDs into gene sets for each submitted term using either GeneRIF (25) or AutoRIF. AutoRIF is an alternative version of GeneRIF that we created using Tagger (26) to associate genes with PMIDs for each organism. To further enrich these newly created libraries with predicted genes that may be associated with the terms, we used gene–gene co-expression data created from ARCHS4 Zoo (32) to substitute the original genes within each gene set with those genes that collectively are most correlated with the original genes in the set based on co-expression correlations (see ‘Materials and Methods’ section for details). This approach can be used to discover novel genes that are predicted to be associated with a term, but the association is awaiting experimental discovery and validation. We demonstrate that such associations are predictive because they recover the known genes much more frequently than expected (Figure 3). We would like to note that the gene sets created with GeneRIF, AutoRIF, and in particular those created with the co-expression procedure, are suggestive. These libraries are likely less accurate compared with the literature or experimentally vetted libraries, for example, those libraries created from the GO or KEGG resources. This is because the automatically generated libraries were created programmatically and would need further validation and cleaning. Hence, users of modEnrichr should view these additional libraries as suggestive and use caution when developing assertions and hypotheses from these new resources. A summary of the various routes taken to produce the gene set libraries for modEnrichr is visualized as a flow diagram (Figure 4).
Figure 3.

Benchmarking the ability of the gene-gene co-expression matrices to predict relevant genes for terms within libraries for (A) Caenorhabditis elegans, (B) Danio rerio, (C) Drosophila melanogaster and (D) Saccharomyces cerevisiae. To compare these results to a baseline, AUCs were calculated after randomly shuffling terms. Benchmarking was also performed after removing half of the most redundant gene sets from each library in order to demonstrate robustness of these predictions to this factor.
Figure 4.

Flow chart depicting the various routes taken to generate the gene set libraries that populate modEnrichr.
SUMMARY
modEnrichr provides a comprehensive resource for gene set enrichment analysis for model organisms. Beyond processing existing model organism-specific resources into gene sets, modEnrichr extends the availability of gene sets by utilizing PubMed, GeneRIF and AutoRIF. modEnrichr further expands standard gene sets by predicting gene function through gene-gene co-expression matrices that are created for each organism by uniformly aligning thousands of RNA-seq samples collected from cells and tissues for the organism. In order to make modEnrichr as comprehensive as possible, we plan to continue adding new libraries as new datasets and resources become available. modEnrichr provides a framework that can be further expanded to other model organisms. In summary, modEnrichr is designed to facilitate model organism researchers to form comprehensive hypotheses through data integration and reuse.
FUNDING
NIH Grants [U54-HL127624 (LINCS-DCIC), U24-CA224260 (IDG-KMC), U54-OD020353 (ORIP), T32-GM062754 (Pharmacological Sciences Training Program), OT3-OD025467 (NIH Data Commons), in part]. Funding for open access charge: NIH [U54-HL127624].
Conflict of interest statement. None declared.
REFERENCES
- 1. Subramanian A., Tamayo P., Mootha V.K., Mukherjee S., Ebert B.L., Gillette M.A., Paulovich A., Pomeroy S.L., Golub T.R., Lander E.S.. Gene set enrichment analysis: a knowledge-based approach for interpreting genome-wide expression profiles. Proc. Natl. Acad. Sci. U.S.A. 2005; 102:15545–15550. [DOI] [PMC free article] [PubMed] [Google Scholar]
- 2. Huang D.W., Sherman B.T., Lempicki R.A.. Systematic and integrative analysis of large gene lists using DAVID bioinformatics resources. Nat. Protoc. 2008; 4:44–57. [DOI] [PubMed] [Google Scholar]
- 3. Reich M., Liefeld T., Gould J., Lerner J., Tamayo P., Mesirov J.P.. GenePattern 2.0. Nat. Genet. 2006; 38:500–501. [DOI] [PubMed] [Google Scholar]
- 4. Zhang B., Kirov S., Snoddy J.. WebGestalt: an integrated system for exploring gene sets in various biological contexts. Nucleic Acids Res. 2005; 33:W741–W748. [DOI] [PMC free article] [PubMed] [Google Scholar]
- 5. Carbon S., Ireland A., Mungall C.J., Shu S., Marshall B., Lewis S., Hub A., Group W.P.W.. AmiGO: online access to ontology and annotation data. Bioinformatics. 2008; 25:288–289. [DOI] [PMC free article] [PubMed] [Google Scholar]
- 6. Al-Shahrour F., Minguez P., Tárraga J., Montaner D., Alloza E., Vaquerizas J.M., Conde L., Blaschke C., Vera J., Dopazo J.. BABELOMICS: a systems biology perspective in the functional annotation of genome-scale experiments. Nucleic Acids Res. 2006; 34:W472–W476. [DOI] [PMC free article] [PubMed] [Google Scholar]
- 7. Hruz T., Laule O., Szabo G., Wessendorp F., Bleuler S., Oertle L., Widmayer P., Gruissem W., Zimmermann P.. Genevestigator v3: a reference expression database for the meta-analysis of transcriptomes. Adv.Bioinformatics. 2008; 2008:420747. [DOI] [PMC free article] [PubMed] [Google Scholar]
- 8. Zheng Q., Wang X.-J.. GOEAST: a web-based software toolkit for Gene Ontology enrichment analysis. Nucleic Acids Res. 2008; 36:W358–W363. [DOI] [PMC free article] [PubMed] [Google Scholar]
- 9. Mi H., Muruganujan A., Casagrande J.T., Thomas P.D.. Large-scale gene function analysis with the PANTHER classification system. Nat. Protoc. 2013; 8:1551–1566. [DOI] [PMC free article] [PubMed] [Google Scholar]
- 10. Chen E.Y., Tan C.M., Kou Y., Duan Q., Wang Z., Meirelles G.V., Clark N.R., Ma’ayan A.. Enrichr: interactive and collaborative HTML5 gene list enrichment analysis tool. BMC Bioinformatics. 2013; 14:128. [DOI] [PMC free article] [PubMed] [Google Scholar]
- 11. Kuleshov M.V., Jones M.R., Rouillard A.D., Fernandez N.F., Duan Q., Wang Z., Koplev S., Jenkins S.L., Jagodnik K.M., Lachmann A.. Enrichr: a comprehensive gene set enrichment analysis web server 2016 update. Nucleic Acids Res. 2016; 44:W90–W97. [DOI] [PMC free article] [PubMed] [Google Scholar]
- 12. Reimand J., Arak T., Adler P., Kolberg L., Reisberg S., Peterson H., Vilo J.. g:Profiler-a web server for functional interpretation of gene lists (2016 update). Nucleic Acids Res. 2016; 44:W83–W89. [DOI] [PMC free article] [PubMed] [Google Scholar]
- 13. Xie C., Mao X., Huang J., Ding Y., Wu J., Dong S., Kong L., Gao G., Li C.-Y., Wei L.. KOBAS 2.0: a web server for annotation and identification of enriched pathways and diseases. Nucleic Acids Res. 2011; 39:W316–W322. [DOI] [PMC free article] [PubMed] [Google Scholar]
- 14. Kim J.H., Karnovsky A., Mahavisno V., Weymouth T., Pande M., Dolinoy D.C., Rozek L.S., Sartor M.A.. LRpath analysis reveals common pathways dysregulated via DNA methylation across cancer types. BMC Genomics. 2012; 13:526. [DOI] [PMC free article] [PubMed] [Google Scholar]
- 15. Sulakhe D., Xie B., Taylor A., D'Souza M., Balasubramanian S., Hashemifar S., White S., Dave U.J., Agam G., Xu J.. Lynx: a knowledge base and an analytical workbench for integrative medicine. Nucleic Acids Res. 2016; 44:D882–D887. [DOI] [PMC free article] [PubMed] [Google Scholar]
- 16. Weng M.-P., Liao B.-Y.. modPhE:a model organism phenotype enrichment analysis of eukaryotic gene sets. Bioinformatics. 2017; 33:3505–3507. [DOI] [PubMed] [Google Scholar]
- 17. Szklarczyk D., Gable A.L., Lyon D., Junge A., Wyder S., Huerta-Cepas J., Simonovic M., Doncheva N.T., Morris J.H., Bork P.. STRING v11: protein-protein association networks with increased coverage, supporting functional discovery in genome-wide experimental datasets. Nucleic Acids Res. 2018; 47:D607–D613. [DOI] [PMC free article] [PubMed] [Google Scholar]
- 18. Chen J., Bardes E.E., Aronow B.J., Jegga A.G.. ToppGene Suite for gene list enrichment analysis and candidate gene prioritization. Nucleic Acids Res. 2009; 37:W305–W311. [DOI] [PMC free article] [PubMed] [Google Scholar]
- 19. Lee R.Y.N., Howe K.L., Harris T.W., Arnaboldi V., Cain S., Chan J., Chen W.J., Davis P., Gao S., Grove C.. WormBase 2017: molting into a new stage. Nucleic Acids Res. 2017; 46:D869–D874. [DOI] [PMC free article] [PubMed] [Google Scholar]
- 20. Kanehisa M., Goto S.. KEGG: Kyoto Encyclopedia of Genes and Genomes. Nucleic Acids Res. 2000; 28:27–30. [DOI] [PMC free article] [PubMed] [Google Scholar]
- 21. Pico A.R., Kelder T., Van Iersel M.P., Hanspers K., Conklin B.R., Evelo C.. WikiPathways: pathway editing for the people. PLoS Biol. 2008; 6:e184. [DOI] [PMC free article] [PubMed] [Google Scholar]
- 22. Mitchell A.L., Attwood T.K., Babbitt P.C., Blum M., Bork P., Bridge A., Brown S.D., Chang H.-Y., El-Gebali S., Fraser M.I.. InterPro in 2019: improving coverage, classification and access to protein sequence annotations. Nucleic Acids Res. 2018; 47:D351–D360. [DOI] [PMC free article] [PubMed] [Google Scholar]
- 23. El-Gebali S., Mistry J., Bateman A., Eddy S.R., Luciani A., Potter S.C., Qureshi M., Richardson L.J., Salazar G.A., Smart A.. The Pfam protein families database in 2019. Nucleic Acids Res. 2018; 47:D427–D432. [DOI] [PMC free article] [PubMed] [Google Scholar]
- 24. Ashburner M., Ball C.A., Blake J.A., Botstein D., Butler H., Cherry J.M., Davis A.P., Dolinski K., Dwight S.S., Eppig J.T.. Gene Ontology: tool for the unification of biology. Nat. Genet. 2000; 25:25–29. [DOI] [PMC free article] [PubMed] [Google Scholar]
- 25. Mitchell J.A., Aronson A.R., Mork J.G., Folk L.C., Humphrey S.M., Ward J.M.. Gene indexing: characterization and analysis of NLM's GeneRIFs. AMIA Annual Symposium Proceedings. 2003; American Medical Informatics Association; 460–464. [PMC free article] [PubMed] [Google Scholar]
- 26. Jensen L.J. Tagger: BeCalm API for rapid named entity recognition. 2017; bioRxiv doi: 10.1101/115022, 08 March 2017, preprint: not peer reviewed. [DOI]
- 27. Barutcuoglu Z., Schapire R.E., Troyanskaya O.G.. Hierarchical multi-label prediction of gene function. Bioinformatics. 2006; 22:830–836. [DOI] [PubMed] [Google Scholar]
- 28. Troyanskaya O.G., Dolinski K., Owen A.B., Altman R.B., Botstein D.. A Bayesian framework for combining heterogeneous data sources for gene function prediction (in Saccharomyces cerevisiae). Proc. Natl. Acad. Sci. U.S.A. 2003; 100:8348–8353. [DOI] [PMC free article] [PubMed] [Google Scholar]
- 29. Marcotte E.M., Pellegrini M., Thompson M.J., Yeates T.O., Eisenberg D.. A combined algorithm for genome-wide prediction of protein function. Nature. 1999; 402:83–86. [DOI] [PubMed] [Google Scholar]
- 30. Sharan R., Ulitsky I., Shamir R.. Network-based prediction of protein function. Mol. Syst. Biol. 2007; 3:88. [DOI] [PMC free article] [PubMed] [Google Scholar]
- 31. Rouillard A.D., Gundersen G.W., Fernandez N.F., Wang Z., Monteiro C.D., McDermott M.G., Ma’ayan A.. The harmonizome: a collection of processed datasets gathered to serve and mine knowledge about genes and proteins. Database. 2016; 2016:baw100. [DOI] [PMC free article] [PubMed] [Google Scholar]
- 32. Lachmann A., Torre D., Keenan A.B., Jagodnik K.M., Lee H.J., Wang L., Silverstein M.C., Ma’ayan A.. Massive mining of publicly available RNA-seq data from human and mouse. Nat. Commun. 2018; 9:1366. [DOI] [PMC free article] [PubMed] [Google Scholar]
- 33. Cock P.J.A., Antao T., Chang J.T., Chapman B.A., Cox C.J., Dalke A., Friedberg I., Hamelryck T., Kauff F., Wilczynski B.. Biopython: freely available Python tools for computational molecular biology and bioinformatics. Bioinformatics. 2009; 25:1422–1423. [DOI] [PMC free article] [PubMed] [Google Scholar]
- 34. Wong E.D., Karra K., Hitz B.C., Hong E.L., Cherry J.M.. The YeastGenome app: the Saccharomyces Genome Database at your fingertips. Database. 2013; 2013:bat004. [DOI] [PMC free article] [PubMed] [Google Scholar]
- 35. Howe D.G., Bradford Y.M., Conlin T., Eagle A.E., Fashena D., Frazer K., Knight J., Mani P., Martin R., Moxon S.A.T.. ZFIN, the Zebrafish Model Organism Database: increased support for mutants and transgenics. Nucleic Acids Res. 2012; 41:D854–D860. [DOI] [PMC free article] [PubMed] [Google Scholar]
- 36. Smedley D., Haider S., Ballester B., Holland R., London D., Thorisson G., Kasprzyk A.. BioMart—biological queries made easy. BMC Genomics. 2009; 10:22. [DOI] [PMC free article] [PubMed] [Google Scholar]
- 37. Leinonen R., Sugawara H., Shumway M. Collaboration INSD . The sequence read archive. Nucleic Acids Res. 2010; 39:D19–D21. [DOI] [PMC free article] [PubMed] [Google Scholar]
- 38. Bray N.L., Pimentel H., Melsted P., Pachter L.. Near-optimal probabilistic RNA-seq quantification. Nat. Biotechnol. 2016; 34:525–527. [DOI] [PubMed] [Google Scholar]
- 39. Merkel D. Docker: lightweight linux containers for consistent development and deployment. Linux J. 2014; 2014:2. [Google Scholar]
- 40. Ignazio R. Mesos in Action. 2016; NY: Manning Publications Co. [Google Scholar]
- 41. Saha P., Govindaraju M., Marru S., Pierce M.. Integrating apache airavata with docker, marathon, and mesos. Concurr. Comput. 2016; 28:1952–1959. [Google Scholar]
- 42. Kriventseva E.V., Kuznetsov D., Tegenfeldt F., Manni M., Dias R., Simão F.A., Zdobnov E.M.. OrthoDB v10: sampling the diversity of animal, plant, fungal, protist, bacterial and viral genomes for evolutionary and functional annotations of orthologs. Nucleic Acids Res. 2018; 47:D807–D811. [DOI] [PMC free article] [PubMed] [Google Scholar]
- 43. Wilkinson M.D., Dumontier M., Aalbersberg I.J., Appleton G., Axton M., Baak A., Blomberg N., Boiten J.-W., da Silva Santos L.B., Bourne P.E.. The FAIR Guiding Principles for scientific data management and stewardship. Sci. Data. 2016; 3:160018. [DOI] [PMC free article] [PubMed] [Google Scholar]
- 44. Team S. Swagger restful api documentation specification 1.2. Techn Ber Technical report. Wordnik. 2014; 14–30. [Google Scholar]
- 45. Zaveri A., Dastgheib S., Wu C., Whetzel T., Verborgh R., Avillach P., Korodi G., Terryn R., Jagodnik K., Assis P.. smartAPI: towards a more intelligent network of Web APIs. European Semantic Web Conference. 2017; Cham: Springer; 154–169. [Google Scholar]
- 46. Pujato M., Kieken F., Skiles A.A., Tapinos N., Fiser A.. Prediction of DNA binding motifs from 3D models of transcription factors; identifying TLX3 regulated genes. Nucleic Acids Res. 2014; 42:13500–13512. [DOI] [PMC free article] [PubMed] [Google Scholar]
- 47. Stark C., Breitkreutz B.-J., Reguly T., Boucher L., Breitkreutz A., Tyers M.. BioGRID: a general repository for interaction datasets. Nucleic Acids Res. 2006; 34:D535–D539. [DOI] [PMC free article] [PubMed] [Google Scholar]
- 48. Schmidt E.E., Pelz O., Buhlmann S., Kerr G., Horn T., Boutros M.. GenomeRNAi: a database for cell-based and in vivo RNAi phenotypes, 2013 update. Nucleic Acids Res. 2012; 41:D1021–D1026. [DOI] [PMC free article] [PubMed] [Google Scholar]
- 49. Murali T., Pacifico S., Yu J., Guest S., Roberts G.G., Finley R.L.. DroID 2011: a comprehensive, integrated resource for protein, transcription factor, RNA and gene interactions for Drosophila. Nucleic Acids Res. 2010; 39:D736–D743. [DOI] [PMC free article] [PubMed] [Google Scholar]
- 50. Thurmond J., Goodman J.L., Strelets V.B., Attrill H., Gramates L.S., Marygold S.J., Matthews B.B., Millburn G., Antonazzo G., Trovisco V.. FlyBase 2.0: the next generation. Nucleic Acids Res. 2018; 47:D759–D765. [DOI] [PMC free article] [PubMed] [Google Scholar]
- 51. Cherry J.M., Adler C., Ball C., Chervitz S.A., Dwight S.S., Hester E.T., Jia Y., Juvik G., Roe T., Schroeder M.. SGD: Saccharomyces genome database. Nucleic Acids Res. 1998; 26:73–79. [DOI] [PMC free article] [PubMed] [Google Scholar]