


Abstract
Protein aggregation is a hallmark of a growing number of human disorders and constitutes a major bottleneck in the manufacturing of therapeutic proteins. Therefore, there is a strong need of in-silico methods that can anticipate the aggregative properties of protein variants linked to disease and assist the engineering of soluble protein-based drugs. A few years ago, we developed a method for structure-based prediction of aggregation properties that takes into account the dynamic fluctuations of proteins. The method has been made available as the Aggrescan3D (A3D) web server and applied in numerous studies of protein structure-aggregation relationship. Here, we present a major update of the A3D web server to version 2.0. The new features include: extension of dynamic calculations to significantly larger and multimeric proteins, simultaneous prediction of changes in protein solubility and stability upon mutation, rapid screening for functional protein variants with improved solubility, a REST-ful service to incorporate A3D calculations in automatic pipelines, and a new, enhanced web server interface. A3D 2.0 is freely available at: http://biocomp.chem.uw.edu.pl/A3D2/
INTRODUCTION
Protein aggregation lies behind more than 40 human diseases, ranging from neurodegenerative disorders to some types of cancers or diabetes type II (1,2). In addition, aggregation is a major limitation in the production, storage and administration of life-saving protein pharmaceuticals, like antibodies and replacement enzymes, since it both reduces the percentage of therapeutically active molecules and increases immunogenic responses (3).
The growing concern about protein aggregation has fueled the development of over twenty predictive algorithms (4,5). A majority of methods identify and score protein aggregation prone regions (APRs) relying only on protein sequence. Those programs find difficulties predicting APRs of folded globular proteins, failing to detect APRs when residues are not contiguous in sequence or mistaking APRs for the buried hydrophobic core. These problems motivated the development of a second generation of algorithms that use structure-based approaches for their predictions (6). In 2015, we developed the Aggrescan3D (A3D) web server for prediction of aggregation properties of protein structures (7). The A3D method was shown to outperform sequence- and composition-based algorithms when dealing with proteins in their native-like states (7,8).
A3D integrates the 3D information of protein structures and evaluates the contribution of solvent-exposed APRs. The method works by projecting experimental aggregation propensities onto a protein structure. Aggregation propensity is calculated for spherical regions centred on every residue alpha-carbon using the intrinsic amino acid aggregation scale from the Aggrescan method (9,10), the first sequence-based algorithm to exploit empirical in vivo data. This provides a structurally corrected aggregation value (A3D score) for each particular amino acid, depending on its specific conformational context, discarding the negligible contribution of hydrophobic residues buried in the core of folded proteins and focusing on protein surfaces. The dynamic structural fluctuations of proteins in solution influences the degree of exposure of APRs. For this reason, A3D incorporates the CABS-flex approach (11,12) for fast simulations of protein flexibility in its dynamic mode. Moreover, A3D allows the introduction of user-defined mutations to rationally design more soluble protein variants or to test the impact of disease-linked mutations on the aggregation propensity.
Among other applications, A3D has been exploited to understand the binding of chaperones to their targets (13), to study the binding of antimicrobial proteins to membranes (14), to rationalize the yield of engineered nanobodies (15), to study the aggregation properties of pathogenic (16,17) and non-pathogenic (18) globular proteins or to assist the design of biotechnologically relevant proteins (19,20).
In this work, we present a major update of the original A3D, which significantly extends its capabilities. A3D 2.0 incorporates three major feature upgrades.
protein flexibility simulations using new CABS-flex standalone package (21), which extends the dynamic mode analysis range to proteins up to 4000 residues long and consisting of up to 10 chains.
protein stability calculations using the FoldX force field (22), allowing to account for the impact of amino acid substitutions on the overall structure stability.
an ‘automated mutations’ tool that identifies high scoring residues in structural APRs and suggests protein variants with optimized solubility.
These features were implemented to address the major A3D drawbacks according to users’ feedback. (i) Protein size limitations in the dynamic mode, restricted only to single-chain proteins shorter than 400 amino acids; (ii) the user-introduced mutations might impact negatively protein stability, resulting in unfolding and increased aggregation; (iii) the design of improved solubility variants required significant knowledge about the structural and aggregational determinants of proteins and, thus, was not accessible to many potential users.
Additionally, A3D 2.0 incorporates an updated REST-full service that allows the user to incorporate its calculations in automatic pipelines and a newly designed interface that facilitates extended in situ interactive result analysis and data interpretation.
METHODS
A3D prediction protocol
The original A3D server was described in detail elsewhere (7). A3D server can be run in Static Mode (default) or Dynamic Mode. The static mode was validated by predicting the solubility of a large set of protein mutational variants, whereas the dynamic mode allowed to uncover disease relevant APRs not identified by alternative approaches (7,8). The key principles of A3D 2.0 remain similar to these of the original web server and here we only detail major methodological modifications. The overview of the method pipeline is presented in Figure 1.
Figure 1.
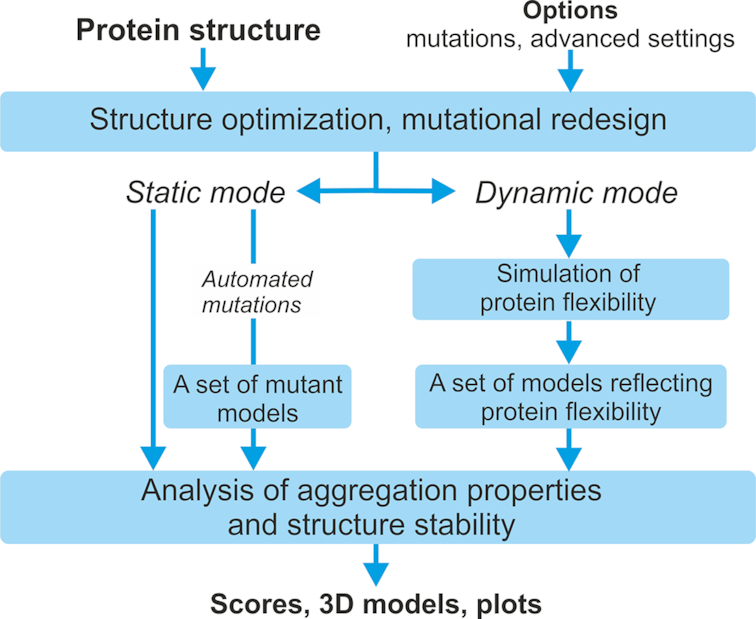
The pipeline of Aggrescan3D 2.0 server.
Calculation of the impact of introduced mutations on protein thermodynamic stability
Users can introduce individual or multiple mutations before or after running A3D 2.0. The selected mutations are modeled on top of the protein structure using FoldX (22) and the predicted change in stability, relative to the reference molecule, is calculated. Positive and negative values indicate decreased and increased stabilities upon mutation, respectively.
Automated mutation workflow
The input structure is optimized using FoldX (22) and the most aggregation-prone residues identified according to their A3D score. These residues are individually mutated to solubilizing charged amino acids (arginine, aspartic acid, glutamic acid and lysine), excluding those positions specified by the user. The changes in aggregation propensity and stability are calculated for each potential point mutant and short-listed according to these values, up to a maximum of 12 suggested changes. Only the two most solubilizing mutations for each particular position are shown, in order to maximize the number of positions that can be potentially engineered (up to 6).
NEW FEATURES AND UPDATES
Analysis of the impact of protein flexibility in the aggregation properties of large and multimeric proteins
In its dynamic mode, A3D was able to capture the influence of structural flexibility on protein aggregation by incorporating the CABS-flex protocol, an efficient alternative to classical all-atom Molecular Dynamics (11,12,21,23,24). A set of protein models (in an all-atom resolution) reflecting the most dominant structural fluctuations in the near-native ensemble are generated with CABS-flex for each input structure. Then, the highest A3D scoring model is selected as a proxy of the most aggregation-prone conformer in solution. Although this feature uncovered structural APRs not accessible to other structure-based predictors (7), its use was restricted to relatively small, single chain proteins, which impeded the analysis of many biomedical and biotechnologically important proteins. With A3D 2.0 we extended the dynamic mode to larger and multimeric proteins by dedicating significantly larger computational resources to web server jobs and rewriting the CABS-flex code (21).
We used A3D 2.0 to analyse the influence of protein dynamics on the aggregation properties of multimeric proteins, using a data set of 163 proteins (69 homodimers, 54 heterodimers and 60 antibodies) (Supplementary Table S1). In the dynamic mode, A3D 2.0 rendered 12 models for each input structure and calculated their individual A3D scores. Afterward, these values were compared with the ones obtained for the same proteins ran in static mode. We found the input static structures to be the least aggregation-prone in a large majority of cases, both for the complete set and when the three protein categories were analyzed separately (Figure 2A). We averaged the A3D scores of the 12 models for each individual protein as a proxy for the aggregation propensity of its native-like ensemble. The resulting average value was higher than that of the static structure in 80% of the cases (Supplementary Table S1). These results have important implications, since most alternative structure-based aggregation predictors work directly on PDB structures and, therefore, they might underscore the aggregation of multimeric proteins by ignoring the contribution of transiently exposed APRs. This effect is illustrated in Figure 2B for bevacizumab, a humanized monoclonal antibody prescribed for the treatment of different types of cancers (25). The Fab domain of bevacizumab is very aggregation-prone, and, accordingly, the antibody must be formulated at low concentrations (26,27). The comparative static and dynamic analysis of bevacizumab Fab fragment (two chains, four domains) suggests that structural fluctuations result in an increased aggregation-prone area, with newly exposed APRs ready to establish intermolecular interactions. The same effect was observed for other therapeutic antibodies, replacement enzymes like α-galactosidase or pharmaceutically important targets such as insulin and androgen receptors.
Figure 2.

Aggregation propensity for different multimeric proteins, calculated in static or dynamic modes. (A) The aggregation propensity of the static input structure relative to that of the 12 dynamic models is represented for homodimers, heterodimers, antibodies or the complete set. In the color scale, dark blue indicates the static structure being the most soluble (ranking 1) and dark red the static structure being the most aggregation-prone (ranking 13). (B) Monoclonal antibody bevacizumab Fab fragment (PDB: 1BJ1) ran on static (left) or dynamic (right) modes.
Simultaneous analysis of the impact of user-selected mutations in protein solubility and stability
The A3D server allowed users to mutate one or more selected residues in the structure, pre- or post-analysis, in order to evaluate the impact in protein aggregation. However, these mutations might also affect the protein thermodynamic stability, an effect that was not taken into account at that time. Indeed, we have shown that there exists a strict correlation between the destabilizing impact of a given mutation and the increase it promotes in protein aggregation (28,29). Thus, the solubilizing impact of a residue substitution can be completely cancelled if it impacts the protein stability.
Mutations at the protein surface are generally better tolerated that residue changes in the protein interior (30). However, when we used A3D to identify the top solubilizing point mutations for a set of 75 globular proteins, it turned out that 10% of these superficial changes (32/324) destabilized the protein >1 kcal/mol according to FoldX (Supplementary Table S2). This motivated us to introduce a simultaneous prediction of protein solubility and stability changes upon mutation in A3D 2.0, to identify mutations that decrease globular proteins aggregation propensities without compromising their stability and function. This approach was exploited to design of a fast-folding, aggregation-resistant GFP variant (19) (Figure 3). The analysis of the original GFP structure with A3D 2.0, indicated the existence of three hydrophobic residues exposed at the protein surface, whose mutation to either K or D would be equally solubilizing. However, the energetic analysis indicated that mutations to K would be neutral, whereas mutations to D would destabilize the protein. Two GFP variants in which the three hydrophobic residues were changed either to K or D were recombinantly expressed. As predicted, the triple K GFP mutant (GFP/KKK) was highly soluble, preserved the native structure and was fully functional, whereas the triple D variant (GFP/DDD) was inactive and could not be purified. Importantly, the behavior of GFP/KKK and GFP/DDD designs, could not be anticipated by any other alternative sequence- or structure-based algorithm. A3D 2.0 advises now against the experimental characterization of destabilized re-designs (ΔΔG > 1 kcal/mol), irrespective of their A3D scores. ΔΔG values are provided in the ‘Project details’ tab.
Figure 3.

A3D 2.0 as a tool for the in silico redesign of more stable and soluble proteins. A3D structures of original GFP (left) (PDB: 2B3Q:A) and engineered GFP/KKK mutant (right) (PDB: 6FWW) coloured according to the A3D score. Mutations lowering aggregation propensity, while maintaining protein stability are encircled. The mutated variant was experimentally shown to be 2-fold more resistant against aggregation (19).
Automated design of solubility improved protein variants
The search for soluble functional variants of therapeutic proteins is a challenging task, usually addressed using combinatorial experimental approaches, such us phage display (31). A goal of any aggregation prediction algorithm is to provide a routine that can substitute for these experiments, saving time and costs. Ideally, this routine should be simple enough to be accessible to non-expert users. With these two objectives in mind, we implemented the ‘automated mutations’ tool in A3D 2.0, accessible at the server front page through the ‘Enhance protein solubility’ option.
The ‘automated mutations’ tool identifies the most aggregation-prone patches at the protein surface and virtually mutates their residues by charged amino acids, under the assumption that they would act as ‘gatekeepers’, counteracting protein self-association. Then it provides a ranked list of point mutations, where both the solubilizing and energetic effects are taken into account, in such a way that the user can discard potentially solubilizing, but destabilizing mutations.
The optimization of the solubility of antibodies is especially difficult, because, in these molecules, the tight binding to their targets depends on the presence of exposed APRs at their complementarity-determining regions (CDRs). This is the reason why computer- (32) or experiment- (33) based designs usually target residues within or close to CDRs; however, these changes might compromise significantly the antibody affinity. A3D 2.0 addresses this problem by allowing users to exclude from the virtual screening functionally relevant residues, i.e. CDRs in antibodies or active sites in enzymes.
The ‘automated mutation’ tool has been used for the redesign of an aggregation-prone Variable Heavy (VH) segment of the human antibody germline (34). Soluble variants of this antibody were previously evolved by phage display, but all the introduced mutations clustered at one of the CDRs (35). A3D 2.0 was ran pre-excluding residues at the CDRs. Mutations at three different residues outside these domains were automatically suggested (Figure 4A). A designed VH variant containing the 3 top ranked mutations was recombinantly expressed and characterized (Figure 4B), turning to be significantly more resistant against aggregation than the original germline antibody (19).
Figure 4.

Automated mutations for variable heavy (VH) segment of a human germline antibody. (A) A3D 2.0 automated mutations output (the residues at the three antibody CDRs were excluded from the screening). (B) The blue highlighted mutations in panel A were combined to render triple mutant engineered antibody. Structures of wild type (PDB: 5I19) and the mutant, as predicted by A3D 2.0. Solubilizing mutations are encircled. The engineered antibody variant was experimentally shown to be 3-fold more resistant against aggregation (19).
DESCRIPTION OF THE WEB SERVER
Input interface and requirements
The only required input is a protein structure in PDB format (given as a PDB code or uploaded by user in the ‘Input structure’ panel). Optionally, a user can provide desired chain(s) identifier(s) (only provided chains will be used in the A3D analysis). In the ‘Options’ panel, there are several additional options to be chosen:
Project name—the name under which the project will be displayed (and which can be used to find it via the project name search on the top of the page)
Email address—provided an email address the server will notify the user when the job has started and ended
Stability calculations—if selected (default: Yes), the submitted structure will be energetically minimized before the A3D analysis using FoldX and stability calculated in case mutations are defined.
Dynamic mode—in this mode, the input structure's flexibility will be simulated using the CABS-flex software. A set of predicted models reflecting the flexibility of the input structure will be analysed and scored for aggregation propensity. Note: this option cannot be used with the ‘Enhance protein solubility’ option.
Mutate residues—if selected, the option allows a user to select residues and perform point mutations on the input structure, which are built using FoldX. Selecting this option will prompt a new window, which allows introducing the desired mutation(s). Note: this option cannot be used with the ‘Enhance protein solubility’ option.
Distance of aggregation analysis—in the A3D method, the intrinsic aggregation propensity of each particular amino acid in the structure is modulated by its specific structural context. Aggregation propensity is calculated for spherical regions centered on every residue Cα carbon. This option allows changing the size of said region allowing for more and less granular approaches.
Enhance protein solubility—Please see Methods for details on the automated mutations workflow behind this option. Selecting it will prompt a new window to open upon submitting, where the user can prevent chosen residues from being mutated. Note: This option cannot be used with ‘Mutate residues’ or ‘Dynamic mode’ options.
Do not show my job in the results page - if the box is ticked the job will not be visible to other A3D 2.0 users.
For more details, see the online documentation available from the ‘Tutorial’ tab.
Output interface
For each submitted job, the output interface is organized under the following tabs: ‘Project details’, ‘Aggrescan3D plot’, ‘Aggrescan3D score’, ‘Structure’, ‘Automated mutations’ (available only if the job was submitted with the option ‘Enhance protein solubility’), ‘Dynamic mode details’ (available only if the job was submitted in the ‘Dynamic mode’) and ‘Gallery’. The content of these tabs is presented and described in the online documentation. Here, we present only short descriptions:
‘Project details’ tab—contains information about the specified options used to run the job and links to download the job data. It also provides stability calculations, when it applies.
‘Aggrescan3D plot’ tab—presents A3D analysis results in the form of an interactive online plot for a selected protein chain.
‘Aggrescan3D score’ tab—presents A3D analysis results in the form of an interactive table together with ‘mutate’ buttons in the right side of the table, which allows to resubmit the job with chosen mutations.
‘Structure’ tab—allows viewing an analysed structure in an interactive way. The residues are colored in shades from dark blue (high soluble residues), through white (no predicted influence on aggregation properties), to dark red (aggregation prone residues). Various visualization options are possible.
‘Dynamic mode details’ tab—presents A3D analysis results for a set of models reflecting flexibility of the input structure. The results are organized in the table and interactive plots presenting scores for particular models.
‘Automated mutations’ tab—presents A3D analysis results for a set of mutant models generated using option ‘Enhance protein solubility’. The results are organized in the table and interactive plots presenting scores for particular protein variants.
‘Gallery’ tab - contains all screenshots taken by users (using ‘Take snapshot’ buttons)
Online documentation
The documentation can be found on the server itself under the ‘Tutorial’ tab (available from the main menu). Additionally, the web interface provides short help notes that are available close to the presented content. The online documentation is updated on a regular basis according to users’ needs or the server improvement.
Command-line availability
The A3D 2.0 server can be also operated from the command line using RESTful web services. The instructions for using the RESTful service are available from the online tutorial (accessible from the main menu).
Server architecture
The Aggrescan3D 2.0 server is a HTML based service dynamically generated using the Flask framework and the jinja2 templating engine. The user data is stored using a MySQL database upon submission and unique id and a status are assigned for each job. The server notifies the user of its progress by a job status, which is ‘pending’ when the server is waiting for a computational cluster response, ‘queue’ when there are no resources available yet, ‘running’ and then finally either ‘done’ or ‘error’. The simulation is carried out using the Aggrescan3D standalone software (that is available at http://bitbucket.org/lcbio/aggrescan3d) and other previously described programs (with the RSA calculations done by FreeSASA software (36)). The structures are presented in an interactive way using the 3Dmol library (HTML5/Javascript). The A3D score plot is done using the D3.js library (HTML5/Javascript) and the model and mutant comparison plots are generated using the Bokeh library (Python/Javascript). The PDB structures are obtained using RESTful services. The A3D 2.0 website handles user's requests using an Apache2 server. The A3D 2.0 server is free, open to all users and there is no login requirement.
SUMMARY
In this work, we developed an easy-to-use A3D 2.0 web server interface for the prediction and engineering of protein solubility. The implemented changes boost the server functionality with an unprecedented combination of features for APRs identification and design taking into account dynamic and thermodynamic aspects in the predictions. A3D 2.0 can find application in the identification and analysis of pathogenic familial mutations in conformational disorders, but, it is specially intended to assist the design of soluble proteins for biotechnological and biomedical applications, where it should contribute to reduce development costs and times.
Supplementary Material
SUPPLEMENTARY DATA
Supplementary Data are available at NAR Online.
FUNDING
Spanish Ministry of Economy and Competitiveness [BIO2016-78310-R to S.V., ICREA, ICREA-Academia 2015 to S.V.]; National Science Center (NCN, Poland) Grant [MAESTRO2014/14/A/ST6/00088 to M.K and S.K.].
Conflict of interest statement. None declared.
REFERENCES
- 1. Chiti F., Dobson C.M.. Protein misfolding, amyloid formation, and human disease: a summary of progress over the last decade. Annu. Rev. Biochem. 2017; 86:27–68. [DOI] [PubMed] [Google Scholar]
- 2. Invernizzi G., Papaleo E., Sabate R., Ventura S.. Protein aggregation: mechanisms and functional consequences. Int. J. Biochem. Cell Biol. 2012; 44:1541–1554. [DOI] [PubMed] [Google Scholar]
- 3. Hamrang Z., Rattray N.J., Pluen A.. Proteins behaving badly: emerging technologies in profiling biopharmaceutical aggregation. Trends Biotechnol. 2013; 31:448–458. [DOI] [PubMed] [Google Scholar]
- 4. Pallares I., Ventura S.. Advances in the prediction of protein aggregation propensity. Curr. Med. Chem. 2017; doi:10.2174/0929867324666170705121754. [DOI] [PubMed] [Google Scholar]
- 5. Meric G., Robinson A.S., Roberts C.J.. Driving forces for nonnative protein aggregation and approaches to predict Aggregation-Prone regions. Annu. Rev. Chem. Biomol. Eng. 2017; 8:139–159. [DOI] [PubMed] [Google Scholar]
- 6. Ricardo Graña-Montes J.P.-P., Carlota Gómez-Picanyol, Ventura A.S.. Rigden DJ. From Protein Structure to Function with Bioinformatics. 2017; Springer; 205–263. [Google Scholar]
- 7. Zambrano R., Jamroz M., Szczasiuk A., Pujols J., Kmiecik S., Ventura S.. AGGRESCAN3D (A3D): server for prediction of aggregation properties of protein structures. Nucleic Acids Res. 2015; 43:W306–W313. [DOI] [PMC free article] [PubMed] [Google Scholar]
- 8. Pujols J., Pena-Diaz S., Ventura S.. AGGRESCAN3D: Toward the prediction of the aggregation propensities of protein structures. Methods Mol. Biol. 2018; 1762:427–443. [DOI] [PubMed] [Google Scholar]
- 9. Conchillo-Sole O., de Groot N.S., Aviles F.X., Vendrell J., Daura X., Ventura S.. AGGRESCAN: a server for the prediction and evaluation of “hot spots” of aggregation in polypeptides. BMC Bioinformatics. 2007; 8:65. [DOI] [PMC free article] [PubMed] [Google Scholar]
- 10. de Groot N.S., Castillo V., Grana-Montes R., Ventura S.. AGGRESCAN: method, application, and perspectives for drug design. Methods Mol. Biol. 2012; 819:199–220. [DOI] [PubMed] [Google Scholar]
- 11. Jamroz M., Kolinski A., Kmiecik S.. CABS-flex: server for fast simulation of protein structure fluctuations. Nucleic Acids Res. 2013; 41:W427–W431. [DOI] [PMC free article] [PubMed] [Google Scholar]
- 12. Kuriata A., Gierut A.M., Oleniecki T., Ciemny M.P., Kolinski A., Kurcinski M., Kmiecik S.. CABS-flex 2.0: a web server for fast simulations of flexibility of protein structures. Nucleic Acids Res. 2018; 46:W338–W343. [DOI] [PMC free article] [PubMed] [Google Scholar]
- 13. Pulido P., Llamas E., Llorente B., Ventura S., Wright L.P., Rodriguez-Concepcion M.. Specific Hsp100 chaperones determine the fate of the first enzyme of the plastidial isoprenoid pathway for either refolding or degradation by the stromal Clp protease in arabidopsis. PLos Genet. 2016; 12:e1005824. [DOI] [PMC free article] [PubMed] [Google Scholar]
- 14. Pulido D., Arranz-Trullen J., Prats-Ejarque G., Velazquez D., Torrent M., Moussaoui M., Boix E.. Insights into the antimicrobial mechanism of action of human RNase6: structural determinants for bacterial cell agglutination and membrane permeation. Int. J. Mol. Sci. 2016; 17:552. [DOI] [PMC free article] [PubMed] [Google Scholar]
- 15. Soler M.A., de Marco A., Fortuna S.. Molecular dynamics simulations and docking enable to explore the biophysical factors controlling the yields of engineered nanobodies. Sci. Rep. 2016; 6:34869. [DOI] [PMC free article] [PubMed] [Google Scholar]
- 16. Bhandare V.V., Ramaswamy A.. The proteinopathy of D169G and K263E mutants at the RNA Recognition Motif (RRM) domain of tar DNA-binding protein (tdp43) causing neurological disorders: a computational study. J. Biomol. Struct. Dyn. 2018; 36:1075–1093. [DOI] [PubMed] [Google Scholar]
- 17. Zerovnik E. Putative alternative functions of human stefin B (cystatin B): binding to amyloid-beta, membranes, and copper. J. Mol. Recognit. 2017; 30:e2562. [DOI] [PubMed] [Google Scholar]
- 18. Katina N.S., Balobanov V.A., Ilyina N.B., Vasiliev V.D., Marchenkov V.V., Glukhov A.S., Nikulin A.D., Bychkova V.E.. sw ApoMb amyloid aggregation under nondenaturing conditions: the role of native structure stability. Biophys. J. 2017; 113:991–1001. [DOI] [PMC free article] [PubMed] [Google Scholar]
- 19. Gil-Garcia M., Bano-Polo M., Varejao N., Jamroz M., Kuriata A., Diaz Caballero M., Lascorz J., Morel B., Navarro S., Reverter D. et al.. Combining structural aggregation propensity and stability predictions to re-design protein solubility. Mol. Pharm. 2018; 15:3846–3859. [DOI] [PubMed] [Google Scholar]
- 20. Xia X., Kumru O.S., Blaber S.I., Middaugh C.R., Li L., Ornitz D.M., Sutherland M.A., Tenorio C.A., Blaber M.. Engineering a cysteine-free form of human fibroblast growth Factor-1 for “Second Generation” therapeutic application. J. Pharm. Sci. 2016; 105:1444–1453. [DOI] [PMC free article] [PubMed] [Google Scholar]
- 21. Kurcinski M., Oleniecki T., Ciemny M.P., Kuriata A., Kolinski A., Kmiecik S.. CABS-flex standalone: a simulation environment for fast modeling of protein flexibility. Bioinformatics. 2019; 35:694–695. [DOI] [PMC free article] [PubMed] [Google Scholar]
- 22. Schymkowitz J., Borg J., Stricher F., Nys R., Rousseau F., Serrano L.. The FoldX web server: an online force field. Nucleic Acids Res. 2005; 33:W382–W388. [DOI] [PMC free article] [PubMed] [Google Scholar]
- 23. Jamroz M., Kolinski A., Kmiecik S.. CABS-flex predictions of protein flexibility compared with NMR ensembles. Bioinformatics. 2014; 30:2150–2154. [DOI] [PMC free article] [PubMed] [Google Scholar]
- 24. Jamroz M., Orozco M., Kolinski A., Kmiecik S.. Consistent view of protein fluctuations from all-atom molecular dynamics and coarse-grained dynamics with knowledge-based force-field. J. Chem. Theory Comput. 2013; 9:119–125. [DOI] [PubMed] [Google Scholar]
- 25. Gridelli C., de Castro Carpeno J., Dingemans A.C., Griesinger F., Grossi F., Langer C., Ohe Y., Syrigos K., Thatcher N., Das-Gupta A. et al.. Safety and efficacy of bevacizumab plus Standard-of-Care treatment beyond disease progression in patients with advanced non-small cell lung cancer: the AvaALL randomized clinical trial. JAMA Oncol. 2018; 4:e183486. [DOI] [PMC free article] [PubMed] [Google Scholar]
- 26. Oliva A., Llabres M., Farina J.B.. Capability measurement of size-exclusion chromatography with a light-scattering detection method in a stability study of bevacizumab using the process capability indices. J. Chromatogr. A. 2014; 1353:89–98. [DOI] [PubMed] [Google Scholar]
- 27. Courtois F., Agrawal N.J., Lauer T.M., Trout B.L.. Rational design of therapeutic mAbs against aggregation through protein engineering and incorporation of glycosylation motifs applied to bevacizumab. mAbs. 2016; 8:99–112. [DOI] [PMC free article] [PubMed] [Google Scholar]
- 28. Espargaro A., Castillo V., de Groot N.S., Ventura S.. The in vivo and in vitro aggregation properties of globular proteins correlate with their conformational stability: the SH3 case. J. Mol. Biol. 2008; 378:1116–1131. [DOI] [PubMed] [Google Scholar]
- 29. Castillo V., Espargaro A., Gordo V., Vendrell J., Ventura S.. Deciphering the role of the thermodynamic and kinetic stabilities of SH3 domains on their aggregation inside bacteria. Proteomics. 2010; 10:4172–4185. [DOI] [PubMed] [Google Scholar]
- 30. Franzosa E.A., Xia Y.. Structural determinants of protein evolution are context-sensitive at the residue level. Mol. Biol. Evol. 2009; 26:2387–2395. [DOI] [PubMed] [Google Scholar]
- 31. Sidhu S.S. Phage display in pharmaceutical biotechnology. Curr. Opin. Biotechnol. 2000; 11:610–616. [DOI] [PubMed] [Google Scholar]
- 32. Sormanni P., Aprile F.A., Vendruscolo M.. The CamSol method of rational design of protein mutants with enhanced solubility. J. Mol. Biol. 2015; 427:478–490. [DOI] [PubMed] [Google Scholar]
- 33. Perchiacca J.M., Lee C.C., Tessier P.M.. Optimal charged mutations in the complementarity-determining regions that prevent domain antibody aggregation are dependent on the antibody scaffold. Protein Eng. Des. Sel. 2014; 27:29–39. [DOI] [PubMed] [Google Scholar]
- 34. Teplyakov A., Obmolova G., Malia T.J., Luo J., Muzammil S., Sweet R., Almagro J.C., Gilliland G.L.. Structural diversity in a human antibody germline library. mAbs. 2016; 8:1045–1063. [DOI] [PMC free article] [PubMed] [Google Scholar]
- 35. Dudgeon K., Rouet R., Kokmeijer I., Schofield P., Stolp J., Langley D., Stock D., Christ D.. General strategy for the generation of human antibody variable domains with increased aggregation resistance. Proc. Natl. Acad. Sci. U.S.A. 2012; 109:10879–10884. [DOI] [PMC free article] [PubMed] [Google Scholar]
- 36. Mitternacht S. FreeSASA: an open source C library for solvent accessible surface area calculations [version 1; peer review: 2 approved]. F1000Research. 2016; 5:189. [DOI] [PMC free article] [PubMed] [Google Scholar]
Associated Data
This section collects any data citations, data availability statements, or supplementary materials included in this article.