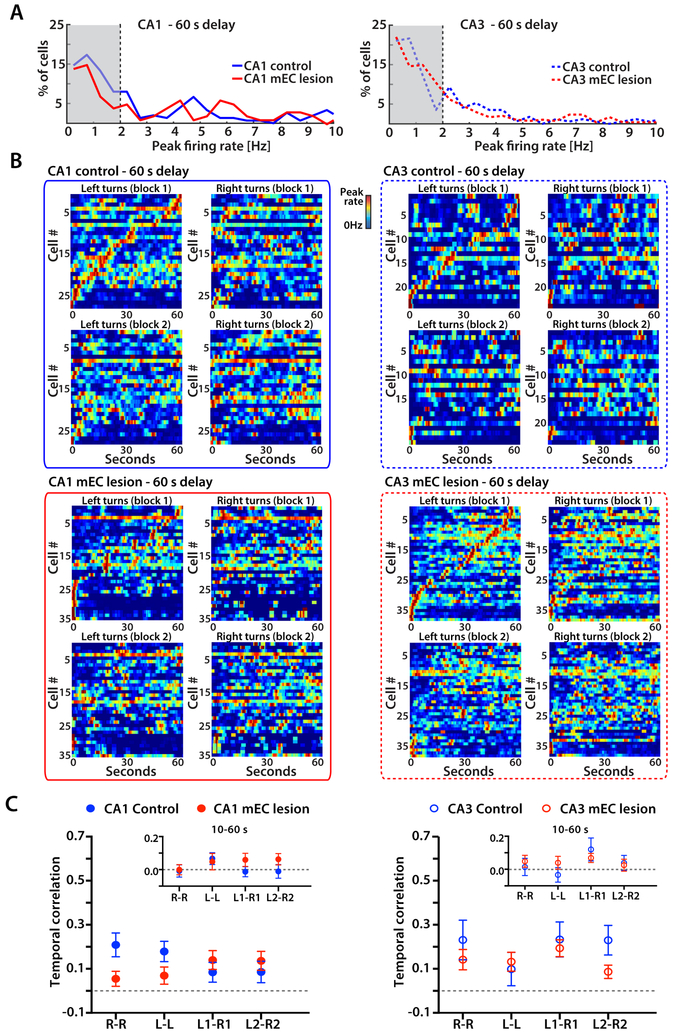
Figure 5. Time cells do not bridge discontinuous events over 60 s retention intervals.
(A) For each cell, firing rates were calculated for each 500 ms bin throughout the 60 s delay interval of correct trials, and the distribution of peak firing rates from all CA1 (left) and CA3 (right) cells from control and mEC lesioned rats is shown. (B) Temporal firing patterns of all CA1 cells and CA3 cells that were active during the 60 s delay. Each row is the average firing rate for a single cell over one block, normalized by the cell’s peak rate. Cells are sorted by the time of the peak during the first block of left-turn trials. Color bars indicate the firing rate from 0 Hz in blue to the peak rate in red. (C) For each cell, the correlation between corresponding time bins over the 60 s delay (i.e., temporal correlation) was calculated between left-turn and right-turn trials within a block and between trials of the same type across the two blocks (n.s., two-way ANOVA with Trial type and Blocks as factors). Symbols and error bars are the mean ± SEM. Insets: cell-by-cell temporal correlation between blocks and trial types, excluding the first 10 s of the 60 s delay interval (n.s., two-way ANOVA). See also Figures S5, S6 and Table S4.

