INTRODUCTION:
FibroScan's M and XL probes give significantly different results, which could lead to misevaluation of liver fibrosis if the correct probe is not chosen. According to the manufacturer, the M probe should be used when the skin–liver capsule distance (SCD) is <25 mm, and the XL probe should be used when SCD is ≥25 mm. We aimed at validating this recommendation and defining the conditions of use for FibroScan probes in clinical practice.
METHODS:
Four hundred thirty-nine patients with biopsy-proven chronic liver disease were included. Of them, 382 had successful examinations with both M and XL probes. Advanced fibrosis was defined as Nonalcoholic Steatohepatitis Clinical Research Network (NASH CRN) F ≥3 or Metavir F ≥2.
RESULTS:
In a same patient, XL probe results were significantly lower than M probe results: 7.9 (5.6–11.7) vs 9.5 (6.7–14.6) kPa, respectively (P < 0.001). After matching for age, sex, liver fibrosis, and serum transaminases, M probe results in patients with SCD <25 mm and XL probe results in those with SCD ≥25 mm did not significantly differ: 8.8 (6.0–12.0) vs 9.1 (6.7–12.8) kPa, respectively (P = 0.175). Of note, 81.4% of patients with body mass index (BMI) <32 kg/m2 had SCD <25 mm, and 77.7% of patients with BMI ≥32 kg/m2 had SCD ≥25 mm. A practical algorithm using BMI first and then the FibroScan Automatic Probe Selection tool was proposed to help physicians accurately choose which probe to use in clinical practice.
CONCLUSIONS:
There is no significant difference in results between M and XL probes when they are used in the right conditions. In clinical practice, the probe should be selected according to the BMI and the Automatic Probe Selection tool.
INTRODUCTION
Liver fibrosis is the main determinant of prognosis in patients with chronic liver diseases and therefore must be accurately evaluated (1). FibroScan, a device dedicated to the measurement of liver stiffness, offers the opportunity of an accurate, quick, noninvasive, and painless evaluation of liver fibrosis (2). Liver stiffness measurement (LSM) with FibroScan also has the advantage of giving immediate results, enabling case management decisions during the consultation and in the presence of the patient. The classic FibroScan M probe is, however, impaired by measurement failure rates reaching 8% in overweight patients (body mass index (BMI) ≥25 kg/m2) and 17% in obese patients (BMI ≥30 kg/m2) (3). To circumvent this problem, the manufacturer has developed the XL probe specifically dedicated for overweight/obese patients. Compared with the classic M probe, the XL probe uses a lower central frequency (2.5 vs 3.5 MHz for the M probe), has a larger tip diameter (12 vs 9 mm), and measures more deeply below the skin surface (3.5–7.5 vs 2.5–6.5 cm).
Previous works have shown that the XL probe has a lower rate of measurement failure than and the same diagnostic accuracy as the M probe (4–6). However, they also demonstrated that in any given patient, the XL probe result is lower than that of the M probe, with consequently a potential risk of underestimation of liver fibrosis. The application of specific diagnostic cutoffs for the XL probe has been suggested as a means to address this difference (7), but cutoff proposals differ across studies and still lack validation (8). Furthermore, there is also heterogeneity in the conditions of use of the XL probe in the literature, with some authors using it in cases of M probe failure (9) and others for patients with increased BMI (10,11).
For its part, the FibroScan manufacturer recommends using the M probe for patients with skin–liver capsule distance (SCD) <25 mm and the XL probe for those with SCD ≥25 mm. In practice, the Automatic Probe Selection (APS) tool included in recent versions of the device's software automatically measures SCD and indicates the probe to be used as a function of the patient's morphology. According to the manufacturer, following this recommendation enables the use of the same diagnostic cutoffs for both the M and XL probes. Here, as it has never been done, we aimed at evaluating the relevance of these recommendations for clinical practice and at defining the conditions of use for the M and XL probes in a large cohort of patients with biopsy-proven chronic liver diseases.
METHODS
Patients
In this phase IIB study (12), we included patients with chronic liver disease who underwent liver biopsy between June 2013 and October 2016 in Angers University Hospital or between April 2010 and February 2015 in Bordeaux University Hospital. Exclusion criteria were the presence of liver complications (liver failure, encephalopathy, ascites, variceal bleeding, and systemic infection) or hepatocellular carcinoma. The study protocol conformed to the ethical guidelines of the current Declaration of Helsinki and was approved by the local ethics committee. All patients included in the study provided their informed written consent.
Liver biopsy
Pathological examination of liver biopsy was performed in each center by senior experts specialized in hepatology and blinded for patient data. Liver fibrosis was evaluated according to Nonalcoholic Steatohepatitis Clinical Research Network (NASH CRN) staging in patients with nonalcoholic fatty liver disease and METAVIR staging in patients with other causes of chronic liver disease. Although the 2 semiquantitative scoring systems comprise stages from F0 to F4, they do not completely correspond (Supplementary Table s1, Supplementary Digital Content, http://links.lww.com/CTG/A15). For the present study, we defined “no/mild fibrosis” as NASH CRN F0-2 or METAVIR F0-1, “septal fibrosis” as NASH CRN F3 or Metavir F2-3, and “cirrhosis” as NASH CRN F4 or METAVIR F4. “Advanced fibrosis” was defined as NASH CRN F ≥3 or Metavir F ≥2.
LSM with FibroScan
LSM with FibroScan (Echosens, Paris, France) was performed by experienced operators (>500 examinations) blinded for patient data, the day of or no more than 3 months before or after liver biopsy. Two examinations were performed, 1 with the M probe and the other with the XL probe, both in fasting conditions. For each, LSM was stopped when 10 valid measurements were recorded, and the result (in kilopascals, kPa) was expressed as the median of these valid measurements. Failure was defined as LSM with no or only 1 valid measurement. LSM cutoffs from the meta-analysis performed by Tsochatzis et al. (13) were used to diagnose advanced fibrosis (≥7.3 kPa) and cirrhosis (≥15.0 kPa). The distance from the skin surface to the liver capsule was measured using conventional B-mode ultrasonography.
The latest versions of the FibroScan devices now include the APS tool, which indicates which probe should be used for LSM. In practice, the APS tool indicates “M” or “XL” on the FibroScan screen when the probe is placed on the skin (Figure s1, Supplementary Digital Content, http://links.lww.com/CTG/A15). The probe type recommended by the APS tool during the FibroScan examination performed at inclusion was not recorded in the database, but that information was retrievable from the FibroScan acquisition files stored in the device. Therefore, all files from the patients included in the Angers center were retrospectively assessed by the Echosens company, blinded for patient data, to determine which probe was recommended by the APS tool. Because the probe's recommendation can fluctuate along the course of an examination, it was recorded into the device's acquisition file at the time of each measurement. That information was therefore available in our study for analyses of each of the valid measurements obtained during the examinations.
Statistical analysis
Quantitative variables were expressed as mean ± s.d. or median with first and third quartiles and compared using the Mann-Whitney or the Wilcoxon test, as appropriate. Qualitative variables were expressed as percentages and compared using the Fisher exact test or the McNemar test. Correlations were assessed using the Spearman correlation coefficient (Rs) and agreement using the intraclass correlation coefficient (ICC). Diagnostic accuracy was mainly expressed as the area under the receiver operating characteristics (AUROCs). AUROCs were compared according to Delong et al. (14) for paired groups. Statistical analyses were performed using SPSS version 18.0 software (IBM, Armonk, NY) and SAS 9.1 (SAS Institute, Cary, NC).
RESULTS
Patients
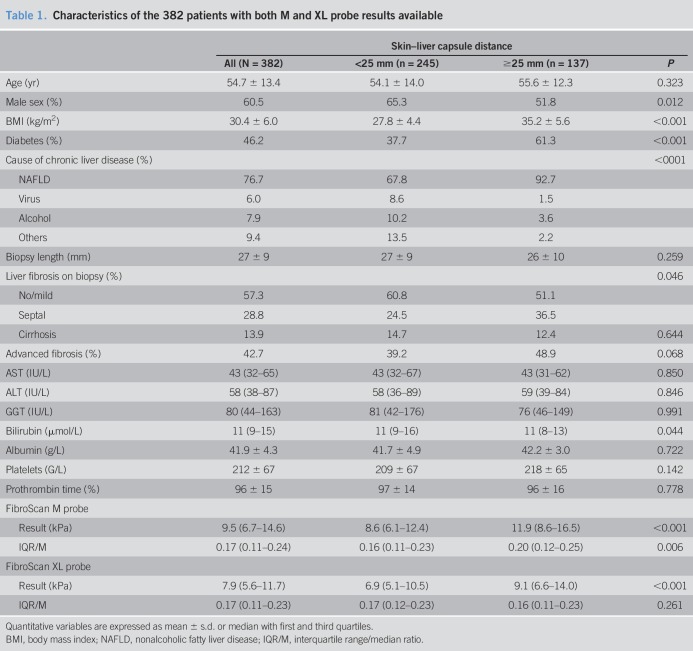
The Angers center included 213 patients and the Bordeaux center 226, for a total of 439 patients. LSM failure occurred with the M probe in 57 patients and with the XL probe in 5 patients (13.0% vs 1.1%, P < 0.001), all these latter being among the former, leaving 382 patients who had LSM results available for both probes. Characteristics of these 382 patients are detailed in Table 1. The mean age was 54.7 ± 13.4 years, 60.5% were male, mean BMI was 30.4 ± 6.0 kg/m2, and the main cause of chronic liver disease was nonalcoholic fatty liver disease (76.7%). The mean liver biopsy length was 27 ± 9 mm and 92.6% of patients had a biopsy ≥15 mm. Advanced fibrosis was present in 42.7% of patients and cirrhosis in 13.9%.
Table 1.
Characteristics of the 382 patients with both M and XL probe results available
Paired comparison of M and XL probe results
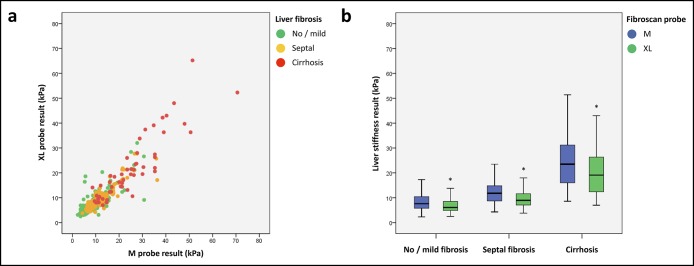
We first compared the paired M and XL probe results obtained in each patient. M probe and XL probe results were very well correlated with Rs = 0.873 (P < 0.001) and ICC = 0.909 (P < 0.001; Figure 1a). There was no significant difference between the AUROC of M and XL probes for the diagnosis of advanced fibrosis (respectively, 0.808 ± 0.022 vs 0.784 ± 0.024; P = 0.070) or cirrhosis (0.898 ± 0.020 vs 0.896 ± 0.020; P = 0.880). However, the results of the XL probe were significantly lower than those of the M probe (7.9 (5.6–11.7) vs 9.5 (6.7–14.6) kPa, P < 0.001), regardless of the level of liver fibrosis (Figure 1b; Table s2, Supplementary Digital Content, http://links.lww.com/CTG/A15). Consequently, for a same LSM result, the M probe provided better sensitivity for advanced fibrosis (Figure s2a, Supplementary Digital Content, http://links.lww.com/CTG/A15) and cirrhosis (Figure s2b, Supplementary Digital Content, http://links.lww.com/CTG/A15), whereas the XL probe offered better specificity. We can illustrate this difference with a practical example: When we applied the 7.3-kPa diagnostic cutoff for advanced fibrosis and the 15.0-kPa cutoff for cirrhosis (13), sensitivity was more than 10% higher with the M probe than with the XL probe (Table 2), respectively, 93.3% vs 81.0% for the diagnosis of advanced fibrosis (P < 0.001) and 75.5% vs 62.3% for the diagnosis of cirrhosis (P = 0.016). In contrast, specificity was significantly higher with the XL probe compared with the M probe, respectively, 64.8% vs 45.2% for advanced fibrosis (P < 0.001) and 90.9% vs 85.7% for cirrhosis (P < 0.001). Taken together, these results suggested the need for specific diagnostic cutoffs for each probe.
Figure 1.
Correlation (a) and comparison (b) between paired M and XL probe results. *P < 0.001.
Table 2.
Diagnostic accuracy of M and XL probes
Evaluation of the manufacturer's recommendation
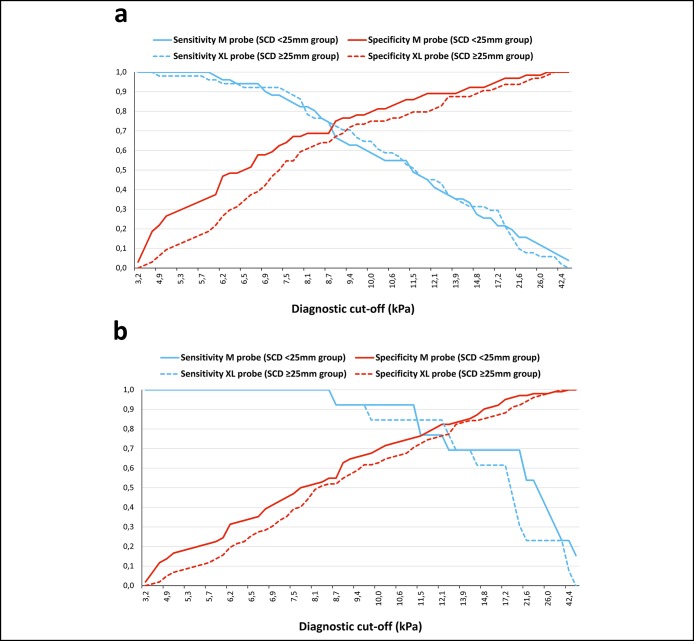
FibroScan's manufacturer recommends using the M probe when the SCD is <25 mm and the XL probe when it is ≥25 mm. In our total study population, SCD assessed by ultrasound imaging was <25 mm and ≥25 mm in, respectively, 245 and 137 patients (Table 1). We were able to match 115 patients from each SCD group according to age, sex, liver fibrosis on liver biopsy, and serum transaminases (Table s3, Supplementary Digital Content, http://links.lww.com/CTG/A15). In this 230 patients subgroup, the M and XL probe results were significantly higher in patients with SCD ≥25 mm compared with those with SCD <25 mm (Table s3, Supplementary Digital Content, http://links.lww.com/CTG/A15). Interestingly, the M probe results in the SCD < 25 mm group were not significantly different from the XL probe results obtained in the SCD ≥25 mm group with, respectively: 8.8 (6.0–12.0) vs 9.1 (6.7–12.8) kPa (P = 0.175; Figure 2). The difference in sensitivity and specificity previously observed between the 2 probes (Figure s2, Supplementary Digital Content, http://links.lww.com/CTG/A15) was erased when the M probe was kept for the SCD <25 mm group and the XL probe for the SCD ≥25 mm group (Figure 3). Consequently, when the manufacturer's recommendation was respected and the same diagnostic cutoff used for both probes, the diagnostic accuracies of the M and XL probes were similar (Table s4, Supplementary Digital Content, http://links.lww.com/CTG/A15).
Figure 2.
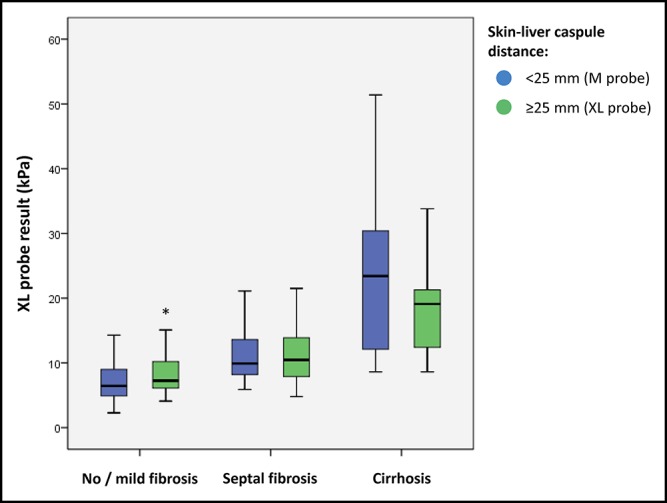
Comparison of M probe results from 115 patients with skin–liver capsule distance (SCD) <25 mm with XL probe results from 115 matched patients with SCD ≥25 mm. *P = 0.030.
Figure 3.
Sensitivity and specificity curves of M probe results from 115 patients with skin–liver capsule distance (SCD) <25 mm vs XL probe results from 115 matched patients with SCD ≥25 mm. (a) Diagnosis of advanced fibrosis. (b) Diagnosis of cirrhosis.
Which probe should be used when starting the examination?
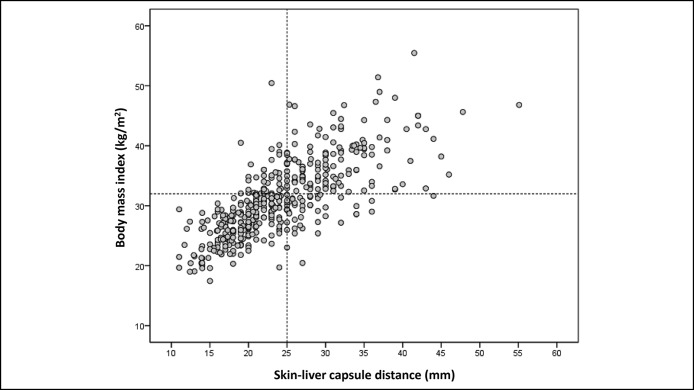
SCD correlated better with BMI (Rs = 0.767, P < 0.001; Figure 4) than with waist circumference (Rs = 0.720, P < 0.001). The AUROC of BMI for the prediction of SCD ≥25 mm was 0.871 ± 0.017 vs 0.845 ± 0.019 for waist circumference (P = 0.033). According to the highest Youden index that optimizes sensitivity and specificity, the best BMI cutoff to discriminate SCD <25 mm from SCD ≥25 mm was 32 kg/m2. Of note, 81.4% of patients with BMI <32 kg/m2 had SCD <25 mm and 77.7% of patients with BMI ≥32 kg/m2 had SCD ≥25 mm. Overall, 80% of patients were correctly classified for SCD <25 mm or ≥25 mm using the 32 kg/m2 BMI threshold. These results suggested that LSM examination should start with the M probe in patients with BMI <32 kg/m2 and the XL probe in patients with BMI ≥32 kg/m2.
Figure 4.
Correlation between the skin–liver capsule distance and body mass index.
Is there a need to switch probes during the examination?
The FibroScan acquisition files from the Angers center were retrospectively assessed to determine which probe would have been recommended by the FibroScan's APS tool. Figure s3 (see Supplementary Digital Content, http://links.lww.com/CTG/A15) shows SCD as a function of the number of valid shots associated with a M probe recommendation when using the M probe in patients with BMI <32 kg/m2. The APS tool recommended the M probe in ≥8 of the 10 valid shots for 126 patients, 112 of whom (89%) had SCD <25 mm. It recommended the M probe in <8 of the 10 valid shots for the 11 remaining patients, 7 of whom had SCD ≥25 mm. These observations suggested that after starting with the M probe in patients with BMI <32 kg/m2, operators should switch to the XL probe if the APS recommendation flips between M and XL during the examination. Figure s4 (see Supplementary Digital Content, http://links.lww.com/CTG/A15) shows SCD as a function of the number of valid shots associated with a XL probe recommendation when using the XL probe in patients with BMI ≥32 kg/m2. SCD was ≥25 mm in most of the cases, whatever the number of shots associated with a XL probe recommendation. This result confirmed that the XL probe should be used in all patients with BMI ≥32 kg/m2.
Algorithm for probe selection in clinical practice
On the basis of the above results, we propose a simple algorithm for the choice of the FibroScan probe in clinical practice (Figure 5). Using the M probe for SCD <25 mm and the XL probe for SCD ≥25 mm as a reference, the algorithm correctly predicted which probe to use in 83.5% of the cases. The M probe was recommended despite SCD ≥25 mm in 14 patients, 11 of whom had SCD between 25 and 30 mm. The XL probe was recommended despite SCD <25 mm in 21 patients, 19 of whom had SCD between 20 and 25 mm.
Figure 5.
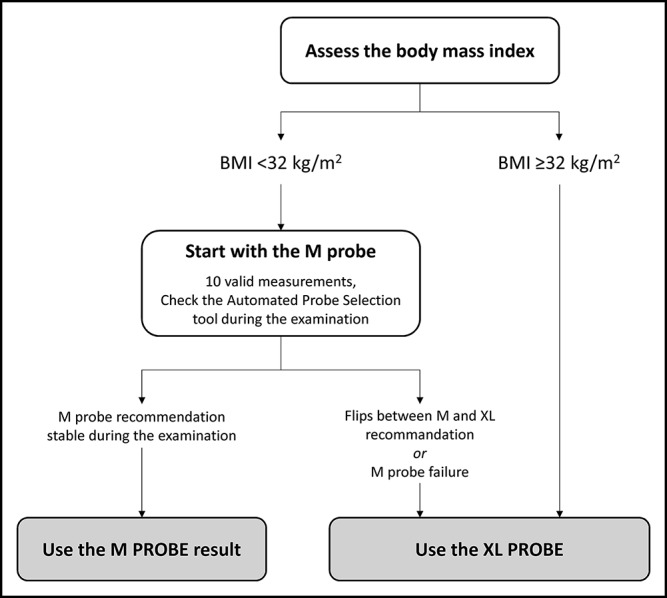
Practical algorithm for choosing the FibroScan probe in clinical practice.
The correlation between LSM results obtained using the study algorithm and those obtained by choosing the probe according to ultrasound-measured SCD was excellent with Rs = 0.965 (P < 0.001) and ICC = 0.984 (P < 0.001; Figure 6). LSM results acquired when the probe choice was guided by the study algorithm and those acquired when it was guided by ultrasound-measured SCD provided similar accuracies for the diagnosis of advanced fibrosis and cirrhosis (Table s5, Supplementary Digital Content, http://links.lww.com/CTG/A15).
Figure 6.
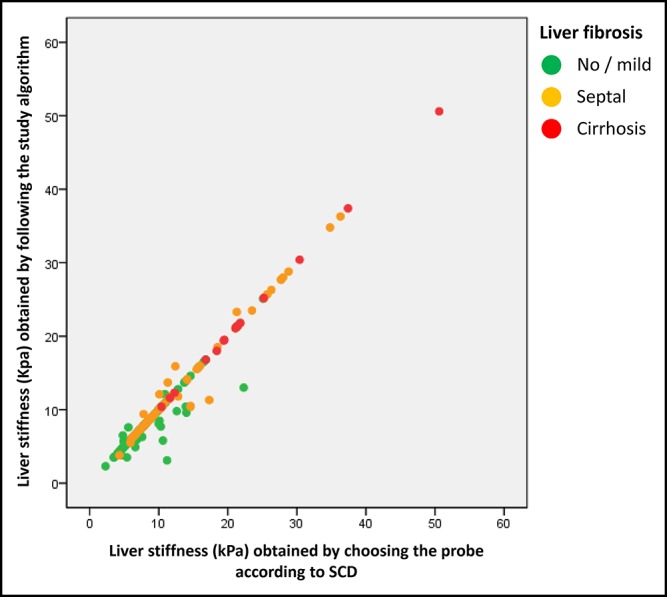
Correlation between liver stiffness obtained by choosing the probe according to the skin–liver distance as measured by ultrasonography (M probe if SCD <25 mm, XL probe if SCD ≥25 mm; X axis) and liver stiffness obtained by following the study algorithm (Y axis).
DISCUSSION
FibroScan is now widely used for the noninvasive evaluation of liver fibrosis in chronic liver diseases. Technically, the FibroScan XL probe is more suitable for LSM in obese patients. Indeed, the thicker subcutaneous tissue in these patients places the liver capsule deeper than 25 mm under the skin and the M probe, which is set to take measurements between 25 and 65 mm under the skin, could do so within that subcutaneous fat tissue. In contrast, the XL probe takes measurements at 35–75 mm under the skin, thus ensuring measurements within the liver parenchyma in obese patients. However, in any 1 patient, its M and XL probes give significantly different results; choosing the correct probe is thus crucial to avoid the misevaluation of liver fibrosis in clinical practice. We present here the first pragmatic evaluation of the use of the FibroScan probes. Our results show that in patients with BMI ≥32 kg/m2, LSM should be taken with the XL probe. In patients with BMI < 32 kg/m2, the operator should start with the M probe but switch to the XL probe if the recommendation made by FibroScan's APS tool flips between the 2 probes during the examination. The strengths of our study include a large study population, the use of liver biopsy as reference, and the very good quality of liver samples, 93% of them being 15 mm or greater in length.
Our results confirm previously published data showing that M and XL probe results are very well correlated, and their AUROCs for the diagnosis of advanced fibrosis and cirrhosis are not significantly different (4–6). They also confirm that in a same patient, the results obtained with the XL probe are lower than those obtained using the M probe (4–6). In 216 difficult to evaluate patients with mean BMI at 30.1 ± 4.1 kg/m2, Sirli et al. (15) showed that reliable FibroScan examination was obtained in a significantly higher rate of patients using the XL probe. In this work, liver biopsy was not available in all patients, and it was therefore not possible to compare the diagnostic cutoffs for the different stages of liver fibrosis between M and XL probes. Because liver biopsy and SCD were available for all our patients, we were able to additionally demonstrate for the first time that following the manufacturer recommendation (M probe for SCD <25 mm and XL probe for SCD ≥25 mm) allows using the same diagnostic cutoffs with similar diagnostic accuracy for both probes, which is a crucial information for the correct evaluation of liver fibrosis in clinical practice. Indeed, after matching for age, sex, liver fibrosis, and serum transaminases, there were no significant differences between the results obtained with the M probe in patients with SCD <25 mm and those obtained with the XL probe in patient with SCD ≥25 mm. In these conditions, the sensitivity and specificity curves of the 2 probes were comparable, and their diagnostic accuracies using the same diagnostic cutoffs were not significantly different.
We found that SCD correlated very well with BMI and that a BMI cutoff of 32 kg/m2 correctly classified 80% of the patients according to their SCD of <25 or ≥25 mm. Therefore, we propose here an algorithm in which LSM examination should be started using the M probe in patients with BMI <32 kg/m2 and the XL probe in patients with BMI ≥32 kg/m2. In patients with BMI <32 kg/m2, the operator must monitor the APS tool: if it flips between M and XL probe recommendations, the operator should change to the XL probe. In patients with BMI ≥32 kg/m2, there is no need to consult the APS tool because most of these patients had SCD ≥25 mm whatever the number of valid shots associated with the XL probe recommendation. With respect to the 25-mm SCD threshold, we recognize that our algorithm did not identify the right probe in 16.5% of the cases. Interestingly, for the remaining patients, the margin of error around the 25-mm SCD threshold did not exceed 5 mm in 86% of the cases. Finally, our practical recommendations are validated by the fact that the LSM results and diagnostic accuracies obtained following our algorithm were not significantly different from those obtained with a probe selection based on the SCD 25-mm threshold.
In conclusion, FibroScan's XL probe should be used to take LSMs in patients with BMI ≥32 kg/m2. The M probe should be used at least initially in patients with BMI <32 kg/m2, with switch to the XL probe according to the device's APS tool.
CONFLICTS OF INTEREST
Guarantor of the article: Jérôme Boursier, MD, PhD.
Specific author contributions: A.B.: study design, data acquisition, analysis, and draft writing/critical revision. S.S., F.Z., J.-B.H., A.L., and F.C.: data acquisition. G.H.: data acquisition and analysis. J.F., F.O., I.F.-H., and P.C.: data acquisition. V.d.L.: study design, data acquisition, and draft writing/critical revision. J.B.: study design, data acquisition, analysis, and draft writing/critical revision.
Financial support: University Hospital of Angers, Angers, France.
Potential competing interests: J.B. has consulting activities for Echosens.
Study Highlights.
WHAT IS KNOWN
✓ FibroScan is now widely used for the noninvasive diagnosis of liver fibrosis in chronic liver diseases.
✓ In a same patient, the FibroScan XL probe gives significantly lower results than the classic M probe.
✓ An incorrect choice between the M and XL probes could lead to misevaluation of liver fibrosis in clinical practice.
WHAT IS NEW HERE
✓ The results of the M and the XL probes are not significantly different when they are used according to the manufacturer's recommendations.
✓ Patients with BMI ≥32 kg/m2 should undergo FibroScan examination with the XL probe.
✓ In patients with BMI <32 kg/m2, FibroScan examination should start with the M probe and eventually switch to the XL probe according to the result of the FibroScan Automatic Probe Selection tool.
TRANSLATIONAL IMPACT
✓ The results of this study are important for all physicians, specialized hepatologists, and others who use the FibroScan device to evaluate the severity of chronic liver diseases.
Supplementary Material
REFERENCES
- 1.European Association for Study of the Liver, Asociacion Latinoamericana para el Estudio del Higado. EASL-ALEH Clinical Practice Guidelines: Non-invasive tests for evaluation of liver disease severity and prognosis. J Hepatol 2015;63:237–64. [DOI] [PubMed] [Google Scholar]
- 2.Castera L, Forns X, Alberti A. Non-invasive evaluation of liver fibrosis using transient elastography. J Hepatol 2008;48:835–47. [DOI] [PubMed] [Google Scholar]
- 3.Castéra L, Foucher J, Bernard PH, et al. Pitfalls of liver stiffness measurement: A 5-year prospective study of 13,369 examinations. Hepatology 2010;51:828–35. [DOI] [PubMed] [Google Scholar]
- 4.Wong VW, Vergniol J, Wong GL, et al. Liver stiffness measurement using XL probe in patients with nonalcoholic fatty liver disease. Am J Gastroenterol 2012;107:1862–71. [DOI] [PubMed] [Google Scholar]
- 5.de Ledinghen V, Wong VW, Vergniol J, et al. Diagnosis of liver fibrosis and cirrhosis using liver stiffness measurement: comparison between M and XL probe of FibroScan(R). J Hepatol 2012;56:833–9. [DOI] [PubMed] [Google Scholar]
- 6.Myers RP, Pomier-Layrargues G, Kirsch R, et al. Feasibility and diagnostic performance of the FibroScan XL probe for liver stiffness measurement in overweight and obese patients. Hepatology 2012;55:199–208. [DOI] [PubMed] [Google Scholar]
- 7.Kwok R, Choi KC, Wong GL, et al. Screening diabetic patients for non-alcoholic fatty liver disease with controlled attenuation parameter and liver stiffness measurements: A prospective cohort study. Gut 2016;65:1359–68. [DOI] [PubMed] [Google Scholar]
- 8.Xiao G, Zhu S, Xiao X, et al. Comparison of laboratory tests, ultrasound, or magnetic resonance elastography to detect fibrosis in patients with nonalcoholic fatty liver disease: A meta-analysis. Hepatology 2017;66:1486–501. [DOI] [PubMed] [Google Scholar]
- 9.Roulot D, Roudot-Thoraval F, NKontchou G, et al. Concomitant screening for liver fibrosis and steatosis in French type 2 diabetic patients using Fibroscan. Liver Int 2017;37:1897–906. [DOI] [PubMed] [Google Scholar]
- 10.Pang JX, Zimmer S, Niu S, et al. Liver stiffness by transient elastography predicts liver-related complications and mortality in patients with chronic liver disease. PLoS One 2014;9:e95776. [DOI] [PMC free article] [PubMed] [Google Scholar]
- 11.Cassinotto C, Lapuyade B, Mouries A, et al. Non-invasive assessment of liver fibrosis with impulse elastography: Comparison of supersonic shear imaging with ARFI and FibroScan®. J Hepatol 2014;61:550–7. [DOI] [PubMed] [Google Scholar]
- 12.Colli A, Fraquelli M, Casazza G, et al. The architecture of diagnostic research: From bench to bedside—research guidelines using liver stiffness as an example. Hepatology 2014;60:408–18. [DOI] [PubMed] [Google Scholar]
- 13.Tsochatzis EA, Gurusamy KS, Ntaoula S, et al. Elastography for the diagnosis of severity of fibrosis in chronic liver disease: A meta-analysis of diagnostic accuracy. J Hepatol 2011;54:650–9. [DOI] [PubMed] [Google Scholar]
- 14.DeLong ER, DeLong DM, Clarke-Pearson DL. Comparing the areas under two or more correlated receiver operating characteristic curves: A nonparametric approach. Biometrics 1988;44:837–45. [PubMed] [Google Scholar]
- 15.Sirli R, Sporea I, Deleanu A, et al. Comparison between the M and XL probes for liver fibrosis assessment by transient elastography. Med Ultrason 2014;16:119–22. [DOI] [PubMed] [Google Scholar]
Associated Data
This section collects any data citations, data availability statements, or supplementary materials included in this article.


