

Abstract
Size-exclusion chromatography (SEC) with on-line static light scattering, specifically multi-angle static light scattering (MALS), and differential refractometry (DRI) detection remains the premier method by which to determine absolute, calibrant-independent molar masses of polymers. The method is restricted to the use of either neat solvents or solvents with a small amount of additive. In mixed solvents, preferential solvation (i.e., the enrichment, within the solvated volume of the polymer in solution, of one solvent over the other as compared to the solvent ratio outside said volume) leads to errors in the areas of the MALS and DRI chromatograms, as the solvent baseline does not accurately represent the solvent contribution to these detectors’ peaks. A seemingly trivial way by which to overcome this problem is through the use of an isorefractive solvent pair. This “trivial” solution is complicated by the fact that the solvents in the pair must be miscible with each other in all proportions; the individual solvents as well as the mix must be able to fully dissolve the analyte; the solvents must possess sufficient optical contrast with the solution so as to generate an adequate detector signal; the solvent mix must be compatible with the chromatographic stationary phase, such that enthalpic contributions to the separation are minimal and analyte recovery from the columns is quantitative; and the difference in the Rayleigh factors of the solvents can be ignored. Herein, we present the analysis of narrow dispersity polystyrene (PS) and poly(methyl methacrylate) (PMMA) samples, across a four-fold range in molar mass, using SEC/MALS/DRI in a mix of tetrahydrofuran (THF) and methyl isoamyl ketone (MIAK), solvents which are shown to be isorefractive with each other at the temperature and wavelength of the experiments. Molar mass averages and dispersities are demonstrated to be statistically independent of solvent composition and to correspond well to the values in neat THF. The experiments were augmented by the use of on- and off-line quasi-elastic light scattering and of off-line MALS and DRI, to study the effect of solvent composition on polymer size in solution and on dilute solution thermodynamics. Additionally, 1H nuclear magnetic resonance spectroscopy was used to study the effect of tacticity on the insolubility of PMMA100 in 100% MIAK. We believe this constitutes the first example of obtaining accurate molar masses of polymers by SEC/MALS/DRI employing mixed solvents. The value of these experiments to other forms of macromolecular liquid chromatographic separations is also noted.
Keywords: Absolute molar mass, Mixed solvents, Size-exclusion chromatography, Light scattering, Refractometry
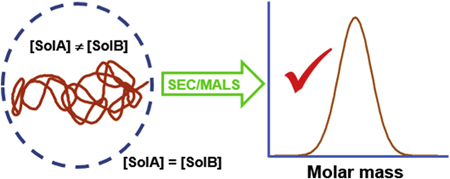
Graphical Abstract
1. Introduction
The molar mass (M) averages and distribution of macromolecules govern such processing and end-use properties as elongation, tensile strength, and adhesion resistance. Since the early 1960s, the chief method by which to determine the various averages and distributions, in a single experiment, has been size-exclusion chromatography (SEC) [1]. More recently, other size-based separation methods, most notably hydrodynamic chromatography (HDC) and flow field-flow fractionation, have emerged to complement SEC, especially in the realm of ultra-high M [2–4]. The original M information obtained from all these methods was, generally, calibrant-relative and, thus, of limited use. Since the 1980s, the availability of on-line static light scattering (SLS) detection has provided a means by which to determine absolute, non-calibrant-relative M averages and distributions, when on-line SLS is employed in conjunction with a concentration-sensitive detector such as a differential refractometer (DRI). The most popular incarnation of SLS is multi-angle static light scattering (MALS), which can also provide size (radius of gyration, RG) information about the analyte in solution and, when used off-line, can also inform our knowledge of dilute solution thermodynamics by providing the second virial coefficient (A2) of the solution [5]. Several modern LS instruments are also capable of performing quasi-elastic light scattering (QELS) measurements simultaneously to MALS measurements, thus giving additional information about the analyte such as its hydrodynamic or Stokes radius (RH).
Both SLS and DRI detection provide differential measurements. The former measures ΔR(θ), the difference in the Rayleigh factor (R), at a given angle θ, between the dilute macromolecular solution and the neat solvent, while the latter measures the difference in refractive index between solution and solvent. These types of measurements allow for subtraction of the solvent contribution to either scattering or refractometric measurements of the solution. Differential measurements generally preclude the use of mixed solvents, however, due to the preferential solvation of polymers in solution [6]: For example, a polymer dissolved in a 50:50 mix of solvents A and B may strongly prefer solvent A over solvent B such that, within the solvated volume of the polymer, the solvent ratio is A » B. In such case, the chromatographic baseline will not reflect an accurate contribution of the solvent mix to the scattering or refractometric response of the solution.
The consequences of such preferential solvation, as regards the calculation of molar mass from SEC/MALS/DRI experiments, enter principally because of the different refractive indices at the experimental condition of the two solvents in the mix and, thus, through the parameter known as the specific refractive index increment (∂n/∂c) of the solution, the change in the differential refractive index of the solution as a function of concentration [6–15]. (The ∂n/∂c may be considered the refractometric equivalent of the absorptivity in absorption spectroscopy experiments and, consequently, the same considerations which apply in the present discussion of DRI detection and ∂n/∂c will apply to UV/visible detection and absorptivity). The response of the DRI detector (DRIresp) is proportional to the product of concentration (c) and ∂n/∂c, as per:
| (1) |
In SLS experiments in general, and MALS experiments in particular, the ∂n/∂c term enters the calculation of molar mass through the optical constant K* in the Rayleigh-Gans-Debye approximation:
| (2) |
where Mw is the weight-average molar mass of the analyte; P(θ) is the particle scattering factor, which describes the angular dependence of the scattered light; and K* is defined as:
| (3) |
where, in turn, n0 is the refractive index of the solvent at the temperature and wavelength conditions of the experiment; λ0 is the vacuum wavelength of the incident radiation; and NA is Avogadro’s number. It should be noted that the proportionalities in equations (1) and (2) are converted into equalities via the calibration constants of the particular pieces of hardware employed for the measurements.
The specific refractive index increment ∂n/∂c is the change in the differential refractive index of the solution (i.e., the change in the difference between the refractive index of the solution and that of the solvent) as a function of concentration. Because of this, in mixed solvents the solvent baseline does not accurately represent the solvent contribution to the chromatographic peak of the analyte, creating a source of error for the molar mass averages and distributions calculated by SEC/MALS/DRI and for the Mw calculated from off-line, batch-mode MALS experiments. It is principally for this reason that mixed solvents are not employed in SEC/MALS/DRI experiments, nor when MALS is coupled on-line to the other size-based separations methods mentioned above (henceforth, these methods will remain implicit when discussing SEC). (It should be mentioned that detectors in which the solvent evaporates, evaporative mass detectors such as the so-called evaporative light scattering detector and the corona discharge detector, are actually mass-sensitive, not concentration-sensitive detectors. Furthermore, the response of these detectors is well-known to be non-linear and to possess a non-trivial dependence upon a large number of experimental factors. While highly useful and generally employed in interaction polymer chromatography experiments, they are of limited use in the accurate determination of M) [1].
There is, however, one notable exception to the above case, one which appears to have gone relatively unexplored to date in the chromatography of polymers literature (though not in the polymer literature in general) [12–15]: The “∂n/∂c-bias” which occurs because of preferential solvation can be avoided by the use of an isorefractive solvent pair, i.e., of a binary solvent mix in which each of the components has the same refractive index as the other at the experimental conditions. In such case, which we refer to here as the “trivial case,” preferential solvation will not be an issue because the solvent contribution to the DRI chromatographic peak is accurately reflected in the solvent baseline and the ∂n/∂c value will remain constant regardless of the degree of preferential solvation. Although index-matched solvents render the analysis trivial, the experiment is not as simple as it may at first seem. First, one must find an isorefractive solvent pair. Lists of such pairs can be found in the literature (e.g., in Ref. [16]). There are two caveats to these lists: Tabulations are not usually at the wavelength and temperature conditions of the SEC/MALS/DRI experiment (while temperature can be varied over a somewhat limited range in the hardware employed for these experiments, wavelength generally cannot, being restricted to the wavelength of the light sources in the MALS and DRI apparatus which, furthermore, should be the same or very similar for both pieces of equipment). Also, isorefractivity does not imply miscibility. One must thus find a solvent pair which is isorefractive at the temperature and wavelength of the experiment, and where the components are miscible with one another, preferably in all proportions to account for the unknown degree of preferential solvation which occurs within the solvated volume of the polymer. The solvents must not only be miscible with each other, but the solvent mix must also be able to dissolve the polymer. Lastly, once isorefractivity, miscibility, and solubility have been successfully determined, the solvent mix must be compatible with the packing material of the chromatographic column (or with membrane or fiber material in flow field-flow fractionation experiments), to minimize non-size-exclusion effects during the separation.
In addition to allowing the calculation of accurate M information by SEC/MALS/DRI in a special mixed solvent case, the present work has potential impact for the calculation of M from interaction polymer chromatography methods (e.g., gradient polymer elution chromatography or temperature gradient interaction chromatography [17–19]) by allowing the accurate use of MALS and DRI detection in such methods, and for the calculation of accurate M for polymers in mixed solvents where the individual solvents do not dissolve the polymer but a mixture of them does (see Table 7.5 and accompanying discussion in Ref. [1] for examples and detailed discussion of several such cases). Here, we detail an investigation into the trivial case using narrow M dispersity standards of polystyrene (PS) and poly(methyl methacrylate) (PMMA) and employing SEC/MALS/QELS/DRI, showing how accurate M averages can be obtained by SEC/MALS/DRI and also the additional information obtainable (along with the caveats involved) when on-line QELS detection is used. These studies are augmented by off-line MALS, QELS, and DRI experiments, as well as by nuclear magnetic resonance (NMR) spectroscopy experiments where appropriate, allowing discussion of not only the determination of molar mass but also of the role of preferential solvation on polymer size in solution and in dilute solution thermodynamics in mixed solvents, and of the role of tacticity on solubility.
2. Experimental
2.1. Materials
Narrow dispersity PS standards were purchased from PSS Polymer Standards Service (Mainz, Germany), Agilent/Polymer Laboratories (Amherst, USA), and Pressure Chemical Co., (Pittsburg, USA). Narrow dispersity PMMA standards were purchased from Agilent/Polymer Laboratories (Amherst, USA) and from Scientific Polymer Products (New York, USA). Technical grade tetrahydrofuran (THF) stabilized with 75 mg kg−1 to 400 mg kg−1 butylated hydroxytoluene (J. T. Baker, PA, USA) and 5-methyl-2-hexanone (Alfa Aesar, MA, USA) were used as received. The latter solvent is also known as methyl isoamyl ketone and is herein abbreviated as MIAK.
Commercial products are identified to specify adequately the experimental procedure. Such identification does not imply endorsement or recommendation by the National Institute of Standards and Technology, nor does it imply that the materials identified are necessarily the best available for the purpose.
2.2. SEC/MALS/QELS/DRI
Size-exclusion chromatography experiments were performed using an Agilent 1260 isocratic HPLC pump and autosampler (Agilent Technologies, Santa Clara, CA), the column oven of a Waters 2795 separations module (Waters Corp., Milford, USA), and an online degasser connected to a detector train consisting of a DAWN HELEOS-II MALS detector (Wyatt Technology Corp., Santa Barbara, CA) simultaneously measuring the scattered light at 16 angles with nominal values ranging from 28° to 147°; a QELS avalanche photodiode (Wyatt), in the same housing as the MALS unit, performing measurements at a nominal angle of 99.4° relative to the incident laser beam; followed by a T-rEX DRI detector (Wyatt). The wavelengths of operation of the MALS and T-rEX match each other to within 7 nm. A 0.22 µm inline Teflon filter was placed after the pump and before the injector.
One Agilent/Polymer Laboratories (Amherst, USA) PLgel 10 µm particle size, 104 Å nominal pore size, 300 mm × 7.5 mm column was employed for the separation of PS and PMMA samples. For the SEC experiments the following solvent ratios were used: THF:MIAK (100:0); (75:25); (50:50); (25:75); and (0:100). Flow rate was 1 mL min−1. The column oven and detector temperatures were maintained at 25.0 °C. 2 mg mL−1 dissolutions of the PS and PMMA samples were prepared in the different solvent compositions and 100 µL was injected into the SEC system. All measurements were performed at least in triplicate.
Normalization of the MALS detector (vacuum wavelength of incident light, λ0 = 664.5 nm), inter-detector alignment, and inter-detector band broadening correction were performed using a narrow dispersity () PS standard with Mw of 30000 g mol−1 (Pressure Chemical) at a concentration of 10 mg mL−1. For all the measurements MALS, QELS, and DRI data were collected and processed using Astra software (Wyatt, version 6.1.1.17).
2.3. Determination of absolute refractive index (aRI)
To measure the absolute refractive index (aRI) of a liquid using the Optilab T-rEX refractometer (the same detector employed in the multi-detector SEC experiments described above), the liquid must be present in both the sample and reference chambers of the detector. The purge valve should be ON and both chambers should be carefully flushed with the liquid to be measured. The detector was maintained at a temperature of 25.0 °C ± 0.1 °C. With the purge valve ON, the aRI of the liquid in the flow cell is displayed in the “aRI” tab on the Optilab T-rEX front panel. After purging the refractometer with the solvent for 10 min at 1 mL min−1 the absolute refractive index was measured. At each solvent composition the aRI was measured at least in triplicate and average values were obtained. The detailed procedure for performing this measurement is described in Ref. [20]. The obtained aRI values are given in Table 1 and demonstrate that THF and MIAK are isorefractive at the temperature and wavelength conditions of the experiment, as are mixtures of the two solvents ranging from 0% to 100% in each.
Table 1.
Absolute refractive index (aRI) and viscosity of neat solvents and solvent mixes employed in SEC/MALS/QELS/DRI and off-line experiments.
| THF:MIAK | aRI | Viscosity (g m−1 s−1) |
|---|---|---|
| 100:0 | 1.4028 ± 0.0001 | 0.456 |
| 75:25 | 1.4032 ± 0.0002 | 0.515 |
| 50:50 | 1.4035 ± 0.0004 | 0.589 |
| 25:75 | 1.4030 ± 0.0000 | 0.671 |
| 0:100 | 1.4028 ± 0.0000 | 0.770 |
THF:MIAK values correspond to volume percentages. All aRI values constitute averages based on at least triplicate determinations (except for 50:50 mix, which is based on seven measurements), with uncertainties corresponding to one standard deviation. Viscosity values for mixes based on SEC pressure data and on viscosities of neat solvents, as described in text. All measurements were performed at 25.0 °C; aRI measurements performed at λ0 = 658 nm.
2.4. Off-line, batch-mode DRI: determination of ∂n/∂c
PS420, PMMA100, and PMMA800 were used for specific refractive index increment (∂n/∂c) determination. The samples were dissolved in mixes of THF and MIAK ranging from 0% to 100% in each at 25% intervals; at least five dissolutions were employed at concentrations ranging from 0.5 mg mL−1 to 5 mg mL−1. The off-line, batch-mode DRI experiments were performed in conjunction with their MALS counterparts (next subsection), with both detectors coupled to each other off-line from the SEC system; the coupled method is described fully in Ref. [21]. Each dilution of PS and PMMA prepared in each different solvent composition was injected directly into the detectors (the same refractometer and LS photometer as employed in the on-line experiments) using a Razel model A-99EJ syringe pump at a flow rate of 0.1 mL min−1; detectors were maintained at 25.0 °C ± 0.1 °C. The samples and neat solvent compositions were gently filtered before measurement using 0.22 µm Teflon syringe filters (VWR, Radnor, PA). Astra software (Wyatt, version 6.1.1.17) was used for data collection and processing. The differential refractive index data of PS and PMMA were plotted against concentration and the ∂n/∂c values, which are given in Table 2, were obtained from the slopes of these plots [22].
Table 2.
Specific refractive index increment ∂n/∂c of PS and PMMA in solvents used.
| THF:MIAK | PS420 | PMMA100 |
|---|---|---|
| 100:0 | 0.194 ± 0.002 | 0.0853 ± 0.0015 |
| 75:25 | 0.194 ± 0.004 | 0.0833 ± 0.0033 |
| 50:50 | 0.194 ± 0.005 | 0.0866 ± 0.0036 |
| 25:75 | 0.195 ± 0.002 | 0.0879 ± 0.0018 |
| 0:100 | 0.194 ± 0.004 | (0.0852 ± 0.0003)a |
All results in mL g−1. Temperature: 25.0 °C ± 0.1 °C; λ0 = 658 nm. Uncertainties correspond to instrumental standard deviations. In all cases, at least five different sample dissolutions were employed, across a concentration range of approximately 0.5 mg mL−1 to 5 mg mL−1; see Experimental for details.
The ∂n/∂c of PMMA in 100% MIAK (0:100 THF:MIAK) was determined with an 800000 g mol−1 PMMA (PMMA800) because of insolubility of PMMA100 in 100% MIAK due to tacticity issues; see Experimental and Results and Discussion for details.
2.5. Off-line, batch-mode MALS and QELS: determination of A2, and of off-line Mw, RG,z, and RH,z
The same experimental set-up and sample dissolutions employed for the off-line, batch-mode DRI experiments described in the previous subsection were employed for off-line, batch-mode MALS and QELS experiments. The solutions were injected directly into the light scattering photometer, which was connected on-line to the refractometer, as described in Ref. [21]. MALS data, from at least 8 different angles but usually more than this, were processed using either a random coil or Zimm formalism, as implemented in the Astra software, using a first degree fit for both angle and concentration. The MALS and QELS detectors are contained in the same housing, which was maintained at 25.00 °C ± 0.01 °C using a Peltier apparatus. The QELS avalanche photodiode is placed at a nominal angle of 99.4° relative to the incidental laser beam.
Batch-mode QELS measurements provide the z-average translational diffusion coefficient (DT,z) of the analyte in solution, from which the z-average hydrodynamic radius (RH,z) is calculated via equation (4):
| (4) |
where kB is Boltzmann’s constant, T is the absolute temperature, and η0 is the viscosity of the solvent at the experimental temperature. The viscosities of neat THF and MIAK at 25 °C can be found in the literature (e.g., from Ref. [23], the solvents’ technical data sheets, or www.viscopedia.com). Because viscosity will change with solvent composition, we used the viscosity values for neat THF and MIAK at the experimental temperature in conjunction with the measured SEC system backpressure at each solvent composition to determine the viscosity η0,mix of each mix using the mixing rule for one-phase binary mixtures [24]:
| (5) |
where ϕ corresponds to the volume fraction of each component in the particular mix and I is an interaction parameter which can be positive or negative depending on the system. The last term on the right side of the equation thus represents the concentration-dependent interaction between two different chemical species. From the backpressure data at the various solvent ratios we used Poiseuille’s law to calculate I = (−0.162 ± 0.033) g m−1 s−1. The viscosities of neat THF and MIAK, as well as of the various solvent mixes, are given in the last column of Table 1.
2.6. 1H NMR
The NMR experiments were conducted at a temperature of 25 °C using a Bruker Avance 600 MHz spectrometer (Bruker BioSpin GmbH, Rheinstetten, Germany) equipped with a 5-mm broadband inverse (BBI) detection probe and operating with Topspin (Version 3.2) software. The one-dimensional 1H NMR measurements were performed employing a 90° single-pulse sequence for 16 scans with a 10 s recycle delay. 5 mg of PMMA were dissolved in 0.7 mL CDCl3.
3. Results and discussion
3.1. Determination of solvent miscibility
The mutual miscibility of MIAK with THF does not appear to have been tabulated. Given the known miscibility of various methyl alkyl ketones (e.g., methyl ethyl ketone, methyl t-butyl ketone) with THF, it appeared logical to expect MIAK and THF to be mutually soluble. This miscibility was confirmed visually for 75:25, 50:50, and 25:75 mixes of MIAK:THF. In all cases the mixes appeared as one-phase, clear solutions which did not separate after prolonged periods.
3.2. Determination of solvent isorefractivity
It has long been known that even a small refractive index difference among the solvent components of a mix can greatly affect the molar mass determination for polymers in mixed solvents. For example, classic work on PMMA and polycaprolactam by Kratochvíl and colleagues demonstrated that due to selective adsorption (i.e., to preferential solvation of the polymer by one solvent in the mix over the other), even an ≈ 0.01 difference in the refractive indices of the components of a two-solvent mix could lead, in some cases, to underestimating Mw by as much as 44%, while in other cases Mw was overestimated by as much as 23% [8,9]. Because of this, the criterion established herein for isorefractivity is that the absolute refractive index (aRI) of solvents or solvent mixes should differ from one another by, on average, no more than 0.001 refractive index units. To begin, candidate solvents with similar refractive index (RI) were chosen from the Refractive Index table in Ref. [23]. Known solubility issues (e.g., PS and/or PMMA being insoluble in a particular solvent) allowed us to eliminate various solvents and, thus, solvent pairs, from the list. The tabulated RI of THF and MIAK are very similar to each other, though it should be mentioned that these are values, i.e., determined at 20 °C and at a wavelength of 589.29 nm corresponding to the average wavelength of the sodium D-line doublet. This wavelength is different from the vacuum wavelengths of our light sources, 658 nm for the refractometer and 664.5 nm for light scattering photometer. To more finely adjust the difference in aRI values of the two solvents at the experimental wavelength, the refractometer temperature was varied in 1.0 °C increments until an average aRI difference of <0.001 was obtained. Indeed, at 25.0 °C the aRI of the two neat solvents are indistinguishable from each other and the aRI of all of the solvents employed, neat and mixed, differ from each other by < 0.001 (Table 1).
3.3. Determination of PS and PMMA solubility; quantitating SEC column recovery
To ensure that both PS and PMMA would be soluble in the neat solvents and their mixes, regardless of molar mass, dissolution was attempted using an ultra-high M standard of each material, a PS with a nominal M of 20 × 106 g mol−1 and a PMMA with nominal M of 1.5 × 10⁶ g mol−1. Per visual inspection, both polymers appeared to dissolve in all solvents/mixes (solutions were clear and of one phase, with no visible undissolved polymer). While not conclusive evidence, this simple experiment did provide strong circumstantial evidence as to the solubility of PS and PMMA in THF, MIAK, and their mixes. Much stronger evidence was subsequently obtained from the column recoveries of the various polymers. As can be seen in the “% Recovery” column of Table 3 through 7, recovery in all cases can be considered quantitative, always >95% (average recovery across all chromatographic runs was 99% ± 3%). Had the polymers not fully dissolved, it is highly doubtful such high column recoveries could have been obtained. (Recovery calculations were based on the known solution concentration of the analytes, the known injection volume onto the SEC column, and the off-line measured ∂n/∂c of the solutions).
Table 3.
Molar mass and hydrodynamic size of PS100 in various solvents, obtained by SEC/MALS/QELS/DRI.
| THF:MIAK | Mn | Mw | Mz | Ð | RH,z | % Recovery |
|---|---|---|---|---|---|---|
| 100:0 | 102000 | 103000 | 103000 | 1.01 | 8.6 ± 0.1 | 95 |
| 75:25 | 101000 | 102000 | 103000 | 1.01 | 8.3 ± 0.1 | 102 |
| 50:50 | 102000 | 102000 | 103000 | 1.00 | 7.8 ± 0.1 | 95 |
| 25:75 | 101000 | 102000 | 104000 | 1.01 | 7.3 ± 0.1 | 97 |
| 0:100 | 102000 | 102000 | 102000 | 1.00 | 6.8 ± 0.1 | 96 |
Molar masses in g mol−1, RH,z in nm. Averages and standard deviations, based on at least triplicate analyses, are in all cases less than ±1000 g mol−1 for molar mass, less than ±0.01 for Ð, less than ±1% for % Recovery. See Section 2 for details.
Table 7.
Molar mass and size of PMMA400 in various solvents, obtained by SEC/MALS/QELS/DRI.
| THF:MIAK | Mn | Mw | Mz | Ð | RG,z | RH,z | % Recovery |
|---|---|---|---|---|---|---|---|
| 100:0 | 391000 ± 3000 | 401000 ± 2000 | 415000 ± 1000 | 1.02 ± 0.01 | 24 | 16 | 95 |
| 75:25 | 381000 ± 3000 | 390000 ± 2000 | 397000 ± 1000 | 1.02 ± 0.01 | 23 | 16 | 99 |
| 50:50 | 376000 ± 4000 | 391000 ± 1000 | 400000 ± 2000 | 1.04 ± 0.01 | 23 | 14 | 99 |
| 25:75 | 378000 ± 5000 | 391000 ± 2000 | 399000 ± 2000 | 1.03 ± 0.01 | 21 | 13 | 99 |
| 0:100 | 370000 ± 4000 | 389000 ± 2000 | 409000 ± 3000 | 1.05 ± 0.01 | 15 | 11 | 98 |
Molar masses in g mol−1, RG,z and RH,z in nm. Averages and standard deviations are based on at least triplicate analyses; where no value is given, it represents a precision of less than ±1000 g mol−1 for molar mass, less than ±1 nm for RG,z or RH,z, and less than ±1% for % Recovery. See section 2 for details.
3.4. Absolute molar mass averages and dispersities
The number-, weight, and z-average molar masses (Mn, Mw, and Mz, respectively) and molar mass dispersities (Ð ≡ Mw/Mn) of the various PS and PMMA examined, as obtained by SEC/MALS/DRI, are given in Table 3 through 7. Also given for PMMA100 and PS420 are the Mw obtained by off-line, batch-mode MALS. As can be seen, little difference exists between the various averages and dispersities when comparing across solvent composition (the reason why no values are given for PMMA100 in 100% MIAK is explained in Section 3.6 below), and all values were found to closely match those obtained in neat THF, a known solvent for both PS and PMMA and a common SEC mobile phase. Also, little difference is observed between the Mw obtained by on- and off-line MALS across solvent composition.
That the calculated molar mass is independent of solvent composition is also seen in Fig. 3. While the chromatograms of PMMA400 tend to shift to larger retention volumes as a function of increasing MIAK content in the solvent (Fig. 3A,B explained in the next subsection), the molar mass across the chromatograms remains constant with changing THF:MIAK ratio (Fig. 3C where, for ease of comparison, retention time has been normalized to that of the chromatogram obtained in 100% THF).
Fig. 3.

PMMA400: Overlay of (A) DRI chromatograms, (B) 90° MALS photodiode chromatograms. (C) DRI chromatograms normalized to retention time in 100:0 THF:MIAK, with M across chromatograms overlaid upon DRI traces.
The degree of preferential solvation of PS and PMMA by one solvent over another is unknown in the various solvent mixes. However, given the A2 values in Tables 4 and 5 (as well as other size evidence discussed below, in the next subsection), it appears that THF is a better solvent for both polymers than is MIAK. Because of this, the solvated volume occupied by a given PS or PMMA chain will be enriched in (the chain will be preferentially solvated by) THF over MIAK as compared to the nominal ratio of these solvents in the mix. The solvent baseline in a chromatogram obtained in a solvent mix would not, under circumstances other than those described in this paper, accurately represent the solvent contribution to the MALS and DRI chromatograms. However, the use of a mix of isorefractive solvents obviates this preferential solvation issue with respect to the determination of absolute molar mass as it dispenses with any ∂n/∂c-bias issues resulting from equations (1)–(3). The ∂n/∂c-bias, had it occurred, would have manifested itself more greatly in the off-line-MALS-determined Mw than in its on-line counterpart, as Mw depends on the square of the ∂n/∂c term in off-line MALS experiments, but only on the first power of ∂n/∂c in on-line SEC/MALS/DRI experiments [22].
Table 4.
Molar mass, RG, RH, and A2 of PS420 in various solvents, obtained by SEC/MALS/QELS/DRI and off-line MALS and QELS.
| THF:MIAK | Mn | Mw | Mw (off-line) | Mz | Ð | RG,z | RG,z (off-line) | RH,z | RH,z (off-line) | A2 ( × 10−4, off-line) | % Recovery |
|---|---|---|---|---|---|---|---|---|---|---|---|
| 100:0 | 416000 ± 1000 | 419000 ± 1000 | 421000 ± 1000 | 424000 ± 3000 | 1.01 | 29 | 28 ± 1 | 20 | 19 | 4.11 ± 0.25 | 97 |
| 75:25 | 412000 ± 5000 | 415000 ± 5000 | 426000 | 420000 ± 8000 | 1.01 ± 0.02 | 28 | 26 ± 1 | 18 | 18 ± 1 | 3.13 ± 0.04 | 99 ± 2 |
| 50:50 | 427000 ± 1000 | 430000 | 433000 ± 6000 | 436000 ± 2000 | 1.01 | 28 | 28 ± 2 | 17 | 17 | 1.43 ± 0.00 | 95 |
| 25:75 | 427000 ± 1000 | 430000 ± 1000 | 435000 ± 3000 | 437000 | 1.01 | 26 | 27 | 16 | 16 | 1.17 ± 0.01 | 99 |
| 0:100 | 422000 ± 3000 | 427000 ± 2000 | 420400 ± 1000 | 441000 ± 6000 | 1.01 ± 0.01 | 20 | 23 | 14 | 14 | 0.658 ± 0.015 | 98 |
All values determined by on-line SEC/MALS/QELS/DRI, unless noted as “off-line.” Molar masses in g mol−1, RG,z and RH,z in nm, A2 in mol mL g−2. Averages and standard deviations are based on at least triplicate analyses; where no value is given, it represents a precision of less than ±1000 g mol−1 for molar mass, less than ±0.01 for Ð, less than ±1 nm for RG,z or RH,z, and less than ±1% for % Recovery. For off-line analyses, precisions represent instrumental standard deviation. See Section 2 for details.
Table 5.
Molar mass, RG, RH, and A2 of PMMA100 in various solvents, obtained by SEC/MALS/QELS/DRI and off-line MALS and QELS.
| THF:MIAK | Mn | Mw | Mw (off-line) | Mz | Ð | RH,z | RH,z (off-line) | A2 ( × 10−4, off-line) | % Recovery |
|---|---|---|---|---|---|---|---|---|---|
| 100:0 | 101000 ± 1000 | 101000 ± 1000 | 100000 | 102000 | 1.00 ± 0.01 | 7.0 ± 0.3 | 7.5 ± 0.2 | 2.19 ± 0.002 | 97 ± 1 |
| 75:25 | 96000 ± 2000 | 97000 ± 2000 | 101000 ± 1000 | 98000 ± 2000 | 1.01 ± 0.03 | 6.4 ± 0.1 | 7.1 ± 0.4 | 2.37 ± 0.03 | 104 ± 3 |
| 50:50 | 100000 ± 1000 | 100000 | 102000 ± 1000 | 100000 ± 1000 | 1.00 ± 0.01 | 6.1 ± 0.3 | 6.6 ± 0.1 | 2.04 ± 0.04 | 101 |
| 25:75 | 101000 | 101000 | 102000 | 101000 | 1.00 | 6.2 ± 0.5 | 7.3 ± 1.3 | −29.1 ± 3.1 | 108 |
| 0:100 | – | – | – | – | – | – | – | – | – |
All values determined by on-line SEC/MALS/QELS/DRI, unless noted as “off-line.” Molar masses in g mol−1, RH,z in nm, A2 in mol mL g−2. Averages and standard deviations are based on at least triplicate analyses; where no value is given, it represents a precision of less than ±1000 g mol−1 for molar mass, less than ±0.01 for Ð, and less than ±1% for % Recovery. For off-line analyses, precisions represent instrumental standard deviation. See section 2 for details. No values given at 0:100 THF:MIAK due to the insolubility of this sample in 100% MIAK; see Section 3.6 for discussion.
One issue that has not been discussed thus far is the error in M determination by SEC/MALS/DRI that might result from preferential solvation in mixed solvent, attributable to the difference in the Rayleigh factors of the two solvents in the mix. In theory, preferential solvation could mean that the Rayleigh factor within the solvated volume of a polymer chain in a solvent mix is different from the Rayleigh factor of the solvent mix well outside this volume. This would mean that the baselines from the various photodiodes of the MALS detector do not accurately represent the solvent contribution to the MALS chromatograms obtained at each angle by each photodiode. (This would also apply to the signal from the QELS photodiode). We examine this now.
We analyzed a series of mixes of THF and MIAK, ranging from 0% MIAK to 100% MIAK in 20% increments. Fig. 1A shows the detector voltages (which are directly proportional to the Rayleigh factor) of the MALS photodiodes placed at 22.4°, 90°, and 151.4° (the first and last of these correspond to the smallest and largest angles at which measurements are possible with the MALS hardware employed herein); the figure legend explains which time interval corresponds to which solvent mix. The ordinates have been scaled to that of a typical MALS chromatogram for an analyte in this study. At any of the three angles, drift or change in the baselines as a function of solvent composition is barely discernible (the occasional spikes that are seen in the signals occurred as a result of changing syringes with each solvent composition, as the experiments were performed in a manner akin to the off-line, batch-mode MALS experiments described in the Experimental). While certainly minor, a MALS baseline change as a function of solvent composition is definitely detectable. As seen in Fig. 1B, which is a zoomed-in view of the 90° MALS photodiode trace, the MALS baseline increases as a function of increasing volume percentage of MIAK in the mix. (While we have not been able to find a tabulated value for the Rayleigh factor of MIAK in the literature, it would appear that this value should be higher than that of THF at the same experimental conditions). Across all angles, the baseline change as a function of solvent composition was found to be ≤ 7%. If we assume, for the sake of discussion, a somewhat extreme hypothetical case such as a polymer dissolved in a 25:75 THF:MIAK mix, but where the solvent ratio within the solvated volume is 90:10 THF:MIAK, this results in a difference of, at most, ≈ 4% in the Rayleigh factors inside versus outside this volume. We conclude that, extreme cases (i.e., those comprising a mix of solvents with very different Rayleigh factors from each other) notwithstanding, the difference in composition can generally be neglected when evaluating the Rayleigh factor of a mixed solvent.
Fig. 1.
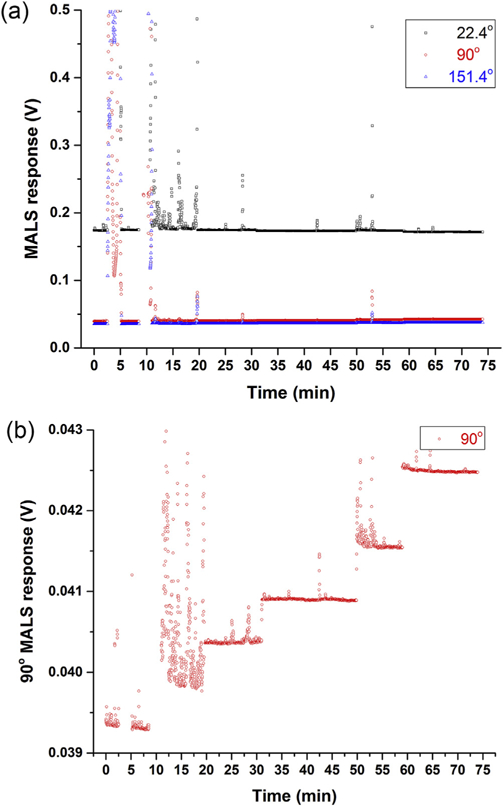
(A) Overlay of MALS response as a function of THF:MIAK ratio, for photodiodes placed at 22.4° (black open squares), 90° (red open circles), and 151.4° (blue open triangles), relative to the incidental laser beam. Ordinate has been scaled to that of typical polymer chromatogram in this study. (B) Zoomed-in view of trace from 90° photodiode. THF:MIAK ratios as a function of time: 0 mine8.5 min: 100:0; 8.5 min–19.7 min: 80:20; 19.7 min–31.0 min: 60:40; 31.0 min–50.0 min: 40:60; 50.0 min–59.0 min: 20:80; 59.0 min–74.0 min: 0:100. (For interpretation of the references to colour in this figure legend, the reader is referred to the Web version of this article.)
As such, we see that accurate values of M can be obtained using SEC/MALS/DRI in mixed solvents, provided the solvents are not only isorefractive but also mutually miscible, that the polymer is soluble in the solvent mix, and that the mix is a good chromatographic mobile phase.
3.5. Dilute solution thermodynamics and size as a function of solvent composition
Much of the power of multi-detector SEC experiments lies in the abundance of information they can provide in addition to molar mass averages and related macromolecular properties [1,25–28]. We proceed now to examine the size information provided by the on-line MALS and QELS detectors (and, indirectly, by the DRI chromatograms), how this information compares and is augmented by off-line LS analyses, and how all these data can inform our knowledge of the thermodynamics of the dilute polymer solutions and the changes therein as a function of solvent composition.
The first evidence that the size of PS and PMMA decreases with increasing MIAK content in the solvent mix comes from the SEC chromatograms themselves. As can be seen in Figs. 2 and 3 for PS420 and PMMA400, respectively, the chromatograms shift to larger elution volumes with increasing percentage MIAK. Because in SEC larger analytes elute ahead of smaller ones, this shift in retention volume can be interpreted as PS and PMMA “shrinking” (i.e., occupying smaller hydrodynamic volumes) the more MIAK there is in the solvent mix. The shift in analyte retention volumes is substantially larger than is the shift in total exclusion and total permeation volumes with changing solvent ratio, meaning the shift in analyte chromatograms is due chiefly to a change in hydrodynamic volume, not to a swelling or shrinking of the column packing particles and of their pores as a function of THF:MIAK ratio.
Fig. 2.

PS420. Solid lines: Overlay of chromatograms, as measured by 90° MALS photodiode, at the various THF:MIAK ratios examined. Symbols: Overlay of RG across chromatograms at various THF:MIAK ratios examined.
In the case of PS, we note that the size of both PS100 and PS420 decreases as a function of increasing MIAK percentage in the solvent mix. (For PS420 size corresponds here to both RG and RH, while for PS100 we were unable to accurately and precisely measure RG due to insufficient angular dissymmetry). On- and off-line-determined values of RG,z and RH,z agree well with each other, and both sets of values display the same solvent-dependent trend (see Tables 3 and 4). The trend is also observed in Fig. 2 in the RG traces, which are overlaid upon each chromatogram in each solvent. All this would appear to indicate that THF is a thermodynamically better solvent for PS than is MIAK. This conclusion is corroborated by the off-line-MALS-measured A2 values, given in the penultimate column of Table 4: A2 is seen to decrease as a function of increasing MIAK content, indicating the latter is a poorer solvent for PS than is THF.
From Table 5 through 7 we gather that the same is true for PMMA as it is for PS. RH and, where possible to measure, RG both decrease as a function of increasing MIAK content in the solvent mix. The A2 values for a solution of PMMA100 show that, already at 75% MIAK the solvent has become a thermodynamically poor one, with A2 taking on a negative value. The off-line MALS – and DRI – experiments are quite sample intensive; as such, we conducted these experiments only on the polymers for which we had sufficient sample, namely PS420 and PMMA100. From Fig. 3A, C we observe that while no extraneous, early eluting peaks are observed in any of the DRI chromatograms of PMMA400, such a peak can be observed in the 90° MALS chromatogram of this polymer in 100% MIAK, indicating that aggregation (even if present at a very low concentration, as evinced by the lack of an aggregate peak in the DRI chromatogram obtained in 100% MIAK) occurs for PMMA in this solvent.
As regards the hydrodynamic radius RH, as seen in equation (4) it is calculated from the measured translational diffusion coefficient DT of the analyte which, in turn, depends on the viscosity of the solvent. Table 1 shows that the viscosity of MIAK is greater than that of THF, and that the viscosity of the solvent mixes increases as a function of increasing MIAK content. This begs the questions as to whether the change in RH as a function of solvent composition is merely due to a change in the viscosity of the solvent, or whether it is due to a difference in the ability of each solvent to solvate the polymer chain. (For two solvents with different viscosities but with equal ability to solvate a polymer, the analyte’s RH would be the same in each solvent but its DT in each would be different). To evaluate this, we first calculate the friction coefficient f of each analyte, defined as per:
| (6) |
where all the symbols retain their same meanings as in Section 2.5. The viscosity-normalized friction coefficient f/η, where η is the viscosity of either the neat solvent or the solvent mix as given in Table 1, was then plotted as a function of η for each analyte. As seen in Fig. 4, in each case the ratio f/η decreases as a function of increasing η, which indicates that the polymers are contracting in size (“shrinking”) as a function of increasing MIAK content in the mix, with size here referring to RH. (As regards PMMA100 in Fig. 4C, no value is given for η = 0.770 g m−1 s−1, corresponding to 100% MIAK, due to the insolubility of this analyte in this solvent; see next section for details. Also, the poor solvent nature of the 25:75 THF:MIAK mix for PMMA100, evidenced by the negative A2 value in Table 5, manifests itself in a slight rise in the f/η versus η relation at this solvent composition).
Fig. 4.

Change in viscosity-normalized friction coefficient as a function of increasing solvent (or solvent mix) viscosity. Data points constitute averages from at least triplicate determinations, with error bars representing one standard deviation from the mean. (A) PS100, (B) PS420, (C) PMMA100, (D) PMMA400.
3.6. Insolubility of PMMA100 in 100% MIAK; tacticity issues
As can be seen in Table 5, no values for molar mass, size, etc. are given for PMMA100 (Mw ≈ 100000 g mol−1) in 100% MIAK. The reason for this absence of results is that PMMA100 was found to be insoluble in 100% MIAK. This insolubility is a somewhat counter-intuitive observation given that, as mentioned earlier, PMMA solubility was initially evaluated in all solvent compositions employing an ultra-high-M PMMA with a nominal molar mass of 1.5 × 10⁶ g mol−1. Also, no solubility issues were encountered with any of the other PMMAs examined (though, as noted above, some aggregation could be observed with the MALS detector for PMMA400 in 100% MIAK).
It occurred to us that the reason for the insolubility of PMMA100 in 100% MIAK could be due to tacticity issues, specifically, to a significant amount of isotactic PMMA present in what was, supposedly, an atactic sample. To that end, we attempted to dissolve an isotactic PMMA previously characterized by us (Mw = 280000 g mol-1, Ð = 3.12 [29]) in 100% MIAK, and found this isotactic sample to be insoluble in this solvent. Our next step was to employ 1H NMR to measure the amount of isotactic triads present in PMMA100. Through this technique we were able to determine that PMMA100, far from being 100% atactic (as claimed by the manufacturer), actually possesses 30% ± 4% isotactic triads, the latter being responsible for the insolubility of this sample in 100% MIAK. As seen in Table 6, PMMA116, with an M only slightly higher than that of PMMA100, was found to be soluble in 100% MIAK (unfortunately, we did not have sufficient PMMA116, nor PMMA400 which was also found to be soluble in 100% MIAK, for the off-line, batch-mode analyses).
Table 6.
Molar mass of PMMA116 in various solvents, obtained by SEC/MALS/DRI.
| THF:MIAK | Mn | Mw | Mz | Ð | % Recovery |
|---|---|---|---|---|---|
| 100:0 | 115000 | 116000 | 120000 ± 1000 | 1.01 | 99 ± 1 |
| 75:25 | 114000 ± 1000 | 116000 ± 1000 | 121000 ± 3000 | 1.02 ± 0.01 | 101 ± 1 |
| 50:50 | 118000 ± 2000 | 120000 ± 2000 | 120000 ± 3000 | 1.02 ± 0.02 | 97 |
| 25:75 | 113000 ± 1000 | 114000 ± 1000 | 114000 ± 1000 | 1.01 ± 0.01 | 101 |
| 0:100 | 112000 ± 1000 | 114000 ± 1000 | 116000 ± 2000 | 1.02 ± 0.01 | 95 |
Molar masses in g mol−1. Averages and standard deviations are based on at least triplicate analyses; where no value is given, it represents a precision of less than ±1000 g mol−1 for molar mass, less than ±0.01 for Ð, and less than ±1% for % Recovery. See section 2 for details.
4. Conclusions
We have demonstrated here that accurate molar mass information can be obtained by SEC/MALS/DRI in mixed solvents, provided the solvents in the mix are isorefractive. Other caveats include the need (1) for the solvents to be miscible with one another in all proportions, (2) for the mix to be a solvent for the macromolecule being examined, (3) for the solution to have sufficient optical contrast with the solvent so as to generate chromatographic peaks with high and reproducible signal-to-noise ratios, and (4) for the solvent mix to be a good chromatographic mobile phase that does not induce meaningful non-size-exclusion interactions between the analyte and the SEC column packing material. For dilute solutions such as those employed in chromatography experiments, the difference in the Rayleigh factors of the solvents does not appear to have a measurable influence on the calculated molar masses (though this may not hold true when there is a particularly large difference in Rayleigh factors among solvents in the solvent mix).
The accuracy of this approach was demonstrated here for various PS and PMMA polymers over a four-fold molar mass range using THF and MIAK, solvents which are isorefractive at the solvent, temperature, and wavelength conditions of the experiments conducted. The chromatography experiments, which also included an on-line QELS detector, were performed in solvents ranging from 0% to 100% THF and vice-versa for MIAK. These on-line experiments were augmented by off-line MALS, QELS, and DRI measurements. Molar mass averages and dispersities were found to be solvent-independent and to match closely the values obtained in neat THF, though this was not the case for polymer size. The latter, as measured by RG or RH or even, qualitatively, by SEC elution volume, was observed to decrease with increasing MIAK content in the solvent, indicating that MIAK is a poorer solvent for both PS and PMMA than is THF. This conclusion was corroborated by the decrease in A2 values of select PS and PMMA solutions as the MIAK content in the solvent mix increased, and by a steady decrease in the viscosity-normalized polymeric friction factor as a function of increasing solvent, or solvent mix, viscosity. 1H NMR experiments assisted in showing that one of the supposedly atactic PMMA samples possessed a considerable percentage of isotactic triads, which were found responsible for the insolubility of this sample in 100% MIAK.
The value of the present experiments lies not only in demonstrating how accurate determination of M can be performed by SEC/MALS/DRI in mixed solvents. The study also opens the door for the use of combined MALS and DRI detection in so-called interaction polymer chromatography techniques, where the use of mixed solvents is common, and also allows for the possibility of accurate M determination when employing a solvent mix which is a good solvent for a polymer whereas each individual solvent is a non-solvent.
HIGHLIGHTS.
Absolute molar mass determination for polymers in mixed solvents.
Determination is normally compromised by selective solvation of polymer coil.
Selective solvation can be circumvented by use of isorefractive solvent pair.
Size-exclusion chromatography can successfully address experimental issues.
On-line light scattering and refractometry detection are needed.
Acknowledgments
The authors are grateful to Prof. Wayne Reed (Tulane University) for helpful discussions during the planning stages of this work, to Prof. Paul Russo (Georgia Institute of Technology) for reading and commenting upon an early draft of this manuscript, and to Dr. Michael Nelson (NIST) for assistance with planning and interpretation of 1H NMR experiments.
References
- [1].Striegel AM, Yau WW, Kirkland JJ, Bly DD, Modern Size-exclusion Liquid Chromatography, second ed., Wiley, 2009. [Google Scholar]
- [2].Striegel AM, Hydrodynamic chromatography: packed columns, multiple detectors, and microcapillaries, Anal. Bioanal. Chem 402 (2012) 77–81. [DOI] [PubMed] [Google Scholar]
- [3].Striegel AM, Brewer AK, Hydrodynamic chromatography, Annu. Rev. Anal. Chem 5 (2012) 15–34. [DOI] [PubMed] [Google Scholar]
- [4].Podzimek S, Light Scattering, Size Exclusion Chromatography and Asymmetric Flow Field Flow Fractionation, Wiley, 2011. [Google Scholar]
- [5].Wyatt PJ, Light scattering and the absolute characterization of macromolecules, Anal. Chim. Acta 272 (1993) 1–40. [Google Scholar]
- [6].Ewart RH, Roe CP, Debye P, McCartney JR, The determination of polymer molecular weights by light scattering in solvent-precipitant systems, J. Chem. Phys 14 (1946) 687–695. [Google Scholar]
- [7].Yamakawa H, Light scattering from solutions of polymers in mixed solvents, J. Chem. Phys 46 (1967) 973–981. [Google Scholar]
- [8].Tuzar Z, Kratochvíl P, Bohdanecký M, A light-scattering study of the molecular parameters of polycaprolactam, J. Polym. Sci. C 16 (1967) 633–642. [Google Scholar]
- [9].Tuzar Z, Kratochvíl P, Light scattering. XVIII. The behavior of polymers in mixed solvents, Collect. Czech Chem. Commun 32 (1967) 3358–3370. [Google Scholar]
- [10].Kratochvíl P, Tuzar Z, Notes on differential refractometry and light scattering of polymer or copolymer solutions in mixed solvents, Chem. Zvesti 25 (1971) 190–195. [Google Scholar]
- [11].Casassa EF, Interpretation of Rayleigh scattering by polymers in mixed solvents, Makromol. Chem 150 (1971) 251–254. [Google Scholar]
- [12].Casassa EF, Remarks on light scattering from polymers in mixed solvents: effects of polymer molecular weight, molecular weight distribution, and solvent composition, Polym. J 3 (1972) 517–525. [Google Scholar]
- [13].Aminabhavi TM, Munk P, Excess polarizability and volume of mixing and their effect on the partial specific volume and the refractive increment of polymers in mixed solvents, Macromolecules 12 (1979) 1186–1194. [Google Scholar]
- [14].Mourey TH, Bryan TG, Greener J, J. Size-exclusion chromatography of poly(ethylene terephthalate) and related polymers in methylene chloridedichloroacetic acid, J. Chromatogr. A 657 (1993) 377–385. [Google Scholar]
- [15].Strazielle C, Light scattering in mixed solvents, in: Huglin MB (Ed.), Light Scattering from Polymer Solutions, Academic Press, 1972, pp. 633–669. [Google Scholar]
- [16].Elias H-G, Isorefractive and isopycnic solvent pairs, in: Brandup J, Immergut EH, Grulke EA (Eds.), Polymer Handbook, fourth ed., Wiley, 1999, pp. III/43–III/54. [Google Scholar]
- [17].Striegel AM, Determining the vinyl alcohol distribution in poly(vinyl butyral) using normal-phase gradient polymer elution chromatography, J. Chromatogr. A 971 (2002) 151–158. [DOI] [PubMed] [Google Scholar]
- [18].Striegel AM, Determining and correcting “moment bias” in gradient polymer elution chromatography, J. Chromatogr. A 996 (2003) 45–51. [DOI] [PubMed] [Google Scholar]
- [19].Hutchings LR, Complex branched polymers for structure-property correlation studies: the case for temperature gradient interaction chromatography analysis, Macromolecules 45 (2012) 5621–5639. [Google Scholar]
- [20].Optilab T-rEX and UT-rEX user’s guide, Wyatt Technology Corp, 2014. [Google Scholar]
- [21].Haidar Ahmad IA, Striegel AM, A coupled MALS-DRI method for simultaneous Zimm and ∂n/∂c plot construction, Instrum. Sci. Technol 37 (2009) 574–583. [Google Scholar]
- [22].Striegel AM, Specific refractive index increment (∂n/∂c) of polymers at 660 nm and 690 nm, Chromatographia 80 (2017) 989–996. [DOI] [PMC free article] [PubMed] [Google Scholar]
- [23].Higgins RS, Klinger SA (Eds.), High Purity Solvent Guide, Burdick & Jackson, 1990. [Google Scholar]
- [24].Nielsen LE, Predicting the Properties of Mixtures: Mixture Rules in Science and Engineering, Marcel Dekker, 1978. [Google Scholar]
- [25].Multiple detection in size-exclusion chromatography, in: Striegel AM (Ed.), ACS Symp. Ser, vol. 893, American Chemical Society, 2005. [Google Scholar]
- [26].Striegel AM, Multiple detection in size-exclusion chromatography of macromolecules, Anal. Chem 77 (2005) 104A–113A. [Google Scholar]
- [27].Striegel AM, Size-exclusion chromatography: smaller, faster, multi-detection, and multi-dimensions, Anal. Bioanal. Chem 390 (2008) 303–305. [DOI] [PubMed] [Google Scholar]
- [28].Striegel AM, Size-exclusion chromatography, in: Fanali S, Haddad PR, Poole CF, Riekkola M-L (Eds.), Liquid Chromatography, Volume 1 Fundamentals and Instrumentation, second ed., Elsevier, 2017, pp. 245–273. [Google Scholar]
- [29].Striegel AM, A method for studying optical anisotropy of polymers as a function of molar mass, Anal. Chem 74 (2002) 3013–3018. [DOI] [PubMed] [Google Scholar]