

Abstract
Common reversed-phase columns (C18, C4, phenyl, and cyano) offer inert surfaces suitable for the analysis of polymers by size-exclusion chromatography (SEC). The effect of tetrahydrofuran (THF) solvent and the mixtures of THF with a variety of common solvents used in high performance liquid chromatography (acetonitrile, methanol, dimethylformamide, 2-propanol, ethanol, acetone and chloroform) on reversed-phase stationary phase characteristics relevant to size exclusion were studied. The effect of solvent on the elution of polystyrene (PS) and poly(methyl methacrylate) (PMMA) and the effect of column temperature (within a relatively narrow range corresponding to typical chromatographic conditions, i.e., 10 °C–60 °C) on the SEC partition coefficients KSEC of PS and PMMA polymers, were also investigated. The bonded phases show remarkable differences in size separations when binary mixtures of THF with other solvents are used as the mobile phase. The solvent impact can be two-fold: (i) change of the polymeric coil size, and possible shape, and (ii) change of the stationary phase pore volume. If the effect of this impact is properly moderated, then the greatest benefit of optimized solute resolution can be achieved. Additionally, this work provides an insight on solvent-stationary phase interactions and their effects on column pore volume. The only effect of temperature observed in our studies was a decreased elution volume of the polymers with increasing temperature. SEC partition coefficients were temperature-independent in the range of 10 °C–60 °C and therefore, over this temperature range elution of PS and PMMA polymers is by near-ideal SEC on reversed-phase columns. Non-ideal SEC appears to occur for high molar mass PMMA polymers on a cyano column when alcohols are used as mobile phase modifiers.
Keywords: Size-exclusion chromatography, SEC, Polystyrene, Poly(methyl methacrylate), Polymer, Binary mobile phase
1. Introduction
Tetrahydrofuran (THF) is one of the most commonly used solvents for non-aqueous size-exclusion chromatography (SEC) because it is a good solvent for a wide range of polymer types. However, this solvent is toxic, attacks polyether ether ketone (PEEK) tubing, forms peroxides that can result in an explosion, and is expensive. During the last 15 years, scientists have been exploring ways to make analytical chemistry “greener” [1]. The main drivers for this are employees’ health, process safety, environmental impact, waste disposal, and costs associated with all of the above. If it is not possible to replace THF by a “greener” solvent, then perhaps its toxicity can be reduced by mixing it with another, less toxic, solvent (e.g., methanol, ethanol, 2-propanol, acetone [2]).
The number of solvents suitable as SEC mobile phases is limited to those that can dissolve polymer analytes (a temperature-dependent solvent property), that are compatible with the SEC column of choice, and that generate sufficient contrast (spectroscopic or otherwise) in the detector [3,4]. The first two requirements are not as stringent for reversed-phase (RP) columns, and the use of mixed solvents in SEC has only been explored recently [5]. Potential benefits of solvents that reduce solute bulkiness (i.e., solvents that reduce the hydrodynamic volume an analyte occupies in solution) are higher resolution and a wider separation range for a given pore volume of a column. Reversed-phase silica columns are compatible with a wide range of organic solvents, and the rigid porous particles neither swell nor shrink as the mobile phase composition is changed. Chemical modifications of the silica surface can result in a loss of pore volume, however. For example, the pore diameter of a narrow pore silica derivatized with a monomeric C18 phase is reduced from 60 Å to approximately 26 Å, and to an even greater extent in a polymeric C18 column – to approximately 18 Å [6]. Nevertheless, pore volume can be manipulated by using a solvent that decreases the conformational order of the bonded ligands [5,6] and thus increases the volume of the pores.
There are three regions that can be distinguished within the chromatographic column [7–9]: (i) the solvated bonded-phase region; (ii) the interface region, where the ends of the bonded-phase meet the mobile phase; and (iii) the bulk mobile phase region. The thickness of the interface region may have a further impact on the pore volume of the column and depends on multiple parameters (e.g., mobile phase composition, the identity and bonding density of the stationary phase ligands, the morphology of the silica substrate − endcapped or not [10]). Preferential sorption of mobile phase components by the stationary phase ligands can result in a monolayer or multilayer of adsorbed solvents in the interface region [10].
The resolution of an SEC separation can be improved by minimizing peak dispersion (increasing chromatographic efficiency) and maximizing internal pore volume. For a given experimental set-up, these can be manipulated by the choice of solvent, temperature, and flow rate (the roles of solvent and temperature can be closely linked, as regards thermodynamic and eluotropic strength, viscosity, etc.). As previously discussed in [5], solvation interactions between a solvent and a surface-functionalized stationary phase can influence the conformational order of the bound ligands, which in turn can impact the phase ratio (ratio of pore to interstitial volume, Vi/V0) of the column.
In this work, we contrast the effect of neat THF to that of binary mixtures of THF with a variety of common high performance liquid chromatography (HPLC) solvents (acetonitrile, methanol, dimethylformamide, 2-propanol, ethanol, acetone, and chloroform) on reversed-phase stationary phase (C18, C4, phenyl, and cyano) characteristics relevant to size-exclusion: total permeation volume, Vt; interstitial volume, V0; pore volume Vi; and phase ratio, Vi/V0. The solvent effect on the elution of narrow dispersity, linear polystyrene (PS) and poly(methyl methacrylate) (PMMA) polymers is also investigated, as is the effect of column temperature (within a 50 °C range) on the SEC partition coefficient KSEC of PS and PMMA polymers.
2. Theory
There are various general schemes that categorize the solvation properties of liquids, including empirical estimates of a solvent’s strength and selectivity for HPLC applications [11]. A solvent’s ability to elute analytes from a column (eluotropic strength) is estimated by the solvent (elution) strength parameter. This strength depends on the mobile phase composition (e.g., nature and concentration of solvents), type of stationary phase, column temperature, and solute properties. Thus, elution strength is not a sole property of the solvent, but is a composite property of the variables involved [12]. Nevertheless, elution strength is a practical concept in liquid chromatography (LC) that is used to control the retention of analytes in RP-HPLC, where elution strength is associated with the ability of solvents with high elution strength to sweep away the retained solutes, i.e., to elute solutes faster, or in other words, to minimize the elution volumes of solutes. Thus, elution strength is related to the ability of a solvent to interact with the stationary phase. For the purpose of this SEC study, the strength of a solvent will be identified by its ability to minimize the solute-accessible column volume (i.e., to minimize the total permeation volume), which is a result of the ability of a solvent to interact strongly with the stationary phase. While solvents can have similar elution strengths, they can also differ in selectivity, resulting in differences in the separation order for solutes in RP-HPLC [12]. Again, this would not be the case for ideal SEC, where the elution order strictly depends on molecular size. However, because the selectivity parameter is determined by the relative capability of a solvent to engage in specific intermolecular interactions, it will determine the magnitude of the various solvent-stationary phase, solvent-solvent, solvent-solute, and solvated stationary phase-solvated solute interactions, all of which influence the efficiency of the size separation.
The Hildebrand solubility parameter, δH (total solubility parameter), is an estimated measure of elution strength. It is derived from the cohesive energy density of the solvent that, in turn, is derived from the solvent’s heat of vaporization [11]. The total solubility parameter is based on the estimation of the global strength of the interactions within the solvent molecules, and on an assumption that the strength of solute-solvent interaction is represented by the internal forces among solvent molecules [12]. Solvents selected for the study are listed in the order of increased Hildebrand solubility parameter in Table 1. Thus, the elution strength of these solvents decreases from THF to methanol for RP-HPLC, with THF being the strongest solvent.
Table 1.
Solvent properties.
| Solvent | a Hildebrand Solubility, MPa0.5 | b Polarity Index |
a Normalized selectivity factors derived from Kamlet-Taft solvatochromic parameters |
a UV Cutoff, nm | ||
|---|---|---|---|---|---|---|
| α | β | π* | ||||
| Tetrahydrofuran | 18.6 | 4.0 | 0.00 | 0.49 | 0.51 | 212 |
| Chloroform | 18.8 | 4.1 | 0.43 | 0.00 | 0.57 | 245 |
| Acetone | 19.6 | 5.1 | 0.06 | 0.38 | 0.56 | 330 |
| 2-Propanol | 23.3 | 3.9 | 0.35 | 0.43 | 0.22 | 205 |
| Dimethylformamide | 24.1 | 6.4 | 0.00 | 0.44 | 0.56 | 268 |
| Ethanol | 24.5 | 4.3 | 0.39 | 0.36 | 0.25 | 205–210 |
| Acetonitrile | 24.8 | 5.8 | 0.15 | 0.25 | 0.60 | 190 |
| Methanol | 29.6 | 5.1 | 0.43 | 0.29 | 0.28 | 205 |
In a solvent mixture, the global strength of the mixture, δMixture, is estimated by the following equation:
| (1) |
where δj and φj represent the Hildebrand solubility parameter and volumetric fraction, respectively, of each individual solvent (j) in the mixture [12]. Solubility parameters calculated for the solvent mixtures used in this study are presented in Table 2.
Table 2.
Hildebrand solubility parameters, MPa0.5, calculated using Eq. (1) and values listed in Table 1 for the mixtures of solvents used as mobile phase.
| Solvent j | % of solvent in THF mobile phase |
|||||||||
|---|---|---|---|---|---|---|---|---|---|---|
| 10 | 20 | 30 | 40 | 50 | 60 | 70 | 80 | 90 | 100 | |
| Hildebrand Solubility, MPa0.5 | ||||||||||
| Tetrahydrofuran | – | – | – | – | – | – | – | – | – | 18.6 |
| Chloroform | 18.6 | 18.6 | 18.7 | 18.7 | 18.7 | 18.7 | 18.7 | 18.8 | 18.8 | 18.8 |
| Acetone | 18.7 | 18.7 | 18.9 | 19.0 | 19.1 | 19.2 | 19.3 | 19.4 | – | – |
| 2-Propanol | 19.1 | 19.5 | 20.0 | 20.5 | – | – | – | – | – | – |
| Dimethylformamide | 19.2 | 19.7 | 20.3 | 20.8 | 21.4 | 21.9 | 22.5 | − | − | − |
| Ethanol | 19.2 | 19.8 | 20.4 | 21.0 | – | – | – | – | – | – |
| Acetonitrile | 19.2 | 19.8 | 20.5 | 21.1 | – | – | – | – | – | – |
| Methanol | 19.7 | 20.8 | 21.9 | 23.0 | – | – | – | – | – | – |
Because a solvent’s ability to dissolve a given polymer is temperature dependent, the experimental conditions over which polymer solubility varies are often referred to as good, poor, theta, and non-solvent [3]. A good solvent dissolves the polymer in any proportion at most temperatures. Generally, this type of solvent is characterized by a theta temperature (if it exists) that is well below room temperature. A poor solvent has a limited solubility towards the polymer, and its theta temperature is close to room temperature. A non-solvent has negligible, if any, ability to dissolve the polymer. As a rule-of-thumb, a good solvent for a polymer will have a total solubility parameter similar to that of the polymer [11]; however, there are exceptions to this rule. The Hildebrand solubility parameter for PS is 18.5 MPa0.5±0.5 MPa0.5 and for PMMA is 19.0 MPa0.5±0.5 MPa0.5 [13] and, therefore THF, chloroform, and acetone are good solvents and acetonitrile and alcohols (2-propanol, ethanol, and methanol) are poor solvents for these polymers. Dimethylformamide, with a solubility parameter of 24.1 MPa0.5, is a poor solvent for PS, but a good solvent for PMMA, however. These types of deviations from the rule reveal the limitations of the solubility parameters, where the contributions of molecular interactions are not individually considered. These contributions will be discussed later in the text in relation to the solvent-stationary phase interactions, which are also applicable to the solvent-polymer interactions not considered here.
Solutes eluting in size-exclusion mode should prefer the mobile phase over the stationary phase, to remain in the former during elution without interactions with the latter. There are specific interactions of solutes with the stationary phase and the mobile phase that determine a solvent’s selectivity properties and which contribute to the global polarity of the solutes and phases. Solvent selectivity can be categorized based on hydrogen bond acidity, hydrogen bond basicity, dispersion forces, and polar interactions (i.e., dipole-dipole, induced dipole-dipole, and induced dipole-induced dipole interactions). Snyder’s solvent selectivity triangle is the most popular approach to solvent classification [11]. This method characterizes solvents by three polar interactions: hydrogen bond acidity, hydrogen bond basicity, and dipolarity [14]. The sum of these interaction contributions provides a measure of the solvent strength (polarity index, Table 1) and the ratio of the individual contributions to their sum is a measure of selectivity.
3. Experimental
3.1. Materials
HPLC-grade solvents: acetonitrile (ACN) was purchased from EMD Millipore Chemicals (Billerica, MA, USA); unstabilized tetrahydrofuran (THF), methanol (MeOH), 2-propanol (isopropyl alcohol, IPA), chloroform, acetone, and N, N-dimethylformamide (DMF) were purchased from Sigma-Aldrich (St. Louis, MO, USA). Ethanol (EtOH) 200 proof, manufactured by Decon Laboratories Inc., was purchased from Fisher Scientific (Waltham, MA, USA). Shodex polystyrene (PS) standards were purchased from Waters (Milford, MA, USA), and Agilent poly(methyl methacrylate) (PMMA) standards − from Neta Scientific, Inc. (Hainesport, NJ, USA). Molar mass dispersities of all PS standards were ≤1.07, and of all PMMA standards ≤1.27; molar mass values given here correspond to the peak-average molar mass (average molar mass at peak apex, Mp), in g mol−1; both values, Mp and molar mass dispersity, were determined by the manufacturers. Toluene, anhydrous, 99.8%, was purchased from Sigma-Aldrich (St. Louis, MO, USA).
3.2. HPLC
The liquid chromatographic system, an Agilent Series 1100 (Agilent Technologies, Santa Clara, CA, USA), consisted of a degasser (G1322A), a column thermostat (G1316A), a quaternary pump (G1311A) able to handle a maximum backpressure of 400 bar, an autosampler (G1313A), and an ultraviolet-visible variable wave-length detector (UV/VIS VWD) (G1314A) set at 262 nm for the detection of PS, at 230 nm for the detection of PMMA, and at 212 nm when acetone was used in the mobile phase. One microliter (1 µL) volumes of toluene, PS, and PMMA standards were injected into the chromatographic systems, and eluted isocratically on the columns listed in Table 3. The columns were held at 30 °C for the solvent screen study, and at various temperatures (10 °C, 20 °C, 30 °C, 40 °C, 50 °C, and 60 °C) for the temperature study. The mobile phase contained THF and other solvents (ACN, MeOH, EtOH, IPA, DMF, acetone, and chloroform) in the ratios specified in the text, mixed using an on-line solvent mixer. Separations were carried out at a flow rate of 0.30 mL min−1. The chromatographic system was controlled and the data were acquired through a PC running 2010 Pro Empower 3 software, version 7.20.00.00 (Waters, Milford, MA, USA).
Table 3.
Column Parameters. Column length and internal diameter (mm) 150 × 4.6; particle size (µm) 3; pore size (Å) 300; Distributor: MAC-MOD Analytical.
| Column No. | Column ID |
|---|---|
| 1 | ACE 3 C18-300 |
| 2 | ACE 3 C4-300 |
| 3 | ACE 3 Phenyl-300 |
| 4 | ACE 3 CN-300 |
3.3. Sample preparation
All PS standards were prepared in THF at a nominal concentration of 1 mg mL−1, and most PMMA standards in THF at 3 mg mL−1, except PMMA Mp 20,310 and PMMA 46,890, which were prepared at 1 mg mL−1 concentration, by dissolving approximately 10 mg (or 30 mg) of PS or PMMA in 10.0 mL of THF. The solutions were shaken manually and allowed to equilibrate overnight. Toluene solution was prepared by diluting 10 µL of toluene to 10.0 mL with THF.
4. Results and discussion
4.1. Solvent effect on column properties
The effects of solvent type and concentration in THF mobile phase on stationary phase characteristics relevant to size-exclusion (total permeation volume, interstitial volume, pore volume, and phase ratio) were examined on 300 Å pore size columns from the same manufacturer that differed only in stationary phase chemistry (C18, C4, phenyl, and cyano, listed in Table 3). This was done using both neat THF mobile phase and binary mixtures of THF modified with solvent j (j = ACN, MeOH, EtOH, IPA, DMF, acetone, or chloroform) at different ratios (100/0, 90/10, 80/20, 70/30, and 60/40 (v/v) THF/solvent j). In addition, binary mixtures of THF with chloroform, acetone, and DMF were evaluated at higher ratios: chloroform in ratios of up to 100% in the mobile phase (additionally 50/50, 40/60, 30/70, 20/80, 10/90, and 0/100 (v/v) THF/chloroform); DMF in ratios of up to 70% in the mobile phase (additionally 50/50, 40/60, and 30/70 (v/v) THF/DMF); and acetone in ratios of up to 80% in the mobile phase (additionally 50/50, 40/60, 30/70, and 20/80 (v/v) THF/acetone). The reasons for selection of the solvents and ratios are discussed later in Section 4.2.
Shown in Figs. 1–4 are the total permeation volumes (Vt), or total accessible volumes (as measured by the elution volume of toluene), interstitial volumes (V0) (as measured by the elution volume of PS Mp 791,000), calculated pore volumes (Vi = Vt − V0), and phase ratios Vi/V0 as a function of eluent type and composition for each type of stationary phase (C18, C4, phenyl, and cyano, listed in Table 3). From these plots it is seen that, when 100% THF is used as the mobile phase, the total permeation and interstitial volumes of the columns can be placed in following order, respectively: Vt(C4) ≈ Vt(phenyl) > Vt(cyano) > Vt(C18); and V0(C4) ≈ V0(cyano) > V0(phenyl) > V0(C18). These parameters provide the following order for the pore volumes and phase ratios of the columns with 100% THF eluent: Vi(phenyl) ≈ Vi(C4) > Vi(cyano) > Vi(C18) and Vi/V0(phenyl) ≈ Vi/V0(C4) > Vi/V0(cyano) ≈ Vi/V0(C18), respectively. Because the pore volumes and phase ratios on phenyl and C4 columns are similar and are the largest, it can be expected that partitioning of the solutes within these types of pore volumes will be similar, which will result in similar separation (resolution and separation range) of solutes, and the separation efficiency will be better than that on the cyano and C18 columns. Similarly, because the pore volumes of cyano and C18 columns do not differ significantly from each other and their phase ratios are the same, it is expected that these columns will perform similarly when 100% THF is used as the eluent.
Fig. 1.
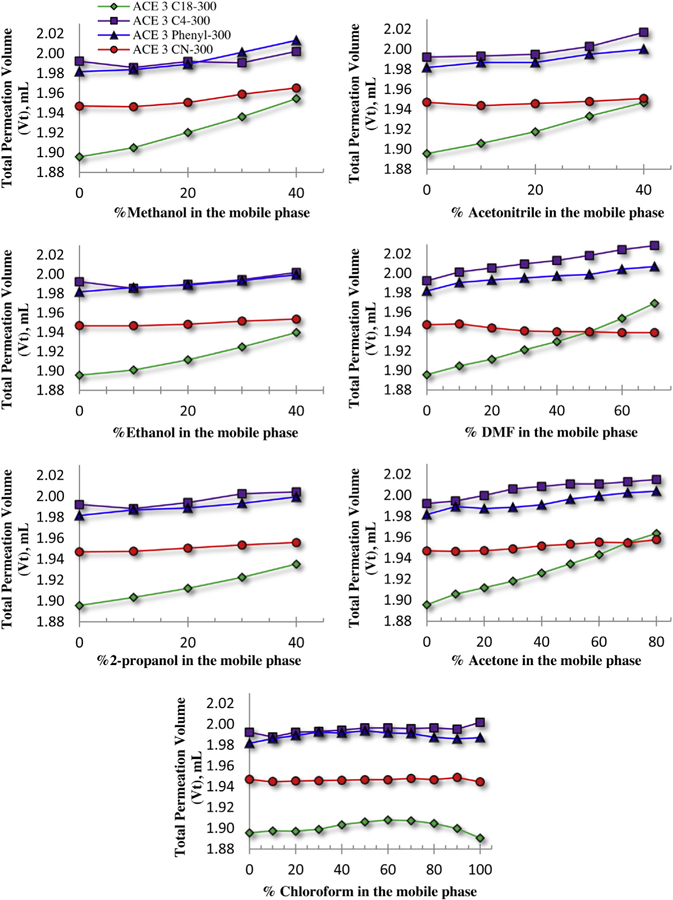
Effect of solvent composition and concentration in the mobile phase on stationary phase total permeation volume Vt. Column types: C18 (green), C4 (purple), phenyl (blue) and cyano (red). Instrumentation: Agilent 1100 with a variable wavelength detector set to 262 nm. Other conditions: injection volume = 1.0 µL; flow rate = 0.30 mL min−1; column temperature = 30 °C (thermostatted). (For interpretation of the references to colour in this figure legend, the reader is referred to the web version of this article).
Fig. 4.

Effect of solvent composition and concentration in the mobile phase on phase ratio, Vi/V0. Column types: C18 (green), C4 (purple), phenyl (blue) and cyano (red). Instrumentation and other conditions as in Fig. 1. (For interpretation of the references to colour in this figure legend, the reader is referred to the web version of this article).
From Fig. 1 it can be seen that C18 is the only packing that experiences a substantial volume change among all the mobile phases under study, except for THF/chloroform. Changes in total permeation volumes with concentration of modifier solvent indicate that bonded ligands of the stationary phase change their conformational order. The degree of these changes depends on the bonded ligand length and/or bulkiness, and therefore it is more pronounced on the C18 column than on other columns examined here. The interstitial volumes (Fig. 2) do not experience significant changes as a function of solvent modifier concentration. Either a very slight increase (a very slight decrease on the phenyl column with DMF modifier) or no change at all is observed on either of the columns, except in acetone, where a noticeable increase is seen at high concentrations (e.g., 80% of acetone), and on a phenyl column at a concentration of >30% MeOH, where a sharp increase in the interstitial volume is observed. Interestingly, while solvent modifiers have a similar, nearly linear impact on the total permeation volumes of the columns, as no sharp changes are seen in the plots of Fig. 1, the interstitial volumes sharply increase when the concentration of solvent modifiers is more than 30% (above 70% in acetone) in the mobile phase (with the exception of DMF and chloroform), as seen in Fig. 2. The resulting pore volumes practically do not change on C4 and phenyl columns in mobile phases modified with ACN, EtOH, IPA, and acetone (Fig. 3). However, the pore volumes slightly increase with the increase of DMF concentration in the mobile phase, and decrease with increased MeOH concentration in the mobile phase. The pore volume of the C18 column increases with increased concentration of all modifiers (Fig. 3). The phase ratios on C4 and phenyl columns decrease very slightly when ACN, EtOH, IPA, and acetone are used in the mobile phase (Fig. 4) (at >70% acetone, a larger decrease is seen). Again, DMF has a reverse effect it increases the phase ratio as its concentration is increased in the mobile phase. On the C18 column, the phase ratios increase with an increase of up to 30% MeOH, ACN, and EtOH; above 30% IPA; and up to 70% DMF and acetone (Fig. 4). Above these percentages, a decrease in phase ratios is observed. The cyano column, with the most polar stationary phase among the group of columns tested, is the least affected by the mobile phase composition. The total permeation volumes and interstitial volumes increase only very slightly with an increase of all modifiers in the mobile phase except DMF (very slight decrease), so much so that, from a practical point of view, these values do not change as compared to less polar stationary phases (Fig. 1 and 2). The resulting pore volume and phase ratio of the cyano column decrease only very slightly with an increase of modifier concentration in the mobile phase for all solvents, with the exception of chloroform which has no impact on these column properties (Fig. 3 and 4). Chloroform modifier in THF does not produce a considerable change in stationary phase characteristics on any of the columns studied (Fig. 1–4).
Fig. 2.

Effect of solvent composition and concentration in the mobile phase on interstitial volume V0. Column types: C18 (green), C4 (purple), phenyl (blue) and cyano (red). Instrumentation and other conditions as in Fig. 1. (For interpretation of the references to colour in this figure legend, the reader is referred to the web version of this article).
Fig. 3.

Effect of solvent composition and concentration in the mobile phase on pore volume Vi. Column types: C18 (green), C4 (purple), phenyl (blue) and cyano (red). Instrumentation and other conditions as in Fig. 1. (For interpretation of the references to colour in this figure legend, the reader is referred to the web version of this article).
The observed differences in the total permeation and interstitial volumes can be ascribed to differences among both the pore and interstitial diameters of the columns. Pore diameters of approximately 300 Å may be affected to a higher degree than will be interstitial diameters of approximately 11000 Å (the latter as calculated for 3 µm porous particles using Eq. (2) in reference [15]). This explains why all interstitial volume changes produced by different mobile phase modifiers are of almost the same magnitude and similar in nature (Fig. 2) for all columns studied regardless of bonding chemistry (C18, C4, phenyl, and cyano), the only exceptions being those of MeOH and acetone modifiers on the phenyl column.
As previously discussed [5], depending on the solvation interactions of the stationary phase with a solvent, bonded ligands can be in an ordered state (extended with ligands aligned away from the silica substrate) or a disordered one (folded, with ligands pointing towards the silica substrate). Long C18 ligands undergo a higher degree of such transformations, compared to short C4, phenyl, and cyano ligands. Rustamov et al. [16] emphasized that short-chain C1 ligands have high bonding density (no “gaps” between bonded ligands) as compared to longer-chain C18 ligands (lower bonding density, larger space between bonded ligands). Because the conformational freedom of short ligands is minimal and has little effect on column pore volume [16], the higher bonding density of short ligands (e.g., C4, phenyl, and cyano) dominates in the determination of these columns’ effective pore volume. Longer ligands (C18), on the other hand, have lower bonding density but greater conformational freedom. Therefore, the effective pore volume of the C18 column is determined by both the bonding density and conformation of the C18 ligands [16].
Shown in Fig. 5 are plots of the total permeation volumes as a function of stationary phase for each mobile phase composition employed. These plots demonstrate the degree of each solvent’s impact on the C18, C4, phenyl, and cyano stationary phase characteristics (note that plots a–d are the same as A–D, but include only MeOH, ACN, EtOH, and IPA solvents for clarity of the plot). To aid in the interpretation of the effect of each mobile phase on the stationary phase, an attempt was made to relate this mobile phase effect to the strength (Hildebrand solubility parameter) of each solvent, which was calculated using Eq. (1) and the Hildebrand solubility parameters for each solvent as listed in Table 1. The values of the eluents’ strength used in this study are tabulated in Table 2. Some mixtures of different solvents have the same elution strengths and are termed isoeluotropic mixtures [12]. From Table 2, it can be seen that starting with 30% modifier concentration in THF, the solvent strength of the binary solvent begins to differ.
Fig. 5.

Effect of solvent concentration in the mobile phase on total permeation volume Vt of C18 (A, a), C4 (B, b), phenyl (C, c), and cyano (D, d) columns − a, b, c and d are the same as A, B, C, D, but fewer solvents in the plot for clarity. Instrumentation and other conditions as in Fig. 1.
The main observation from Fig. 5 for the C18 stationary phase (A, a) is that solvent-stationary phase interactions are directly related to the Hildebrand solubility parameter of the solvents used, where the weakest solvent, MeOH, interacts with the stationary phase the least. This pattern suggests that the preferential type of interaction of the organic modifiers with the C18 ligands is hydrophobic (i.e., through dispersive interactions). The exception is the interaction of the stationary phase with DMF. The fact that DMF interacts more strongly with the stationary phase than expected (as predicted by Hildebrand solubility) can be explained by the strong proton-acceptor capability of the tertiary nitrogen in DMF (Table 1). Such solvents as THF, DMF and IPA interact strongly with non-ionized residual silanols of the C18 stationary phase, that have a great proton-donor capability, thereby inducing a specific hydrogen bond interaction that is not taken into account when using the Hildebrand solubility parameters.
From Fig. 5 it can be seen that the effect of the same solvents on the short C4 stationary phase (B, b) appears to be of a different nature than on the C18 phase (A, a). Because short ligands such as C4 have less conformational freedom than their longer counterparts [16], the impact of mobile phase composition on the conformational order of the ligands is no longer as pronounced as in the case of C18. Furthermore, a C4 stationary phase is less hydrophobic and has a capability of specific hydrogen bond interactions via accessible proton-accepting residual silanols. Therefore, some solvents that are weak for C18 may be more favored by C4, resulting in stronger interactions by this latter stationary phase with such solvents. The Hildebrand solubility order for solvents is no longer followed because the strong hydrogen-ion-donor capability of alcohols (MeOH, EtOH and IPA) induces their interactions with accessible residual silanols in the stationary phase. Gritti et al. [17] emphasized that even with end-capped alkyl-silica adsorbents, the effects of residual silanols are impossible to avoid. While long C18 ligands can shield silanols, shorter C4 ligands will likely have more exposed silanols for interactions [18,19].
A phenyl stationary phase is even less hydrophobic than C4, favors specific interactions with aromatic compounds, and thus provides additional solvent affinity due to π-π interactions, as seen from Fig. 5(C, c). The impact of MeOH on the phenyl stationary phase can be explained by order change in the latter. Propyl-phenyl ligands are larger than C4 ligands, but smaller than C18. Thus, while it is expected that the pore volumes of the phenyl column should be affected by the stationary phase order to a smaller degree than those of the C18 column, the phenyl column should experience larger changes in the pore volumes than the C4 column (because the order of phenyl ligands contributes to pore volume).
From Fig. 5(D, d), the medium polarity cyano stationary phase appears to favor interactions with polar DMF solvent the most (polarity index 6.4 − Table 1). The selectivity of the cyano column is dominated by polar and hydrogen bond basicity interactions [20]. Thus, in addition to non-specific dispersive interactions (based on solubility parameters) and specific hydrogen bond and π-π interactions, the cyano stationary phase is also subject to dipole–dipole interactions.
4.2. Solvent modifier effect on elution of PS and PMMA polymers
The elution of toluene and polymer calibrants (PS (g mol−1): Mp 580; 2780; 7350; 19,500; 51,200; 126,000; 282,000; and 791,000; and PMMA (g mol−1): Mp 550; 3070; 7360; 20,310; and 46,890) was evaluated on four columns that differed only in stationary phase chemistry using a THF-only mobile phase and binary mixtures of THF and either ACN, MeOH, EtOH, IPA, DMF, acetone, or chloroform, each at different ratios (100/0, 90/10, 80/20, 70/30, and 60/40 (v/v) THF/solvent j). In addition, binary mixtures of THF and chloroform, acetone, or DMF were evaluated at higher ratios: chloroform in concentrations up to 100% in the mobile phase (additionally 50/50, 40/60, 30/70, 20/80, 10/90, and 0/100 (v/v) THF/chloroform); DMF in concentrations up to 70% in the mobile phase (additionally 50/50, 40/60, and 30/70 (v/v) THF/DMF); and acetone in concentrations up to 80% in the mobile phase (additionally 50/50, 40/60, 30/70, and 20/80 (v/v) THF/acetone). The reason for employing ACN and alcohol concentrations only up to 40% in the mobile phase is that these solvents are non-solvents for both PS and PMMA. Nevertheless, based on the calculated total Hilde-brand solubility parameters listed in Table 2, these binary mixtures are expected to be good solvents for the polymers under study, and therefore they would prevent adsorption of PS and PMMA onto the stationary phase as the solutes prefer the good solvent environment of the mobile phase. Additionally, high content of weak solvents (e.g., ACN and alcohols) in the mobile phase may promote non-SEC interactions of the polymers with non-polar stationary phases. However, 40% content of a weak solvent in the mobile phase is below the concentration at which sorption interactions of PS and PMMA with the non-polar, medium polarity and polar stationary phases would start taking place [5]. At acetone concentration above 80%, high molar mass PS solutes precipitated/disappeared from the chromatogram (e.g., Mp 1,640,000 and 791,000 at 10/90 (v/v) THF/acetone; Mp 1,640,000, 791,000, 282,000, and 126,000 at 0/100 (v/v) THF/acetone on cyano column). Although acetone has a high UV cutoff (330 nm), a usable relative minimum in molar absorptivity occurs at 212 nm so the UV detector wavelength was set accordingly for scouting with acetone mobile phases. This wave-length resulted in high absorbances for the solutes; however, the solute peaks were on-scale and therefore suitable for this qualitative assessment of elution volumes. DMF was only investigated at up to 70% in the mobile phase due to high UV cutoff (268 nm), which caused significant decrease in the sensitivity of the analysis. Because of the absorption properties of chloroform and DMF solvents (high UV cutoffs of 245 nm and 268 nm, respectively), PMMA solutes (with significant molar absorptivities only below 235 nm) could not be detected when these solvents were present in the mobile phase. Therefore, these solvents were used only to elute PS solutes.
As observed in Section 4.1, modification of THF mobile phase with 30% of other solvents can provide enhanced phase ratios, and therefore resolution, compared to 100% THF mobile phase. Therefore, chromatograms of PS standards using 100% THF were compared to those using THF modified with 30% ACN, MeOH, EtOH, IPA, DMF, acetone, or chloroform on columns of the same length, internal diameter, particle size and pore size, but differing in chemistry of bonded ligands (C18, C4, phenyl, and cyano, listed in Table 3) (chromatograms are provided in the supplementary section of the web version of this article). To aid the comparison, the PS separation range obtained from these chromatograms (as judged by the differences in elution volumes of the last, PS Mp 580, and the first, PS Mp 791,000, peaks) versus mobile phase composition for each column was plotted in Fig. 6. This plot demonstrates that the separation ranges of the C4 and phenyl columns are very similar to each other and significantly larger than those of the cyano and C18 columns. It also demonstrates that separation range generally increases with a decrease in solvent strength (increase in Hildebrand solubility parameter Table 1) on the hydrophobic C18 stationary phase. The plot shows that the largest separation range on the C18 column is obtained when 70/30 (v/v) THF/ACN is used, and that 70/30 (v/v) THF/MeOH mobile phase provides a similar separation of the PS solutes. As demonstrated by the separation range plot, the best performance for the cyano column is obtained with 100% THF, 70/30 (v/v) THF/IPA, and 70/30 (v/v) THF/EtOH mobile phases, but it is also very similar with 70/30 (v/v) THF/ACN. Importantly, the largest separation range does not always mean the best separation of all peaks. For example, the plot in Fig. 6 shows a larger separation range on the C4 column with 70/30 (v/v) THF/ACN than with 100% THF; however, the chromatograms in Fig. 7 show increased resolution for the larger molar mass polymers (282,000 and 126,000 g mol−1– the second and the third peaks, respectively), but decreased resolution for the smaller molar mass polymers (7350, 2870, and 580 g mol−1– the last three peaks) with 70/30 (v/v) THF/ACN mobile phase. Similarly, the plot in Fig. 6 shows that the separation range for the phenyl column is similar with 70/30 (v/v) THF/IPA, THF/EtOH, THF/ACN and THF/MeOH mobile phases and larger than with 100% THF, but the chromatograms in Fig. 8 demonstrate improved resolution of larger molar mass polymers (791,000, 282,000, and 126,000 g mol−1– the first three peaks) and decreased resolution of the small molar mass polymers (7350, 2870, and 580 g mol−1– the last three peaks) in the mixed solvents, compared to that in neat THF. While elution of polymers with 70/30 (v/v) THF/IPA, THF/EtOH and THF/ACN mobile phases is similar to each other, it differs from that with 70/30 (v/v) THF/MeOH, where further improvement in resolution of large molar mass polymers and further decrease in resolution of the small molar mass polymers is seen. This is because the effect of 30% IPA, EtOH and ACN modifiers in the THF mobile phase on the volumes of the phenyl stationary phase is similar, but 30% MeOH produces the largest impact, as seen in Figs. 1–5. It appears that these effects are coupled. Increased column volume, which is the result of the decreased affinity of these mixed solvent mobile phases for the stationary phase, provides an extension of the separation range (calibration curve) in the high molar mass region and thus increases resolution in that region. Over a linear separation range, extending the upper limit of this range also results in decreased resolution at the lower molar mass end of the range, due to the resultant steepening in the calibration curve.
Fig. 6.

Separation range (mL) − range between elution volumes of PS last (Mp 580) and first (Mp 791,000) peaks.
Fig. 7.

Comparison of chromatograms for PS calibrants on C4 column. Molar masses of PS standards (g mol−1): 791,000; 282,000; 126,000; 51,200; 19,500; 7350; 2870; and 580. Instrumentation and other conditions as in Fig. 1.
Fig. 8.

Comparison of chromatograms for PS calibrants on phenyl column. Molar masses of PS standards (g mol−1 ): 791,000; 282,000; 126,000; 51,200; 19,500; 7350; 2870; and 580. Instrumentation and other conditions as in Fig. 1.
The elution of PS solutes on C4 and phenyl columns suggests that in several solvents the pores are so large as to cause smaller solutes to co-elute at the total permeation volume. However, as discussed in Section 4.1, and demonstrated in Fig. 1, ACN, MeOH, EtOH, and IPA solvents do not change the total pore volume of the C4 and phenyl columns to a large extent, compared to 100% THF. For example, the change in total permeation volume on phenyl column is 0.02 mL when the mobile phase is changed from 100% THF to 70/30 (v/v) THF/MeOH (Fig. 5, c), but the retention volume change of PS 19,500 analyte is 0.15 mL (0.5 min in Fig. 8) for the same mobile phases. Therefore, the elution behavior of PS polymers observed with the mixtures of good and poor PS solvents (THF/ACN, THF/MeOH, THF/EtOH and THF/IPA) used as the mobile phase is caused by the shrinking of the PS polymer coils. Furthermore, chloroform and acetone are good solvents for PS polymers, and therefore, the change of coil size in the presence of these solvents is not expected to be significant, compared to that in 100% THF.
To compare the elution behavior of non-polar PS and medium polarity PMMA polymers, the retention volumes of similar molar mass PS (Mp 19,500) and PMMA (Mp 20,310) polymers was plotted versus mobile phase composition using THF mobile phases modified with different solvents in the ratios of 100/0 to 60/40 (v/v) THF/solvent j (where solvent j was either MeOH, ACN, EtOH, or IPA) and the C18, C4, phenyl, and cyano columns. Second order polynomials were fitted to the experimental data. Additionally, PS solutes were eluted with binary mixtures of THF and acetone, the latter in concentrations of up to 80% when used in combination with the C18, C4, and phenyl columns (sorption interactions of PS solutes with the stationary phase were observed above 80% acetone). PMMA solutes were eluted with THF/acetone mobile phases in ratios that varied from 100/0 to 0/100 (v/v). Both PS and PMMA solutes eluted on the cyano column with THF mobile phase that contained acetone at concentrations from 0% to 100%. Additionally, PS solutes were eluted on all columns using THF mobile phase modified with DMF (concentrations varied from 0% to 70%) and with chloroform (concentrations varied from 0% to 100%). As mentioned earlier, the UV cutoffs of DMF and chloroform are too high for the detection of PMMA polymers and, therefore, only PS polymers were analyzed using these solvents. Fig. 9 demonstrates that the elution volumes of PS solutes depend significantly on the nature and concentration of the solvent modifier as well as on the stationary phase chemistry, but the elution volumes of PMMA solutes are only insignificantly affected. Thus, the size of the PMMA polymer coils is affected by the presence of a modifier to a lesser degree than is that of PS.
Fig. 9.

Elution of similar molar mass polymers (PS 19,500 and PMMA 20,310) on columns of different chemistry (C18, C4, phenyl and cyano) using THF mobile phases modified with different solvents in the ratios of 100/0 to 0/100 (v/v) THF/solvent j. Instrumentation: Agilent 1100 with a variable wavelength detector set to 262 nm for PS and to 230 nm for PMMA. Other conditions: injection volume = 1.0 µL; flow rate = 0.30 mL min−1; column temperature = 30 °C (thermostatted).
These changes in elution volumes are the result of a double effect: (i) a change of the polymeric coil size, and possibly shape, depending on the type and concentration of the solvent used; and (ii) changes in the stationary phase chain order and resulting pore volume of the column due to preferential solvation. To better understand the elution of PS and PMMA on RP columns while employing mobile phases comprised of mixed solvents, not only must one consider the properties of the solvent, alone, but also the ternary solvent-solute-stationary phase relationship and how this relationship is mediated by the role and concentration of particular solvent modifiers.
For example, in 60/40 (v/v) THF/ACN mobile phase, the total permeation volume of the cyano column is almost the same as that of the C18 column (Fig. 1), and thus, retention volumes of the same analytes on these columns should be similar. However, as seen in Fig. 9, in 60/40 (v/v) THF/ACN PS 19,500 explores less pore volume (i.e., elutes at a smaller retention volume) on the cyano column than it does on the C18 column, while, in the same mixed solvent pair, the reverse is true for PMMA 20,310 on these same columns (Fig. 9). PMMA coils are almost unaffected by the change in the mobile phase composition, however. These observations are consistent with ones regarding the elution of PS and PMMA on the polar hydrophilic interaction chromatography (HILIC) column with THF/ACN mobile phases in reference [5]. No substantial changes in elution volumes of PS solutes, and almost no changes in elution volumes of PMMA solutes, where observed when the concentration of ACN was changed from 0% to 40% (v/v) in THF. As the consequence, the benefits of PS polymer coil size reduction in mobile phases containing high percentage of a poor solvent cannot be fully realized on the medium polarity and polar stationary phases.
Given previous work by Poole [11], Berek [21], Bleeha et al. [22], and Tijssen [23], the possibility exists that our results are due to preferential solvation within the pores. At present, there is no consensus within the field, however, regarding the existence of said preferential solvation, except at the interfacial region between the stationary phase functionality and the pore bulk volume. Given the very small reduction in pore volume associated with this latter type of preferential solvation, it is not expected to result in an effect larger than the uncertainty associated with the measurements themselves. As such, we cannot at present adequately explain the particular observations based on current data.
The key assertion that can be made from Fig. 9 is that elution of PS and PMMA polymers of the same molar mass can be achieved by manipulation of solvent type and concentration. For example, PS and PMMA solutes will elute at the same time as each other on the C18 column when approximately 16% ACN/84% THF is used as the mobile phase; on the C4 column with approximately 17% MeOH/83% THF; on the phenyl column with approximately 30% EtOH/70% THF; on the cyano column with approximately 100% acetone; etc. Co-elution of the same molar mass PS and PMMA solutes on the cyano column with EtOH- and IPA-modified THF appears to be impossible, however. Similarly, if separation of the same molar mass PS and PMMA polymers in a sample mixture is required, it can be achieved using 60/40 (v/v) THF/ACN mobile phase on a C18, C4, or phenyl column. Although the separation can be achieved on these columns with other mobile phases, ACN provides the largest separation range for PS and PMMA analytes at 40% concentration. This assertion is consistent with the observations by Brun and Alden. [24].
4.3. Temperature effect on partition coefficients of PS and PMMA polymers
To investigate the effect of column temperature on the partition coefficient KSEC of PS and PMMA polymers, the elution volumes of toluene (used to measure the total permeation volume) and polymer calibrants (PS (g mol−1): 580; 2780; 7350; 19,500; 51,200; 126,000; 282,000; 791,000 (used to measure total exclusion volume) and 1,640,000 (used to construct calibration plots as in Fig. 10); and PMMA (g mol−1): 550; 3070; 7360; 20,310; and 46,890) on C18, C4, phenyl, and cyano columns (listed in Table 3) were determined using 100% THF mobile phase and binary mixtures of THF modified individually with ACN, MeOH, EtOH, IPA, DMF, acetone and chloroform at ratios of 70/30 (v/v) THF/solvent j at column temperatures set to 10 °C, 20 °C, 30 °C, 40 °C, 50 °C, and 60 °C (i.e., over a 50 °C temperature range). DMF and chloroform were not used with PMMA due to their high UV cutoff, which prevents detection of PMMA at lower wavelengths. The distribution coefficient, KSEC, was calculated using the following equation:
| (2) |
where Vr is the elution volume (or retention volume) of a solute, V0 is the elution volume of an excluded peak, which is equal to the interstitial volume between the stationary phase particles, and Vt is the total mobile phase volume (total permeation volume, or the sum of the stagnant and flowing (bulk) mobile phases) [3].
Fig. 10.
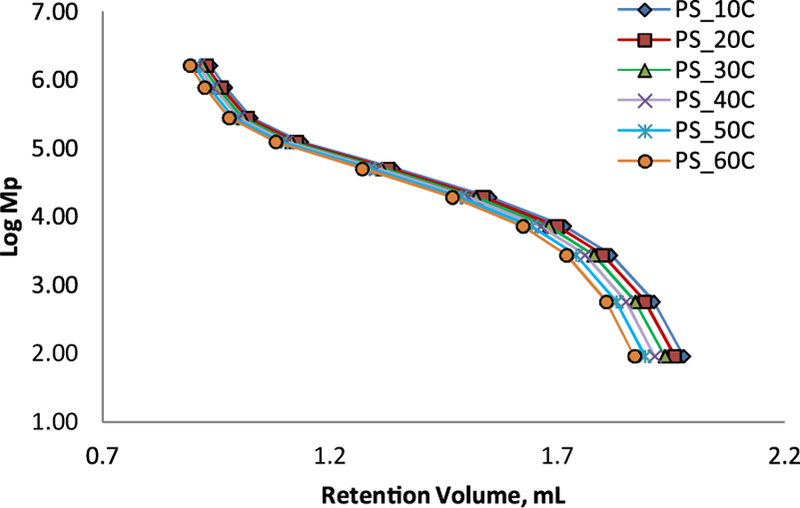
Calibration plots on C18 column for toluene and PS standards (Mp 580; 2780; 7350; 19,500; 51,200; 126,000; 282,000; 791,000 and 1,640,000) using 70/30 (v/v) THF/MeOH mobile phase. Instrumentation: Agilent 1100 with a variable wave-length detector set to 262 nm. Other conditions: injection volume = 1.0 µL; flow rate = 0.30 mL min−1; column temperature varied from 10 °C to 60 °C.
From a thermodynamic point of view, the distribution process can be described in terms of the solute distribution coefficient K [3]:
| (3) |
where R is the gas constant, T is the absolute temperature, ΔH° is the change in standard enthalpy of transfer between the solute and the stationary phase, and ΔS° is the change in standard conformational entropy for the solute transferred from the interstitial volume into the pores of the column packing. In ideal SEC, where there are no changes in enthalpic interactions, ΔH° = 0 and, therefore,
| (4) |
Eq. (4) implies that KSEC is temperature-independent, as the first order approximation. While this theory holds true [3], with the caveat that there will always be some degree of enthalpic contribution, even if only minimal, to any real-world SEC separation, experimental observations demonstrate that often an increase in column temperature leads to a decrease in elution volume [25].
Because enthalpic interactions generally decrease with increasing temperature, KSEC determined at a column temperature of 60 °C was used as the reference to calculate %ΔKSEC (the percent change in KSEC between each temperature and the reference temperature) for KSEC determined at column temperatures set to 50 °C, 40 °C, 30 °C, 20 °C, and 10 °C. The values of KSEC and %ΔKSEC are tabulated in Tables 4–11 for PS and PMMA standards on each column in each mobile phase. While there are no strict rules for an assessment of partition coefficientdependency on column temperature, here it will be regarded that, if %OKSEC is below 10% (and certainly below 5%), then solutes are considered to elute by a near-ideal SEC mechanism, virtually devoid of enthalpic interactions; and if %OKSEC is 10% or greater, then elution is by a non-ideal SEC mechanism, with substantial enthalpic contributions to the separation.
Table 4.
Calculated Ksec and% ΔKsec (from the reference Ksec at 60 °C) from elution volumes obtained for PS standards (Mp 282,000; 126,000; 51,200; 19,500; 7350; 2780; 580) on C18 column with a variety of 70/30 THF/solvent j mobile phases. Instrumentation: Agilent 1100 with a variable wavelength detector set to 262 nm. Other conditions: injection volume = 1.0 µL; flow rate = 0.30 mL min−1; column temperature varied from 10 °C to 60 °C.
| Column ID | Mobile Phase | PS Mp | Temperature |
||||||||||
|---|---|---|---|---|---|---|---|---|---|---|---|---|---|
| 10 °C |
20 °C |
30 °C | 40 °C | 50 °C | 60 °C | ||||||||
| Ksec | % ΔKsec | Ksec | % ΔKsec | Ksec | % ΔKsec | Ksec | % ΔKsec | Ksec | % ΔKsec | Ksec Reference | |||
| C18 | 70/30 (v/v) THF/MeOH | 282000 | 0.057 | −1.7 | 0.058 | 0.0 | 0.058 | 0.0 | 0.058 | 0.0 | 0.058 | 0.0 | 0.058 |
| 126000 | 0.166 | 0.6 | 0.167 | 1.2 | 0.166 | 0.6 | 0.167 | 1.2 | 0.166 | 0.6 | 0.165 | ||
| 51200 | 0.368 | 0.3 | 0.369 | 0.5 | 0.368 | 0.3 | 0.368 | 0.3 | 0.367 | 0.0 | 0.367 | ||
| 19500 | 0.577 | 0.0 | 0.578 | 0.2 | 0.577 | 0.0 | 0.578 | 0.2 | 0.577 | 0.0 | 0.577 | ||
| 7350 | 0.740 | −0.1 | 0.741 | 0.0 | 0.741 | 0.0 | 0.742 | 0.1 | 0.741 | 0.0 | 0.741 | ||
| 2780 | 0.840 | −0.2 | 0.842 | 0.0 | 0.841 | −0.1 | 0.842 | 0.0 | 0.842 | 0.0 | 0.842 | ||
| 580 | 0.934 | 0.1 | 0.935 | 0.0 | 0.934 | 0.1 | 0.935 | 0.0 | 0.934 | 0.1 | 0.935 | ||
| 70/30 (v/v) THF/ACN | 282000 | 0.056 | 1.8 | 0.056 | 1.8 | 0.056 | 1.8 | 0.055 | 0.0 | 0.055 | 0.0 | 0.055 | |
| 126000 | 0.165 | 3.1 | 0.164 | 2.5 | 0.163 | 1.9 | 0.162 | 1.3 | 0.161 | 0.6 | 0.160 | ||
| 51200 | 0.374 | 2.5 | 0.373 | 2.2 | 0.371 | 1.6 | 0.369 | 1.1 | 0.367 | 0.5 | 0.365 | ||
| 19500 | 0.593 | 1.7 | 0.592 | 1.5 | 0.589 | 1.0 | 0.588 | 0.9 | 0.585 | 0.3 | 0.583 | ||
| 7350 | 0.760 | 1.1 | 0.760 | 1.1 | 0.757 | 0.7 | 0.756 | 0.5 | 0.754 | 0.3 | 0.752 | ||
| 2780 | 0.861 | 0.7 | 0.860 | 0.6 | 0.857 | 0.2 | 0.858 | 0.4 | 0.856 | 0.1 | 0.855 | ||
| 580 | 0.953 | 0.8 | 0.952 | 0.7 | 0.948 | 0.3 | 0.948 | 0.3 | 0.946 | 0.1 | 0.945 | ||
| 70/30 (v/v) THF/eEtOH | 282000 | 0.049 | −5.8 | 0.050 | −3.8 | 0.050 | −3.8 | 0.051 | −1.9 | 0.051 | −1.9 | 0.052 | |
| 126000 | 0.148 | −1.3 | 0.149 | −0.7 | 0.149 | −0.7 | 0.150 | 0.0 | 0.150 | 0.0 | 0.150 | ||
| 51200 | 0.338 | −0.9 | 0.339 | −0.6 | 0.339 | −0.6 | 0.340 | −0.3 | 0.341 | 0.0 | 0.341 | ||
| 19500 | 0.544 | −1.1 | 0.546 | −0.7 | 0.547 | −0.5 | 0.548 | −0.4 | 0.549 | −0.2 | 0.550 | ||
| 7350 | 0.711 | −1.0 | 0.713 | −0.7 | 0.714 | −0.6 | 0.715 | −0.4 | 0.717 | −0.1 | 0.718 | ||
| 2780 | 0.816 | −1.0 | 0.819 | −0.6 | 0.820 | −0.5 | 0.820 | −0.5 | 0.823 | −0.1 | 0.824 | ||
| 580 | 0.921 | −0.6 | 0.924 | −0.3 | 0.924 | −0.3 | 0.924 | −0.3 | 0.927 | 0.0 | 0.927 | ||
| 70/30 (v/v) THF/DMF | 282000 | 0.040 | −11.1 | 0.042 | −6.7 | 0.044 | −2.2 | 0.044 | −2.2 | 0.045 | 0.0 | 0.045 | |
| 126000 | 0.132 | −2.2 | 0.133 | −1.5 | 0.135 | 0.0 | 0.135 | 0.0 | 0.135 | 0.0 | 0.135 | ||
| 51200 | 0.319 | −0.9 | 0.321 | −0.3 | 0.322 | 0.0 | 0.322 | 0.0 | 0.322 | 0.0 | 0.322 | ||
| 19500 | 0.536 | −0.6 | 0.538 | −0.2 | 0.539 | 0.0 | 0.539 | 0.0 | 0.538 | −0.2 | 0.539 | ||
| 7350 | 0.713 | −0.6 | 0.716 | −0.1 | 0.716 | −0.1 | 0.717 | 0.0 | 0.716 | −0.1 | 0.717 | ||
| 2780 | 0.824 | −0.5 | 0.827 | −0.1 | 0.826 | −0.2 | 0.828 | 0.0 | 0.827 | −0.1 | 0.828 | ||
| 580 | 0.921 | −0.8 | 0.925 | −0.3 | 0.924 | −0.4 | 0.927 | −0.1 | 0.926 | −0.2 | 0.928 | ||
| 70/30 (v/v) THF/IPA | 282000 | 0.053 | −5.4 | 0.054 | −3.6 | 0.054 | −3.6 | 0.055 | −1.8 | 0.055 | −1.8 | 0.056 | |
| 126000 | 0.158 | 0.0 | 0.158 | 0.0 | 0.158 | 0.0 | 0.158 | 0.0 | 0.159 | 0.6 | 0.158 | ||
| 51200 | 0.351 | −0.3 | 0.352 | 0.0 | 0.352 | 0.0 | 0.353 | 0.3 | 0.353 | 0.3 | 0.352 | ||
| 19500 | 0.556 | −0.5 | 0.557 | −0.4 | 0.558 | −0.2 | 0.559 | 0.0 | 0.560 | 0.2 | 0.559 | ||
| 7350 | 0.718 | −0.8 | 0.721 | −0.4 | 0.722 | −0.3 | 0.724 | 0.0 | 0.724 | 0.0 | 0.724 | ||
| 2780 | 0.822 | −0.7 | 0.825 | −0.4 | 0.827 | −0.1 | 0.828 | 0.0 | 0.828 | 0.0 | 0.828 | ||
| 580 | 0.927 | −0.2 | 0.929 | 0.0 | 0.929 | 0.0 | 0.930 | 0.1 | 0.931 | 0.2 | 0.929 | ||
| 70/30 (v/v) THF/chloroform | 282000 | 0.040 | −4.8 | 0.041 | −2.4 | 0.041 | −2.4 | 0.042 | 0.0 | 0.042 | 0.0 | 0.042 | |
| 126000 | 0.129 | −1.5 | 0.130 | −0.8 | 0.130 | −0.8 | 0.131 | 0.0 | 0.131 | 0.0 | 0.131 | ||
| 51200 | 0.310 | −1.0 | 0.311 | −0.6 | 0.312 | −0.3 | 0.312 | −0.3 | 0.313 | 0.0 | 0.313 | ||
| 19500 | 0.520 | −1.1 | 0.522 | −0.8 | 0.523 | −0.6 | 0.524 | −0.4 | 0.525 | −0.2 | 0.526 | ||
| 7350 | 0.694 | −1.0 | 0.696 | −0.7 | 0.698 | −0.4 | 0.699 | −0.3 | 0.701 | 0.0 | 0.701 | ||
| 2780 | 0.806 | −0.9 | 0.808 | −0.6 | 0.810 | −0.4 | 0.811 | −0.2 | 0.813 | 0.0 | 0.813 | ||
| 580 | 0.918 | −0.6 | 0.920 | −0.4 | 0.922 | −0.2 | 0.922 | −0.2 | 0.924 | 0.0 | 0.924 | ||
| 100% THF | 282000 | 0.038 | −7.3 | 0.039 | −4.9 | 0.041 | 0.0 | 0.042 | 2.4 | 0.041 | 0.0 | 0.041 | |
| 126000 | 0.121 | −4.0 | 0.123 | −2.4 | 0.124 | −1.6 | 0.125 | −0.8 | 0.125 | −0.8 | 0.126 | ||
| 51200 | 0.297 | −2.0 | 0.299 | −1.3 | 0.299 | −1.3 | 0.302 | −0.3 | 0.302 | −0.3 | 0.303 | ||
| 19500 | 0.509 | −1.4 | 0.511 | −1.0 | 0.511 | −1.0 | 0.514 | −0.4 | 0.515 | −0.2 | 0.516 | ||
| 7350 | 0.687 | −1.2 | 0.690 | −0.7 | 0.690 | −0.7 | 0.693 | −0.3 | 0.694 | −0.1 | 0.695 | ||
| 2780 | 0.802 | −0.9 | 0.805 | −0.5 | 0.805 | −0.5 | 0.808 | −0.1 | 0.808 | −0.1 | 0.809 | ||
| 580 | 0.915 | −0.5 | 0.917 | −0.3 | 0.917 | −0.3 | 0.920 | 0.0 | 0.920 | 0.0 | 0.920 | ||
Table 11.
Calculated Ksec and% ΔKsec (from the reference Ksec at 60 °C) from elution volumes obtained for PMMA standards (Mp 46,890; 20,310; 7360; 3070) on cyano column with a variety of 70/30 THF/solvent j mobile phases. Instrumentation and other conditions are as in Table 5.
| Column ID | Mobile Phase | PMMA Mp | Temperature |
||||||||||
|---|---|---|---|---|---|---|---|---|---|---|---|---|---|
| 10 °C |
20 °C |
30 °C |
40 °C |
50 °C |
60 °C | ||||||||
| Ksec | % ∆Ksec | Ksec | % ∆Ksec | Ksec | % ∆Ksec | Ksec | % ∆Ksec | Ksec | % ∆Ksec | Ksec Reference | |||
| Cyano | 70/30 THF/MeOH | 46890 | 0.414 | 6.4 | 0.412 | 5.9 | 0.402 | 3.3 | 0.396 | 1.8 | 0.392 | 0.8 | 0.389 |
| 20310 | 0.627 | 3.0 | 0.627 | 3.0 | 0.617 | 1.3 | 0.613 | 0.7 | 0.610 | 0.2 | 0.609 | ||
| 7360 | 0.799 | 1.4 | 0.802 | 1.8 | 0.791 | 0.4 | 0.789 | 0.1 | 0.788 | 0.0 | 0.788 | ||
| 3070 | 0.876 | 0.1 | 0.883 | 0.9 | 0.874 | −0.1 | 0.873 | −0.2 | 0.874 | −0.1 | 0.875 | ||
| 70/30 THF/ACN | 46890 | 0.378 | 3.6 | 0.376 | 3.0 | 0.374 | 2.5 | 0.370 | 1.4 | 0.367 | 0.5 | 0.365 | |
| 20310 | 0.597 | 1.9 | 0.595 | 1.5 | 0.594 | 1.4 | 0.590 | 0.7 | 0.588 | 0.3 | 0.586 | ||
| 7360 | 0.775 | 0.4 | 0.776 | 0.5 | 0.776 | 0.5 | 0.772 | 0.0 | 0.772 | 0.0 | 0.772 | ||
| 3070 | 0.867 | −0.1 | 0.868 | 0.0 | 0.870 | 0.2 | 0.867 | −0.1 | 0.867 | −0.1 | 0.868 | ||
| 70/30 THF/EtOH | 46890 | 0.437 | 8.7 | 0.428 | 6.5 | 0.421 | 4.7 | 0.414 | 3.0 | 0.407 | 1.2 | 0.402 | |
| 20310 | 0.647 | 4.2 | 0.641 | 3.2 | 0.635 | 2.3 | 0.630 | 1.4 | 0.625 | 0.6 | 0.621 | ||
| 7360 | 0.814 | 2.0 | 0.809 | 1.4 | 0.805 | 0.9 | 0.803 | 0.6 | 0.800 | 0.3 | 0.798 | ||
| 3070 | 0.889 | 0.3 | 0.888 | 0.2 | 0.887 | 0.1 | 0.887 | 0.1 | 0.886 | 0.0 | 0.886 | ||
| 70/30 THF/IPA | 46890 | 0.460 | 11.1 | 0.447 | 8.0 | 0.438 | 5.8 | 0.428 | 3.4 | 0.420 | 1.4 | 0.414 | |
| 20310 | 0.669 | 5.7 | 0.659 | 4.1 | 0.651 | 2.8 | 0.644 | 1.7 | 0.637 | 0.6 | 0.633 | ||
| 7360 | 0.844 | 4.5 | 0.826 | 2.2 | 0.820 | 1.5 | 0.814 | 0.7 | 0.810 | 0.2 | 0.808 | ||
| 3070 | 0.902 | 1.1 | 0.899 | 0.8 | 0.896 | 0.4 | 0.894 | 0.2 | 0.892 | 0.0 | 0.892 | ||
| 100% THF | 46890 | 0.396 | 3.4 | 0.395 | 3.1 | 0.394 | 2.9 | 0.389 | 1.6 | 0.386 | 0.8 | 0.383 | |
| 20310 | 0.614 | 1.8 | 0.613 | 1.7 | 0.613 | 1.7 | 0.607 | 0.7 | 0.606 | 0.5 | 0.603 | ||
| 7360 | 0.791 | 0.5 | 0.791 | 0.5 | 0.793 | 0.8 | 0.788 | 0.1 | 0.788 | 0.1 | 0.787 | ||
| 3070 | 0.882 | 0.2 | 0.882 | 0.2 | 0.884 | 0.5 | 0.880 | 0.0 | 0.881 | 0.1 | 0.880 | ||
From Tables 4–11, calculated %ΔKSEC indicate that elution of PS and PMMA standards on the C18, C4, phenyl, and cyano columns is by a near-ideal SEC mechanism, where enthalpic contributions are practically absent. The exception is the elution of high molar mass PS solute (282,000) where enthalpic contributions are seen in 70/30 (v/v) THF/DMF mobile phase on the C18 column at 10 °C, and on the cyano column in 70/30 (v/v) THF/DMF mobile phase within the entire 10 °C–60 °C range, and in 70/30 (v/v) THF/chloroform mobile phase at 10 °C–20 °C. As for PMMA, it appears that standards of higher molar mass (above 46,890) could experience non-ideal SEC in mobile phases containing alcohol (MeOH, EtOH, IPA) at subambient column temperatures of 10 °C–20 °C.
In the present experiments, it was observed that the elution volumes of toluene, PS and PMMA solutes decrease with increasing temperature with all mobile phase/stationary phase combinations studied (see Figs. 10 and 11 as an example of calibration plots on the C18 column using 70/30 (v/v) THF/MeOH mobile phase; plots on the other columns in the other mobile phases were similar and, therefore, not shown). Moreover, elution volumes of toluene are affected by the temperature change to a higher degree than were the volumes of the polymeric solutes (e.g., for the 10 °C–60 °C temperature change: 0.109 mL change in retention volume of toluene versus 0.104 mL change for Mp 580; 0.098 mL for Mp 2780; and 0.092 mL for Mp 7350 in Fig. 10).
Fig. 11.

Calibration plots on C18 column for PMMA standards (Mp 46,890; 20,310; 7360; 3070) using 70/30 (v/v) THF/MeOH mobile phase. Instrumentation: Agilent 1100 with a variable wavelength detector set to 230 nm. Other conditions as in Fig. 10.
For the Vr of a solute to change four scenarios are possible: (i) non-SEC interactions (e.g., adsorption) of the solutes with the stationary phase; and/or (ii) the size of the molecules changes with temperature; and/or (iii) changes in accessible volume of the column (total permeation volume, Vt) occur; and/or (iv) the mobile phase contracts or expands with temperature, resulting in a decrease or increase in the flow velocity within the column, which in turn increases or decreases the apparent retention volumes of the solutes [3].
Scenario (i) suggests that KSEC of the solutes would change due to enthalpic interactions. This scenario can be ruled out because KSEC of PS and PMMA were nearly constant. Thus the decrease in the elution volumes of these polymers with increased column temperature is not mainly associated with enthalpic contributions of solute interactions with the stationary phase as elution of these solutes is by near-ideal SEC.
Scenario (ii) is possible as the size (hydrodynamic volume) of a solute can change with temperature [26]. However, in our experiments the size change does not appear to be the main contributing factor. For example, the retention volumes of PS solutes decrease with increasing temperature when 100% THF mobile phase is used. Thus, one might assume that the hydrodynamic volumes of PS solutes increase with increasing temperature. However, Mori et al. [26] determined that intrinsic viscosity (and therefore hydrodynamic volume) of PS in THF was almost unchanged when the temperature varied from 20 °C to 55 °C. Furthermore, the elution of toluene is also affected by the changes in column temperature, where its elution volume decreases with the increase in temperature. Because toluene is not expected to increase in size as a function of temperature, its decrease in elution volumes with increasing temperature is not due to a change in hydrodynamic volume.
For scenario (iii), a possible explanation could be that changes in solvation interactions between the stationary phase and the solvent affect column pore volume. From Fig. 12 it is seen that elution volumes of toluene decrease when column temperature is increased from 10 °C to 60 °C. This suggests that column pore volumes decrease with increased temperature. It is reasonable to consider the conformational mobilities of the stationary phase [27,28], the preferential solvation of the stationary phase, and the temperature dependence of each. However, while studies of the effect of temperature on the solvation interactions of organic solvents with reversed-phase stationary phases show that the total amount of solvent adsorbed by the stationary phase decreases with increasing column temperature [29,30], it does not appear to be a factor contributing to the decreased retention volumes of toluene (and polymers). This is because the decrease of solvent adsorption onto the stationary phase would not lead to the decrease in total pore volume of the column, if pore volume was assumed to play a role in the temperature effect.
Fig. 12.

Elution volumes of toluene at 10 °C and 60 °C. Instrumentation and other conditions as in Fig. 10.
Scenario (iv) is therefore the most probable cause of the changes in elution volumes of toluene and polymers with temperature. It is possible that at a low temperature (10 °C) a thermal contraction of the mobile phase causes the flow velocity to decrease within the column, increasing the retention time (and calculated elution volume, if the flow rate is assumed constant) of solutes. Similarly, at a high temperature (60 °C) a thermal expansion of the mobile phase causes the linear flow velocity to increase, decreasing the retention time (and calculated elution volume, if the flow rate is again assumed constant). The increase in linear flow velocity is approximately 3–5% (judged from the elution of the excluded PS Mp 791,000) when column temperature is increased from 10 °C to 60 °C in 100% THF and in 30%-modified mobile phases. Experimental data of the current temperature study shows that the decrease in elution volumes of PS solutes corresponds to this increase in linear flow velocity at the same experimental conditions (Fig. 10, as an example). Note that, smaller molar mass polymers, and even more so toluene, experience larger change in elution volumes than their larger molar mass counterparts. Nevertheless, these possible effects of the mobile phase on the flow rate, if present, can be controlled experimentally.
5. Conclusions
The elution of polymers using binary solvents on reversed-phase columns is complex. An attempt was made to interpret the effect of solvent type and solvent modifier concentration on the stationary phase properties and on the elution of polymers. Note that these observations serve only as an approximation because the interactions of solvents with the stationary phases may be dependent on many factors, such as the extent of surface homogeneity, bonding density, residual silanols, etc., which can vary from column to column with the same stationary phase chemistry, leading to slight variations. The effect of column temperature on the mechanism of elution (either near-ideal or non-ideal SEC) was also studied by an assessment of the partition coefficient changes with temperature.
With an appropriate solvent modifier, common reversed-phase columns (C18, C4, phenyl, and cyano) have the potential to act as virtually inert surfaces suitable for the analysis of polymers by SEC. THF remains the solvent of choice as the main component in the mobile phase since it is a strong solvent and is preferentially adsorbed on the surface of non-polar and medium polarity stationary phases.
The use of binary mixtures that are comprised of a strong (good) and a weak (poor) solvent not only benefits the pore volume of the column, but also impacts the size of polymeric coils. The impact is two-fold, however: (i) change of the polymeric coil size, and possible shape, and (ii) change of the stationary phase pore volume. Increased pore volume can provide an extension of the separation range in the high molar mass region and thus can increase resolution in that region. However, the resulting steepness of a calibration curve can increase, causing decreased resolution in the low molar mass region. If the effect of this impact is properly moderated, then the greatest benefit of optimized solute resolution can be achieved. These advantages are stationary-phase- and polymer-type-dependent and cannot be fully realized on all columns and/or for all polymers.
However, the SEC separation mechanism is, in theory, temperature-independent. Here, over a 50 °C range, PS and PMMA solutes were shown to nearly always elute by this mechanism on the C18, C4, phenyl, and cyano columns in 100% THF and in binary THF mobile phases modified with other solvents. Silica-based RP columns are described by excellent efficiency (due to small particle sizes), rigidity, lower cost, and the ability to be used in both aqueous and organic HPLC modes. These properties make them very attractive for SEC. Particle pore sizes of 300 Å of RP columns can accommodate a wide range of polymer molar masses (up to approximately 300,000 g mol−1 for PS). As seen in our experiments, increasing pore volume of a column can lead to increased resolution in the high molar mass range of solutes, but decreased resolution in the small molar mass range. Therefore, the pore size of a column should be selected based on the range of the polymeric solutes of interest. Chromatographic resolution of solutes can be enhanced by extending the length of a column. Almost all RP columns are available in 250 mm lengths, as opposed to the 150 mm columns used in this study. However, a wide acceptance of RP columns for SEC will depend on the availability of columns with large pore sizes to cover an even wider range of molar masses than that studied here. A further development in RP column technology that would target significantly higher column phase ratios is necessary.
Supplementary Material
Figure 1S Effect of solvent concentration in the mobile phase on stationary phase characteristics relevant to size exclusion: total permeation volume Vt (A, a), interstitial volume V0 (B, b), pore volume Vi (C, c), and phase ratio, Vi/V0 (D, d) - a, b, c and d are the same as A, B, C, D, but fewer solvents in the plot for clarity. Column type: C18. Instrumentation: Agilent 1100 with a variable wavelength detector set to 262 nm. Other conditions: injection volume = 1.0 µL; flow rate = 0.30 mL/min; column temperature = 30˚C (thermostatted).
Figure 4S Effect of solvent concentration in the mobile phase on stationary phase characteristics relevant to size exclusion: total permeation volume Vt (A, a), interstitial volume V0 (B, b), pore volume Vi (C, c), and phase ratio, Vi/V0 (D, d) - a, b, c and d are the same as A, B, C, D, but fewer solvents in the plot for clarity. Column type: cyano. Instrumentation and other conditions as in Fig. 1S.
Figure 5S Comparison of chromatogram for PS calibrants on C18 column using unstabilized THF and 70/30 (v/v) THF/solvent j as the mobile phase. Molar masses of PS standards (g/mol): 791,000; 282,000; 126,000; 51,200; 19,500; 7,350; 2,870; and 580. Instrumentation and other conditions as in Fig. 1S.
Figure 6S Comparison of chromatograms for PS calibrants on C4 column using unstabilized THF and 70/30 (v/v) THF/solvent j as the mobile phase. Molar masses of PS standards (g/mol): 791,000; 282,000; 126,000; 51,200; 19,500; 7,350; 2,870; and 580. Instrumentation and other conditions as in Fig. 1S.
Figure 7S Comparison of chromatograms for PS calibrants on phenyl column using unstabilized THF and 70/30 (v/v) THF/solvent j as the mobile phase. Molar masses of PS standards (g/mol): 791,000; 282,000; 126,000; 51,200; 19,500; 7,350; 2,870; and 580. Instrumentation and other conditions as in Fig. 1S.
Figure 8S Comparison of chromatograms for PS calibrants on cyano column using unstabilized THF and 70/30 (v/v) THF/solvent j as the mobile phase. Molar masses of PS standards (g/mol): 791,000; 282,000; 126,000; 51,200; 19,500; 7,350; 2,870; and 580. Instrumentation and other conditions as in Fig. 1S.
Figure 9S Calibration plots on C4 column with toluene and PS standards (Mp 580; 2,780; 7,350; 19,500; 51,200; 126,000; 282,000; 791,000 and 1,640,00) using 70/30 (v/v) THF/MeOH mobile phase. Instrumentation: Agilent 1100 with a variable wavelength detector set to 262 nm. Other conditions: injection volume = 1.0 µL; flow rate = 0.30 mL/min.; column temperature varied from 10˚C to 60˚C.
Figure 10S Calibration plots on C4 column with PMMA standards (Mp 46,890; 20,310; 7,360; 3,070) using 70/30 (v/v) THF/MeOH mobile phase. Instrumentation: Agilent 1100 with a variable wavelength detector set to 230 nm. Instrumentation: Agilent 1100 with a variable wavelength detector set to 230 nm. Other conditions as in Fig. 9S.
Figure 11S Calibration plots on Phenyl column with toluene and PS standards (Mp 580; 2,780; 7,350; 19,500; 51,200; 126,000; 282,000; 791,000 and 1,640,00) using 70/30 (v/v) THF/MeOH mobile phase. Instrumentation and other conditions as in Fig. 9S.
Figure 12S Calibration plots on Phenyl column with PMMA standards (Mp 46,890; 20,310; 7,360; 3,070) using 70/30 (v/v) THF/MeOH mobile phase. Instrumentation and other conditions as in Fig. 10S.
Figure 13S Calibration plots on Cyano column with toluene and PS standards (Mp 580; 2,780; 7,350; 19,500; 51,200; 126,000; 282,000; 791,000 and 1,640,00) using 70/30 (v/v) THF/MeOH mobile phase. Instrumentation and other conditions as in Fig. 9S.
Figure 14S Calibration plots on Cyano column with PMMA standards (Mp 46,890; 20,310; 7,360; 3,070) using 70/30 (v/v) THF/MeOH mobile phase. Instrumentation and other conditions as in Fig. 10S.
Figure 2S Effect of solvent concentration in the mobile phase on stationary phase characteristics relevant to size exclusion: total permeation volume Vt (A, a), interstitial volume V0 (B, b), pore volume Vi (C, c), and phase ratio, Vi/V0 (D, d) - a, b, c and d are the same as A, B, C, D, but fewer solvents in the plot for clarity. Column type: C4. Instrumentation and other conditions as in Fig. 1S.
Figure 3S Effect of solvent concentration in the mobile phase on stationary phase characteristics relevant to size exclusion: total permeation volume Vt (A, a), interstitial volume V0 (B, b), pore volume Vi (C, c), and phase ratio, Vi/V0 (D, d) - a, b, c and d are the same as A, B, C, D, but fewer solvents in the plot for clarity. Column type: phenyl. Instrumentation and other conditions as in Fig. 1S.
Table 5.
Calculated Ksec and% ΔKsec (from the reference Ksec at 60 °C) from elution volumes obtained for PMMA standards (Mp 46,890; 20,310; 7360; 3070) on C18 column with a variety of 70/30 THF/solvent j mobile phases. Instrumentation: Agilent 1100 with a variable wavelength detector set to 230 nm. Other conditions: injection volume = 1.0 µL; flow rate = 0.30 mL min−1; column temperature varied from 10 °C to 60 °C.
| Column ID | Mobile Phase | PMMA Mp | Temperature |
||||||||||
|---|---|---|---|---|---|---|---|---|---|---|---|---|---|
| 10 °C |
20 °C |
30 °C |
40 °C |
50 °C |
60 °C | ||||||||
| Ksec | % ∆Ksec | Ksec | % ∆Ksec | Ksec | % ∆Ksec | Ksec | % ∆Ksec | Ksec | % ∆Ksec | Ksec Reference | |||
| C18 | 70/30 (v/v) THF/MeOH | 46890 | 0.354 | 6.0 | 0.349 | 4.5 | 0.345 | 3.3 | 0.342 | 2.4 | 0.337 | 0.9 | 0.334 |
| 20310 | 0.544 | 2.3 | 0.541 | 1.7 | 0.539 | 1.3 | 0.537 | 0.9 | 0.533 | 0.2 | 0.532 | ||
| 7360 | 0.698 | 0.0 | 0.698 | 0.0 | 0.698 | 0.0 | 0.698 | 0.0 | 0.697 | −0.1 | 0.698 | ||
| 3070 | 0.783 | −1.0 | 0.785 | −0.8 | 0.787 | −0.5 | 0.788 | −0.4 | 0.789 | −0.3 | 0.791 | ||
| 70/30 (v/v) TH F/ACN | 46890 | 0.329 | 2.2 | 0.328 | 1.9 | 0.326 | 1.2 | 0.325 | 0.9 | 0.323 | 0.3 | 0.322 | |
| 20310 | 0.526 | 0.4 | 0.526 | 0.4 | 0.525 | 0.2 | 0.525 | 0.2 | 0.524 | 0.0 | 0.524 | ||
| 7360 | 0.688 | −1.1 | 0.690 | −0.9 | 0.691 | −0.7 | 0.693 | −0.4 | 0.694 | −0.3 | 0.696 | ||
| 3070 | 0.779 | −1.6 | 0.782 | −1.3 | 0.785 | −0.9 | 0.787 | −0.6 | 0.790 | −0.3 | 0.792 | ||
| 70/30 (v/v) THF/EtOH | 46890 | 0.362 | 6.2 | 0.356 | 4.4 | 0.352 | 3.2 | 0.348 | 2.1 | 0.343 | 0.6 | 0.341 | |
| 20310 | 0.549 | 2.2 | 0.545 | 1.5 | 0.543 | 1.1 | 0.541 | 0.7 | 0.538 | 0.2 | 0.537 | ||
| 7360 | 0.701 | −0.1 | 0.700 | −0.3 | 0.701 | −0.1 | 0.701 | −0.1 | 0.701 | −0.1 | 0.702 | ||
| 3070 | 0.786 | −1.1 | 0.787 | −1.0 | 0.789 | −0.8 | 0.791 | 0.5 | 0.793 | −0.3 | 0.795 | ||
| 70/30 (v/v) THF/IPA | 46890 | 0.354 | 6.0 | 0.349 | 4.5 | 0.348 | 4.2 | 0.341 | 2.1 | 0.338 | 1.2 | 0.334 | |
| 20310 | 0.541 | 2.1 | 0.537 | 1.3 | 0.535 | 0.9 | 0.533 | 0.6 | 0.533 | 0.6 | 0.530 | ||
| 7360 | 0.692 | −0.4 | 0.692 | −0.4 | 0.690 | −0.7 | 0.693 | −0.3 | 0.695 | 0.0 | 0.695 | ||
| 3070 | 0.777 | −1.4 | 0.779 | −1.1 | 0.777 | −1.4 | 0.784 | −0.5 | 0.787 | −0.1 | 0788 | ||
| 100% THF | 46890 | 0.342 | 3.3 | 0.340 | 2.7 | 0.339 | 2.4 | 0.337 | 1.8 | 0.333 | 0.6 | 0.331 | |
| 20310 | 0.538 | 1.1 | 0.537 | 0.9 | 0.536 | 0.8 | 0.535 | 0.6 | 0.532 | 0.0 | 0.532 | ||
| 7360 | 0.704 | −0.1 | 0.705 | 0.0 | 0.705 | 0.0 | 0.706 | 0.1 | 0.705 | 0.0 | 0.705 | ||
| 3070 | 0.797 | −0.7 | 0.799 | −0.5 | 0.800 | −0.4 | 0.802 | −0.1 | 0.802 | −0.1 | 0.803 | ||
Table 6.
Calculated Ksec and% ΔKsec (from the reference Ksec at 60 °C) from elution volumes obtained for PS standards (Mp 282,000; 126,000; 51,200; 19,500; 7350; 2780; 580) on C4 column with a variety of 70/30 THF/solvent j mobile phases. Instrumentation and other conditions are as in Table 4.
| Column ID | Mobile Phase | PMMA Mp | Temperature |
||||||||||
|---|---|---|---|---|---|---|---|---|---|---|---|---|---|
| 10 °C |
20 °C |
30 °C |
40 °C |
50 °C |
60 °C | ||||||||
| Ksec | % ∆Ksec | Ksec | % ∆Ksec | Ksec | % ∆Ksec | Ksec | % ∆Ksec | Ksec | % ∆Ksec | Ksec Reference | |||
| C4 | 70/30 (v/v) THF/MeOH | 282000 | 0.068 | −1.4 | 0.068 | −1.4 | 0.069 | 0.0 | 0.068 | −1.4 | 0.069 | 0.0 | 0.069 |
| 126000 | 0.191 | 0.0 | 0.191 | 0.0 | 0.191 | 0.0 | 0.191 | 0.0 | 0.191 | 0.0 | 0.191 | ||
| 51200 | 0.419 | 0.2 | 0.418 | 0.0 | 0.418 | 0.0 | 0.418 | 0.0 | 0.418 | 0.0 | 0.418 | ||
| 19500 | 0.644 | 0.2 | 0.644 | 0.2 | 0.643 | 0.0 | 0.644 | 0.2 | 0.644 | 0.2 | 0.643 | ||
| 7350 | 0.812 | 0.2 | 0.811 | 0.1 | 0.811 | 0.1 | 0.812 | 0.2 | 0.811 | 0.1 | 0.810 | ||
| 2780 | 0.910 | 0.2 | 0.909 | 0.1 | 0.908 | 0.0 | 0.909 | 0.1 | 0.908 | 0.0 | 0.908 | ||
| 580 | 0.990 | 0.2 | 0.989 | 0.1 | 0.988 | 0.0 | 0.989 | 0.1 | 0.988 | 0.0 | 0.988 | ||
| 70/30 (v/v) THF/ACN | 282000 | 0.067 | 0.0 | 0.067 | 0.0 | 0.067 | 0.0 | 0.067 | 0.0 | 0.067 | 0.0 | 0.067 | |
| 126000 | 0.191 | 2.1 | 0.190 | 1.6 | 0.189 | 1.1 | 0.189 | 1.1 | 0.188 | 0.5 | 0.187 | ||
| 51200 | 0.427 | 1.7 | 0.426 | 1.4 | 0.423 | 0.7 | 0.423 | 0.7 | 0.421 | 0.2 | 0.420 | ||
| 19500 | 0.659 | 1.1 | 0.658 | 0.9 | 0.655 | 0.5 | 0.656 | 0.6 | 0.654 | 0.3 | 0.652 | ||
| 7350 | 0.825 | 0.5 | 0.825 | 0.5 | 0.824 | 0.4 | 0.824 | 0.4 | 0.823 | 0.2 | 0.821 | ||
| 2780 | 0.919 | 0.2 | 0.919 | 0.2 | 0.918 | 0.1 | 0.919 | 0.2 | 0.919 | 0.2 | 0.917 | ||
| 580 | 0.990 | −0.1 | 0.991 | 0.0 | 0.990 | −0.1 | 0.992 | 0.1 | 0.992 | 0.1 | 0.991 | ||
| 70/30 (v/v) THF/EtOH | 282000 | 0.054 | −6.9 | 0.055 | −5.2 | 0.057 | −1.7 | 0.057 | −1.7 | 0.057 | −1.7 | 0.058 | |
| 126000 | 0.161 | −1.8 | 0.162 | −1.2 | 0.163 | −0.6 | 0.163 | −0.6 | 0.163 | −0.6 | 0.164 | ||
| 51200 | 0.369 | −1.3 | 0.370 | −1.1 | 0.372 | −0.5 | 0.372 | −0.5 | 0.373 | −0.3 | 0.374 | ||
| 19500 | 0.590 | −1.2 | 0.591 | −1.0 | 0.594 | −0.5 | 0.594 | −0.5 | 0.596 | −0.2 | 0.597 | ||
| 7350 | 0.763 | −1.0 | 0.765 | −0.8 | 0.767 | −0.5 | 0.768 | −0.4 | 0.770 | −0.1 | 0.771 | ||
| 2780 | 0.869 | −0.9 | 0.871 | −0.7 | 0.873 | −0.5 | 0.874 | −0.3 | 0.876 | −0.1 | 0.877 | ||
| 580 | 0.966 | −0.6 | 0.968 | −0.4 | 0.969 | −0.3 | 0.970 | −0.2 | 0.972 | 0.0 | 0.972 | ||
| 70/30 (v/v) THF/EtOH | 282000 | 0.049 | −5.8 | 0.050 | −3.8 | 0.051 | −1.9 | 0.051 | −1.9 | 0.052 | 0.0 | 0.052 | |
| 126000 | 0.148 | 0.0 | 0.147 | −0.7 | 0.149 | 0.7 | 0.148 | 0.0 | 0.148 | 0.0 | 0.148 | ||
| 51200 | 0.353 | 0.0 | 0.352 | −0.3 | 0.354 | 0.3 | 0.352 | −0.3 | 0.353 | 0.0 | 0.353 | ||
| 19500 | 0.583 | 0.2 | 0.583 | 0.2 | 0.584 | 0.3 | 0.582 | 0.0 | 0.582 | 0.0 | 0.582 | ||
| 7350 | 0.765 | 0.4 | 0.764 | 0.3 | 0.764 | 0.3 | 0.763 | 0.1 | 0.763 | 0.1 | 0.762 | ||
| 2780 | 0.873 | 0.3 | 0.872 | 0.2 | 0.872 | 0.2 | 0.871 | 0.1 | 0.871 | 0.1 | 0.870 | ||
| 580 | 0.962 | 0.2 | 0.961 | 0.1 | 0.960 | 0.0 | 0.961 | 0.1 | 0.960 | 0.0 | 0.960 | ||
| 70/30 (v/v) THF/IPA | 282000 | 0.057 | −5.0 | 0.058 | −3.3 | 0.059 | −1.7 | 0.059 | −1.7 | 0.060 | 0.0 | 0.060 | |
| 126000 | 0.167 | −1.2 | 0.168 | −0.6 | 0.167 | −1.2 | 0.168 | −0.6 | 0.169 | 0.0 | 0.169 | ||
| 51200 | 0.378 | −1.0 | 0.380 | −0.5 | 0.380 | −0.5 | 0.381 | −0.3 | 0.382 | 0.0 | 0.382 | ||
| 19500 | 0.600 | −1.0 | 0.602 | −0.7 | 0.602 | −0.7 | 0.603 | −0.5 | 0.604 | −0.3 | 0.606 | ||
| 7350 | 0.771 | −0.8 | 0.773 | −0.5 | 0.773 | −0.5 | 0.775 | −0.3 | 0.776 | −0.1 | 0.777 | ||
| 2780 | 0.875 | −0.7 | 0.876 | −0.6 | 0.877 | −0.5 | 0.878 | −0.3 | 0.880 | −0.1 | 0.881 | ||
| 580 | 0.967 | −0.5 | 0.968 | −0.4 | 0.968 | −0.4 | 0.969 | −0.3 | 0.970 | −0.2 | 0.972 | ||
| 70/30 (v/v) THF/chloroform | 282000 | 0.048 | −4.0 | 0.048 | −4.0 | 0.049 | −2.0 | 0.049 | −2.0 | 0.050 | 0.0 | 0.050 | |
| 126000 | 0.144 | −0.7 | 0.144 | −0.7 | 0.144 | −0.7 | 0.145 | 0.0 | 0.145 | 0.0 | 0.145 | ||
| 51200 | 0.343 | −0.6 | 0.344 | −0.3 | 0.344 | −0.3 | 0.344 | −0.3 | 0.344 | −0.3 | 0.345 | ||
| 19500 | 0.567 | −0.5 | 0.569 | −0.2 | 0.569 | −0.2 | 0.569 | −0.2 | 0.570 | 0.0 | 0.570 | ||
| 7350 | 0.747 | −0.4 | 0.749 | −0.1 | 0.749 | −0.1 | 0.749 | −0.1 | 0.750 | 0.0 | 0.750 | ||
| 2780 | 0.858 | −0.3 | 0.860 | −0.1 | 0.860 | −0.1 | 0.860 | −0.1 | 0.861 | 0.0 | 0.861 | ||
| 580 | 0.960 | −0.2 | 0.962 | 0.0 | 0.962 | 0.0 | 0.962 | 0.0 | 0.962 | 0.0 | 0.962 | ||
| 100% THF | 282000 | 0.043 | −8.5 | 0.044 | −6.4 | 0.044 | −6.4 | 0.046 | −2.1 | 0.046 | −2.1 | 0.047 | |
| 126000 | 0.134 | −3.6 | 0.135 | −2.9 | 0.134 | −3.6 | 0.137 | −1.4 | 0.138 | −0.7 | 0.139 | ||
| 51200 | 0.329 | −2.1 | 0.331 | −1.5 | 0.328 | −2.4 | 0.333 | −0.9 | 0.333 | −0.9 | 0.336 | ||
| 19500 | 0.556 | −1.4 | 0.559 | −0.9 | 0.554 | −1.8 | 0.561 | −0.5 | 0.561 | −0.5 | 0.564 | ||
| 7350 | 0.742 | −0.9 | 0.744 | −0.7 | 0.737 | −1.6 | 0.745 | −0.5 | 0.746 | −0.4 | 0.749 | ||
| 2780 | 0.856 | −0.8 | 0.859 | −0.5 | 0.850 | −1.5 | 0.859 | −0.5 | 0.860 | −0.3 | 0.863 | ||
| 580 | 0.961 | −0.5 | 0.963 | −0.3 | 0.953 | −1.3 | 0.963 | −0.3 | 0.963 | −0.3 | 0.966 | ||
Table 7.
Calculated Ksec and% ΔKsec (from the reference Ksec at 60 °C) from elution volumes obtained for PMMA standards (Mp 46,890; 20,310; 7360; 3070) on C4 column with a variety of 70/30 THF/solvent j mobile phases. Instrumentation and other conditions are as in Table 5.
| Column ID | Mobile Phase | PMMA Mp | Temperature |
||||||||||
|---|---|---|---|---|---|---|---|---|---|---|---|---|---|
| 10 °C |
20 °C |
30 °C |
40 °C |
50 °C |
60 °C | ||||||||
| Ksec | % ∆Ksec | Ksec | % ∆Ksec | Ksec | % ∆Ksec | Ksec | % ∆Ksec | Ksec | % ∆Ksec | Ksec Reference | |||
| C4 | 70/30 (v/v) THF/MeOH | 46890 | 0.402 | 6.6 | 0.397 | 5.3 | 0.391 | 3.7 | 0.386 | 2.4 | 0.382 | 1.3 | 0.377 |
| 20310 | 0.611 | 3.0 | 0.607 | 2.4 | 0.603 | 1.7 | 0.600 | 1.2 | 0.597 | 0.7 | 0.593 | ||
| 7360 | 0.773 | 0.7 | 0.772 | 0.5 | 0.771 | 0.4 | 0.770 | 0.3 | 0.769 | 0.1 | 0.768 | ||
| 3070 | 0.862 | −0.1 | 0.862 | −0.1 | 0.862 | −0.1 | 0.863 | 0.0 | 0.864 | 0.1 | 0.863 | ||
| 70/30 (v/v) TH F/ACN | 46890 | 0.368 | 2.2 | 0.365 | 1.4 | 0.366 | 1.7 | 0.362 | 0.6 | 0.360 | 0.0 | 0.360 | |
| 20310 | 0.582 | 0.5 | 0.580 | 0.2 | 0.582 | 0.5 | 0.580 | 0.2 | 0.579 | 0.0 | 0.579 | ||
| 7360 | 0.751 | −0.9 | 0.752 | −0.8 | 0.756 | −0.3 | 0.755 | −0.4 | 0.756 | −0.3 | 0.758 | ||
| 3070 | 0.844 | −1.4 | 0.846 | −1.2 | 0.852 | −0.5 | 0.852 | −0.5 | 0.854 | −0.2 | 0.856 | ||
| 70/30 (v/v) THF/EtOH | 46890 | 0.412 | 7.9 | 0.404 | 5.8 | 0.398 | 4.2 | 0.391 | 2.4 | 0.385 | 0.8 | 0.382 | |
| 20310 | 0.610 | 2.9 | 0.605 | 2.0 | 0.602 | 1.5 | 0.598 | 0.8 | 0.594 | 0.2 | 0.593 | ||
| 7360 | 0.767 | 0.4 | 0.765 | 0.1 | 0.765 | 0.1 | 0.764 | 0.0 | 0.763 | −0.1 | 0.764 | ||
| 3070 | 0.853 | −0.7 | 0.854 | −0.6 | 0.856 | −0.3 | 0.857 | −0.2 | 0.857 | −0.2 | 0.859 | ||
| 70/30 (v/v) THF/IPA | 46890 | 0.406 | 6.8 | 0.398 | 4.7 | 0.392 | 3.2 | 0.387 | 1.8 | 0.382 | 0.5 | 0.380 | |
| 20310 | 0.607 | 2.7 | 0.602 | 1.9 | 0.598 | 1.2 | 0.595 | 0.7 | 0.592 | 0.2 | 0.591 | ||
| 7360 | 0.764 | 0.1 | 0.762 | −0.1 | 0.761 | −0.3 | 0.761 | −0.3 | 0.761 | −0.3 | 0.763 | ||
| 3070 | 0.851 | −0.8 | 0.851 | −0.8 | 0.852 | −0.7 | 0.853 | −0.6 | 0.854 | −0.5 | 0.858 | ||
| 100% THF | 46890 | 0.376 | 3.3 | 0.375 | 3.0 | 0.370 | 1.6 | 0.369 | 1.4 | 0.366 | 0.5 | 0.364 | |
| 20310 | 0.586 | 1.2 | 0.586 | 1.2 | 0.580 | 0.2 | 0.582 | 0.5 | 0.580 | 0.2 | 0.579 | ||
| 7360 | 0.759 | 0.1 | 0.759 | 0.1 | 0.753 | −0.7 | 0.758 | 0.0 | 0.757 | −0.1 | 0.758 | ||
| 3070 | 0.855 | −0.2 | 0.855 | −0.2 | 0.849 | −0.9 | 0.855 | −0.2 | 0.855 | −0.2 | 0.857 | ||
Table 8.
Calculated Ksec and% ΔKsec (from the reference Ksec at 60 °C) from elution volumes obtained for PS standards (Mp 282,000; 126,000; 51,200; 19,500; 7350; 2780; 580) on phenyl column with a variety of 70/30 THF/solvent j mobile phases. Instrumentation and other conditions are as in Table 4.
| Column ID | Mobile Phase | PS Mp | Temperature |
||||||||||
|---|---|---|---|---|---|---|---|---|---|---|---|---|---|
| 10 °C |
20 °C |
30 °C |
40 °C |
50 °C |
60 °C | ||||||||
| Ksec | % ∆Ksec | Ksec | % ∆Ksec | Ksec | % ∆Ksec | Ksec | % ∆Ksec | Ksec | % ∆Ksec | Ksec Reference | |||
| Phenyl | 70/30 (v/v) THF/MeOH | 282000 | 0.088 | −2.2 | 0.087 | −3.3 | 0.089 | −1.1 | 0.089 | −1.1 | 0.090 | 0.0 | 0.090 |
| 126000 | 0.243 | −1.2 | 0.242 | −1.6 | 0.244 | −0.8 | 0.244 | −0.8 | 0.245 | −0.4 | 0.246 | ||
| 51200 | 0.498 | −0.8 | 0.499 | −0.6 | 0.500 | −0.4 | 0.502 | 0.0 | 0.502 | 0.0 | 0.502 | ||
| 19500 | 0.718 | −0.6 | 0.718 | −0.6 | 0.719 | −0.4 | 0.722 | 0.0 | 0.721 | −0.1 | 0.722 | ||
| 7350 | 0.861 | −0.3 | 0.862 | −0.2 | 0.862 | −0.2 | 0.865 | 0.1 | 0.864 | 0.0 | 0.864 | ||
| 2780 | 0.934 | −0.3 | 0.935 | −0.2 | 0.936 | −0.1 | 0.938 | 0.1 | 0.937 | 0.0 | 0.937 | ||
| 580 | 0.984 | −0.2 | 0.985 | −0.1 | 0.985 | −0.1 | 0.987 | 0.1 | 0.986 | 0.0 | 0.986 | ||
| 70/30 (v/v) THF/ACN | 282000 | 0.072 | −2.7 | 0.073 | −1.4 | 0.073 | −1.4 | 0.073 | −1.4 | 0.073 | −1.4 | 0.074 | |
| 126000 | 0.206 | −1.0 | 0.206 | −1.0 | 0.206 | −1.0 | 0.207 | −0.5 | 0.207 | −0.5 | 0.208 | ||
| 51200 | 0.449 | −0.9 | 0.450 | −0.7 | 0.449 | −0.9 | 0.451 | −0.4 | 0.452 | −0.2 | 0.453 | ||
| 19500 | 0.675 | −0.7 | 0.676 | −0.6 | 0.676 | −0.6 | 0.679 | −0.1 | 0.678 | −0.3 | 0.680 | ||
| 7350 | 0.832 | −0.5 | 0.833 | −0.4 | 0.833 | −0.4 | 0.835 | −0.1 | 0.836 | 0.0 | 0.836 | ||
| 2780 | 0.917 | −0.3 | 0.918 | −0.2 | 0.918 | −0.2 | 0.920 | 0.0 | 0.920 | 0.0 | 0.920 | ||
| 580 | 0.979 | −0.3 | 0.980 | −0.2 | 0.980 | −0.2 | 0.983 | 0.1 | 0.982 | 0.0 | 0.982 | ||
| 70/30 (v/v) THF/EtOH | 282000 | 0.070 | −2.8 | 0.071 | −1.4 | 0.070 | −2.8 | 0.071 | −1.4 | 0.071 | −1.4 | 0.072 | |
| 126000 | 0.201 | −0.5 | 0.201 | −0.5 | 0.201 | −0.5 | 0.201 | −0.5 | 0.201 | −0.5 | 0.202 | ||
| 51200 | 0.440 | −0.2 | 0.440 | −0.2 | 0.440 | −0.2 | 0.440 | −0.2 | 0.441 | 0.0 | 0.441 | ||
| 19500 | 0.666 | −0.1 | 0.666 | −0.1 | 0.667 | 0.0 | 0.667 | 0.0 | 0.668 | 0.1 | 0.667 | ||
| 7350 | 0.825 | −0.1 | 0.825 | −0.1 | 0.826 | 0.0 | 0.827 | 0.1 | 0.827 | 0.1 | 0.826 | ||
| 2780 | 0.913 | 0.0 | 0.913 | 0.0 | 0.913 | 0.0 | 0.914 | 0.1 | 0.915 | 0.2 | 0.913 | ||
| 580 | 0.978 | −0.1 | 0.978 | −0.1 | 0.979 | 0.0 | 0.980 | 0.1 | 0.981 | 0.2 | 0.979 | ||
| 70/30 (v/v) THF/DMF | 282000 | 0.052 | −5.5 | 0.052 | −5.5 | 0.053 | −3.6 | 0.052 | −5.5 | 0.054 | −1.8 | 0.055 | |
| 126000 | 0.156 | −1.3 | 0.156 | −1.3 | 0.158 | 0.0 | 0.155 | −1.9 | 0.157 | −0.6 | 0.158 | ||
| 51200 | 0.370 | −0.8 | 0.370 | −0.8 | 0.374 | −0.3 | 0.369 | −1.1 | 0.372 | −0.3 | 0.373 | ||
| 19500 | 0.600 | −0.3 | 0.600 | −0.3 | 0.603 | 0.2 | 0.599 | −0.5 | 0.602 | 0.0 | 0.602 | ||
| 7350 | 0.775 | −0.3 | 0.775 | −0.3 | 0.777 | 0.0 | 0.774 | −0.4 | 0.776 | −0.1 | 0.777 | ||
| 2780 | 0.877 | −0.1 | 0.877 | −0.1 | 0.878 | 0.0 | 0.876 | −0.2 | 0.878 | 0.0 | 0.878 | ||
| 580 | 0.962 | 0.0 | 0.962 | 0.0 | 0.962 | 0.0 | 0.961 | −0.1 | 0.962 | 0.0 | 0.962 | ||
| 70/30 (v/v) THF/IPA | 282000 | 0.074 | −1.3 | 0.074 | −1.3 | 0.074 | −1.3 | 0.074 | −1.3 | 0.075 | 0.0 | 0.075 | |
| 126000 | 0.209 | −0.5 | 0.209 | −0.5 | 0.209 | −0.5 | 0.209 | −0.5 | 0.210 | 0.0 | 0.210 | ||
| 51200 | 0.452 | −0.2 | 0.452 | −0.2 | 0.452 | −0.2 | 0.453 | 0.0 | 0.453 | 0.0 | 0.453 | ||
| 19500 | 0.677 | −0.4 | 0.679 | −0.1 | 0.678 | −0.3 | 0.679 | −0.1 | 0.680 | 0.0 | 0.680 | ||
| 7350 | 0.834 | −0.4 | 0.835 | −0.2 | 0.835 | −0.2 | 0.836 | −0.1 | 0.836 | −0.1 | 0.837 | ||
| 2780 | 0.919 | −0.2 | 0.920 | −0.1 | 0.920 | −0.1 | 0.921 | 0.0 | 0.921 | 0.0 | 0.921 | ||
| 580 | 0.981 | −0.2 | 0.982 | −0.1 | 0.983 | 0.0 | 0.984 | 0.1 | 0.984 | 0.1 | 0.983 | ||
| 70/30 (v/v) THF/chloroform | 282000 | 0.053 | −5.4 | 0.053 | −5.4 | 0.054 | −3.6 | 0.055 | −1.8 | 0.056 | 0.0 | 0.056 | |
| 126000 | 0.161 | −1.2 | 0.161 | −1.2 | 0.161 | −1.2 | 0.162 | −0.6 | 0.163 | 0.0 | 0.163 | ||
| 51200 | 0.378 | −0.8 | 0.379 | −0.5 | 0.378 | −0.8 | 0.380 | −0.3 | 0.381 | 0.0 | 0.381 | ||
| 19500 | 0.606 | −0.7 | 0.607 | −0.5 | 0.607 | −0.5 | 0.608 | −0.3 | 0.609 | −0.2 | 0.610 | ||
| 7350 | 0.778 | −0.5 | 0.780 | −0.3 | 0.779 | −0.4 | 0.781 | −0.1 | 0.781 | −0.1 | 0.782 | ||
| 2780 | 0.878 | −0.6 | 0.881 | −0.2 | 0.880 | −0.3 | 0.882 | −0.1 | 0.882 | −0.1 | 0.883 | ||
| 580 | 0.963 | −0.3 | 0.965 | −0.1 | 0.964 | −0.2 | 0.966 | 0.0 | 0.966 | 0.0 | 0.966 | ||
| 100% THF | 282000 | 0.053 | −3.6 | 0.053 | −3.6 | 0.053 | −3.6 | 0.054 | −1.8 | 0.055 | 0.0 | 0.055 | |
| 126000 | 0.152 | −2.6 | 0.152 | −2.6 | 0.153 | −1.9 | 0.154 | −1.3 | 0.155 | −0.6 | 0.156 | ||
| 51200 | 0.359 | −1.6 | 0.360 | −1.4 | 0.361 | −1.1 | 0.362 | −0.8 | 0.364 | −0.3 | 0.365 | ||
| 19500 | 0.583 | −1.0 | 0.584 | −0.8 | 0.585 | −0.7 | 0.586 | −0.5 | 0.588 | −0.2 | 0.589 | ||
| 7350 | 0.761 | −0.5 | 0.761 | −0.5 | 0.761 | −0.5 | 0.762 | −0.4 | 0.764 | −0.1 | 0.765 | ||
| 2780 | 0.865 | −0.3 | 0.865 | −0.3 | 0.866 | −0.2 | 0.866 | −0.2 | 0.867 | −0.1 | 0.868 | ||
| 580 | 0.955 | 0.0 | 0.954 | −0.1 | 0.954 | −0.1 | 0.954 | −0.1 | 0.955 | 0.0 | 0.955 | ||
Table 9.
Calculated Ksec and% OKsec (from the reference Ksec at 60 °C) from elution volumes obtained for PMMA standards (Mp 46,890; 20,310; 7360; 3070) on phenyl column with a variety of 70/30 THF/solvent j mobile phases. Instrumentation and other conditions are as in Table 5.
| Column ID | Mobile Phase | PMMA Mp | Temperature |
||||||||||
|---|---|---|---|---|---|---|---|---|---|---|---|---|---|
| 10 °C |
20 °C |
30 °C |
40 °C |
50 °C |
60 °C | ||||||||
| Ksec | % ∆Ksec | Ksec | % ∆Ksec | Ksec | % ∆Ksec | Ksec | % ∆Ksec | Ksec | % ∆Ksec | Ksec Reference | |||
| Phenyl | 70/30 (v/v) THF/MeOH | 46890 | 0.466 | 7.1 | 0.457 | 5.1 | 0.451 | 3.7 | 0.442 | 1.6 | 0.440 | 1.1 | 0.435 |
| 20310 | 0.676 | 3.4 | 0.670 | 2.4 | 0.665 | 1.7 | 0.659 | 0.8 | 0.657 | 0.5 | 0.654 | ||
| 7360 | 0.824 | 1.1 | 0.821 | 0.7 | 0.819 | 0.5 | 0.816 | 0.1 | 0.816 | 0.1 | 0.815 | ||
| 3070 | 0.898 | 0.3 | 0.897 | 0.2 | 0.896 | 0.1 | 0.894 | −0.1 | 0.407 | 0.1 | 0.895 | ||
| 70/30 (v/v) THF/ACN | 46890 | 0.417 | 3.0 | 0.414 | 2.2 | 0.413 | 2.0 | 0.409 | 1.0 | 0.407 | 0.5 | 0.405 | |
| 20310 | 0.634 | 1.3 | 0.631 | 0.8 | 0.632 | 1.0 | 0.629 | 0.5 | 0.627 | 0.2 | 0.626 | ||
| 7360 | 0.795 | 0.0 | 0.794 | −0.1 | 0.797 | 0.3 | 0.795 | 0.0 | 0.795 | 0.0 | 0.795 | ||
| 3070 | 0.879 | −0.5 | 0.879 | −0.5 | 0.883 | 0.0 | 0.882 | −0.1 | 0.882 | −0.1 | 0.883 | ||
| 70/30 (v/v) THF/EtOH | 46890 | 0.486 | 9.5 | 0.476 | 7.2 | 0.466 | 5.0 | 0.458 | 3.2 | 0.450 | 1.4 | 0.444 | |
| 20310 | 0.687 | 4.6 | 0.680 | 3.5 | 0.673 | 2.4 | 0.668 | 1.7 | 0.662 | 0.8 | 0.657 | ||
| 7360 | 0.830 | 1.7 | 0.827 | 1.3 | 0.823 | 0.9 | 0.822 | 0.7 | 0.819 | 0.4 | 0.816 | ||
| 3070 | 0.902 | 0.6 | 0.901 | 0.4 | 0.900 | 0.3 | 0.900 | 0.3 | 0.899 | 0.2 | 0.897 | ||
| 70/30 (v/v) THF/IPA | 46890 | 0.479 | 8.9 | 0.470 | 6.8 | 0.460 | 4.5 | 0.453 | 3.0 | 0.446 | 1.4 | 0.440 | |
| 20310 | 0.684 | 4.1 | 0.677 | 3.0 | 0.671 | 2.1 | 0.665 | 1.2 | 0.660 | 0.5 | 0.657 | ||
| 7360 | 0.831 | 1.6 | 0.828 | 1.2 | 0.824 | 0.7 | 0.822 | 0.5 | 0.819 | 0.1 | 0.818 | ||
| 3070 | 0.903 | 0.3 | 0.902 | 0.2 | 0.901 | 0.1 | 0.901 | 0.1 | 0.900 | 0.0 | 0.900 | ||
| 100% THF | 46890 | 0.419 | 4.0 | 0.415 | 3.0 | 0.412 | 2.2 | 0.408 | 1.2 | 0.406 | 0.7 | 0.403 | |
| 20310 | 0.628 | 1.9 | 0.624 | 1.3 | 0.622 | 1.0 | 0.619 | 0.5 | 0.618 | 0.3 | 0.616 | ||
| 7360 | 0.790 | 0.8 | 0.787 | 0.4 | 0.787 | 0.4 | 0.785 | 0.1 | 0.785 | 0.1 | 0.784 | ||
| 3070 | 0.876 | 0.3 | 0.873 | 0.0 | 0.874 | 0.1 | 0.873 | 0.0 | 0.874 | 0.1 | 0.873 | ||
Table 10.
Calculated Ksec and% OKsec (from the reference Ksec at 60 °C) from elution volumes obtained for PS standards (Mp 282,000; 126,000; 51,200; 19,500; 7350; 2780; 580) on cyano column with a variety of 70/30 THF/solvent j mobile phases. Instrumentation and other conditions are as in Table 4.
| Column ID | Mobile Phase | PS Mp | Temperature |
||||||||||
|---|---|---|---|---|---|---|---|---|---|---|---|---|---|
| 10 °C |
20 °C |
30 °C |
40 °C |
50 °C |
60 °C | ||||||||
| Ksec | % ∆Ksec | Ksec | % ∆Ksec | Ksec | % ∆Ksec | Ksec | % ∆Ksec | Ksec | % ∆Ksec | Ksec Reference | |||
| Cyano | 70/30 (v/v) THF/MeOH | 282000 | 0.055 | −6.8 | 0.057 | −3.4 | 0.056 | −5.1 | 0.057 | −3.4 | 0.058 | −1.7 | 0.059 |
| 126000 | 0.161 | −1.8 | 0.164 | 0.0 | 0.161 | −1.8 | 0.163 | −0.6 | 0.163 | −0.6 | 0.164 | ||
| 51200 | 0.356 | −1.1 | 0.360 | 0.0 | 0.356 | −1.1 | 0.358 | −0.6 | 0.359 | −0.3 | 0.360 | ||
| 19500 | 0.571 | −0.7 | 0.577 | 0.3 | 0.570 | −0.9 | 0.572 | −0.5 | 0.573 | −0.3 | 0.575 | ||
| 7350 | 0.742 | −0.4 | 0.749 | 0.5 | 0.740 | −0.7 | 0.743 | −0.3 | 0.743 | −0.3 | 0.745 | ||
| 2780 | 0.847 | −0.4 | 0.854 | 0.5 | 0.845 | −0.6 | 0.847 | −0.4 | 0.848 | −0.2 | 0.850 | ||
| 580 | 0.940 | −0.2 | 0.948 | 0.6 | 0.938 | −0.4 | 0.940 | −0.2 | 0.941 | −0.1 | 0.942 | ||
| 70/30 (v/v) THF/ACN | 282000 | 0.055 | −1.8 | 0.055 | −1.8 | 0.055 | −1.8 | 0.056 | 0.0 | 0.055 | −1.8 | 0.056 | |
| 126000 | 0.155 | 0.0 | 0.156 | 0.6 | 0.156 | 0.6 | 0.156 | 0.6 | 0.155 | 0.0 | 0.155 | ||
| 51200 | 0.350 | 0.6 | 0.350 | 0.6 | 0.350 | 0.6 | 0.350 | 0.6 | 0.349 | 0.3 | 0.348 | ||
| 19500 | 0.568 | 0.2 | 0.569 | 0.4 | 0.568 | 0.2 | 0.568 | 0.2 | 0.568 | 0.2 | 0.567 | ||
| 7350 | 0.744 | 0.0 | 0.745 | 0.1 | 0.743 | −0.1 | 0.744 | 0.0 | 0.744 | 0.0 | 0.744 | ||
| 2780 | 0.852 | 0.0 | 0.853 | 0.1 | 0.851 | −0.1 | 0.852 | 0.0 | 0.853 | 0.1 | 0.852 | ||
| 580 | 0.949 | 0.0 | 0.950 | 0.1 | 0.948 | −0.1 | 0.949 | 0.0 | 0.950 | 0.1 | 0.949 | ||
| 70/30 (v/v) THF/EtOH | 282000 | 0.053 | −7.0 | 0.055 | −3.5 | 0.055 | −3.5 | 0.056 | −1.8 | 0.056 | −1.8 | 0.057 | |
| 126000 | 0.158 | −1.9 | 0.159 | −1.2 | 0.159 | −1.2 | 0.160 | −0.6 | 0.160 | −0.6 | 0.161 | ||
| 51200 | 0.354 | −1.1 | 0.355 | −0.8 | 0.355 | −0.8 | 0.357 | −0.3 | 0.356 | −0.6 | 0.358 | ||
| 19500 | 0.572 | −0.7 | 0.574 | −0.3 | 0.574 | −0.3 | 0.575 | −0.2 | 0.574 | −0.3 | 0.576 | ||
| 7350 | 0.746 | −0.7 | 0.748 | −0.4 | 0.748 | −0.4 | 0.750 | 0.1 | 0.749 | −0.3 | 0.751 | ||
| 2780 | 0.853 | −0.5 | 0.855 | −0.2 | 0.855 | −0.2 | 0.857 | 0.0 | 0.856 | −0.1 | 0.857 | ||
| 580 | 0.947 | −0.5 | 0.949 | −0.3 | 0.949 | −0.3 | 0.952 | 0.0 | 0.950 | −0.2 | 0.952 | ||
| 70/30 (v/v) THF/DMF | 282000 | 0.021 | −48.8 | 0.018 | −56.1 | 0.022 | −46.3 | 0.037 | −9.8 | 0.032 | −22.0 | 0.041 | |
| 126000 | 0.135 | −5.6 | 0.139 | −2.8 | 0.141 | −1.4 | 0.142 | −0.7 | 0.141 | −1.4 | 0.143 | ||
| 51200 | 0.325 | −2.7 | 0.329 | −1.5 | 0.331 | −0.9 | 0.332 | −0.6 | 0.331 | −0.9 | 0.334 | ||
| 19500 | 0.553 | −1.4 | 0.556 | −0.9 | 0.559 | −0.4 | 0.559 | −0.4 | 0.558 | −0.5 | 0.561 | ||
| 7350 | 0.741 | −1.1 | 0.743 | −0.8 | 0.746 | 0.4 | 0.746 | 0.4 | 0.746 | 0.4 | 0.749 | ||
| 2780 | 0.857 | −0.9 | 0.859 | −0.7 | 0.862 | −0.3 | 0.863 | −0.2 | 0.862 | −0.3 | 0.865 | ||
| 580 | 0.960 | −0.9 | 0.962 | −0.7 | 0.966 | −0.3 | 0.967 | −0.2 | 0.966 | −0.3 | 0.969 | ||
| 70/30 (v/v) THF/IPA | 282000 | 0.053 | −5.4 | 0.053 | −5.4 | 0.055 | −1.8 | 0.055 | −1.8 | 0.056 | 0.0 | 0.056 | |
| 126000 | 0.160 | 0.0 | 0.159 | −0.6 | 0.160 | 0.0 | 0.159 | −0.6 | 0.160 | 0.0 | 0.160 | ||
| 51200 | 0.358 | 0.3 | 0.357 | 0.0 | 0.358 | 0.3 | 0.357 | 0.0 | 0.357 | 0.0 | 0.357 | ||
| 19500 | 0.578 | 0.2 | 0.578 | 0.2 | 0.577 | 0.0 | 0.577 | 0.0 | 0.577 | 0.0 | 0.577 | ||
| 7350 | 0.753 | 0.1 | 0.753 | 0.1 | 0.752 | 0.0 | 0.752 | 0.0 | 0.752 | 0.0 | 0.752 | ||
| 2780 | 0.860 | 0.2 | 0.860 | 0.2 | 0.858 | 0.0 | 0.859 | 0.1 | 0.859 | 0.1 | 0.858 | ||
| 580 | 0.951 | −0.1 | 0.952 | 0.0 | 0.950 | −0.2 | 0.952 | 0.0 | 0.952 | 0.0 | 0.952 | ||
| 70/30 (v/v) THF/chloroform | 282000 | 0.026 | −33.3 | 0.020 | −48.7 | 0.036 | −7.7 | 0.038 | −2.6 | 0.039 | 0.0 | 0.039 | |
| 126000 | 0.142 | −1.4 | 0.144 | 0.0 | 0.144 | 0.0 | 0.144 | 0.0 | 0.145 | 0.7 | 0.144 | ||
| 51200 | 0.334 | −0.6 | 0.336 | 0.0 | 0.335 | −0.3 | 0.335 | −0.3 | 0.336 | 0.0 | 0.336 | ||
| 19500 | 0.558 | −0.4 | 0.560 | 0.0 | 0.559 | −0.2 | 0.559 | −0.2 | 0.560 | 0.0 | 0.560 | ||
| 7350 | 0.740 | −0.3 | 0.742 | 0.0 | 0.741 | −0.1 | 0.741 | −0.1 | 0.742 | 0.0 | 0.742 | ||
| 2780 | 0.852 | −0.1 | 0.853 | 0.0 | 0.853 | 0.0 | 0.852 | −0.1 | 0.853 | 0.0 | 0.853 | ||
| 580 | 0.947 | −0.1 | 0.949 | 0.1 | 0.949 | 0.1 | 0.948 | 0.0 | 0.948 | 0.0 | 0.948 | ||
| 100% THF | 282000 | 0.042 | −8.7 | 0.044 | −4.3 | 0.046 | 0.0 | 0.044 | −4.3 | 0.045 | −2.2 | 0.046 | |
| 126000 | 0.135 | −2.9 | 0.136 | −2.2 | 0.138 | 0.7 | 0.137 | −1.4 | 0.138 | −0.7 | 0.139 | ||
| 51200 | 0.319 | −1.5 | 0.321 | −0.9 | 0.323 | −0.3 | 0.322 | −0.6 | 0.323 | −0.3 | 0.324 | ||
| 19500 | 0.543 | −0.7 | 0.544 | −0.5 | 0.546 | −0.2 | 0.544 | −0.5 | 0.546 | −0.2 | 0.547 | ||
| 7350 | 0.728 | −0.4 | 0.730 | −0.1 | 0.731 | 0.0 | 0.729 | −0.3 | 0.731 | 0.0 | 0.731 | ||
| 2780 | 0.843 | −0.2 | 0.845 | 0.0 | 0.846 | 0.1 | 0.843 | −0.2 | 0.845 | 0.0 | 0.845 | ||
| 580 | 0.945 | 0.0 | 0.947 | 0.2 | 0.948 | 0.3 | 0.945 | 0.0 | 0.946 | 0.1 | 0.945 | ||
Acknowledgmenet
The authors would like to gratefully acknowledge GlaxoSmithK-line for providing the facilities where this research was conducted and permitting access to the instruments and all necessary supplies.
Footnotes
Publisher's Disclaimer: Disclaimer
Commercial products are identified to specify adequately the experimental procedure. Such identification does not imply endorsement or recommendation by the National Institute of Standards and Technology, nor does it imply that the materials identified are necessarily the best available for the purpose.
Appendix A. Supplementary data
Supplementary data associated with this article can be found, in the online version, at https://doi.org/10.1016/j.chroma.2017.11.027.
References
- [1].Shen Y, Chen B, Beek T.A.v., Alternative solvents can make preparative liquid chromatography greener, Green Chem 17 (2015) 4073–4081. [Google Scholar]
- [2].Prat D, Wells A, Hayler J, Sneddon H, McElroy CR, Albou-Shehada S, Dunn PJ, CHEM21 selection guide of classical- and less classical-solvents, Green Chem 18 (2016) 288–296. [Google Scholar]
- [3].Mori S, Barth HG, Size Exclusion Chromatography, Springer-Verlag, Berlin, 1999. [Google Scholar]
- [4].Malawer EG, Senak L, Introduction to size exclusion chromatography, in: Wu C.-s. (Ed.), Handbook of Size Exclusion Chromatography and Related Techniques, Marcel Dekker, Inc, New York, 2004. [Google Scholar]
- [5].Caltabiano AM, Foley JP, Barth HG, Size exclusion chromatography of synthetic polymers and biopolymers on common reversed phase and hydrophilic interaction chromatography columns, J. Chromatogr. A 1437 (2016) 74–87. [DOI] [PubMed] [Google Scholar]
- [6].Sander LC, Glinka CJ, Wise SA, Determination of bonded phase thickness in liquid chromatography by small angle neutron scattering, Anal. Chem 62 (1990) 1099–1101. [Google Scholar]
- [7].Rybka J, Höltzel A, Melnikov SM, Seidel-Morgenstern A, Tallarek U, A new view on surface diffusion from molecular dynamics simulations of solute mobility at chromatographic interfaces, Fluid Phase Equilib (2016) 177–187.
- [8].Kazakevich YV, High-performance liquid chromatography retention mechanisms and their mathematical descriptions, J. Chromatogr. A 1126 (2006) 232–243. [DOI] [PubMed] [Google Scholar]
- [9].Gritti F, Determination of the solvent density profiles across mesopores of silica-C18 bonded phases in contact with acetonitrile/water mixtures: a semi-empirical approach, J. Chromatogr. A 1410 (2015) 90–98. [DOI] [PubMed] [Google Scholar]
- [10].Poole CF, Lenca N, Applications of the solvation parameter model in reversed-phase liquid chromatography, J. Chromatogr. A 1486 (2017) 2–19. [DOI] [PubMed] [Google Scholar]
- [11].Poole CF, The Essence of Chromatography, Elsevier, New York, 2003. [Google Scholar]
- [12].Ramis-Ramos G, Garcia-Alvarez-Coque MC, 10 Chapter, Solvent selection in liquid chromatography, in: Fanali S, Haddad PR, Poole CF, Schoenmakers P, Lloyd D (Eds.), Liquid Chromatography: Fundamentals and Instrumentation, Elsevier, New York, 2013. [Google Scholar]
- [13].Barton AFM, Hanbook of Polymer-Liquid Interaction Parameters and Solubility Parameters, CRC Press, New York, 1990. [Google Scholar]
- [14].Snyder LR, Kirkland JJ, Dolan JW, Introduction to Modern Liquid Chromatography, 3rd ed., John Wiley & Sons, Inc, United States of America, 2010. [Google Scholar]
- [15].Striegel AM, Do column frits contribute to the on-column, flow-induced degradation of macromolecules? J. Chromatogr. A 1359 (2014). [DOI] [PubMed] [Google Scholar]
- [16].Rustamov I, Farcas T, Ahmed F, Chan F, LoBrutto R, McNair HM, Kazakevich YV, Geometry of chemically modified silica, J. Chromatogr. A 913 (2001) 49–63. [DOI] [PubMed] [Google Scholar]
- [17].Gritti F, Kazakevich YV, Guiochon G, Effect of the surface coverage of endcapped C18-silica on the excess adsorption isotherms of commonly used organic solvents from water in reversed phase liquid chromatography, J. Chromatogr. A 1169 (2007) 111–124. [DOI] [PubMed] [Google Scholar]
- [18].Northrop DM, Martire DE, Scott RPW, Liquid chromatographic retention behavior of polystyrene homopolymers on a C4, bimodal pore diameter reversed-phase column, Anal. Chem 64 (1992) 16–21. [Google Scholar]
- [19].Yonker CR, Zwier TA, Burke MF, Investigation of stationary phase formation for RP-18 using various organic modifiers, J. Chromatogr 241 (1982) 269–280. [Google Scholar]
- [20].Bocian S, Vajda P, Felinger A, Buszewski B, Solvent excess adsorption on the stationary phases for reversed-phase liquid chromatography with polar functional groups, J. Chromatogr. A 1204 (2008) 35–41. [DOI] [PubMed] [Google Scholar]
- [21].Berek D, 11 Chapter, Molecular characterization of synthetic polymers by means of liquid chromatography, in: Chan CH, Chia CH, Thomas S (Eds.), Physical Chemistry of Macromolecules: Macro to Nanoscales, Apple Academic Press, Toronto, 2014. [Google Scholar]
- [22].Bleha T, Berek D , Gel chromatography with mixed eluents. Partition of solute due to preferential solvation of gel, Chromatographia 14 (1981) 163–168. [Google Scholar]
- [23].Tijssen R, 2 Chapter, The mechanisms and importance of zone-spreading, in: Katz E, Eksteen R, Schoenmakers P, Miller N (Eds.), Handbook of HPLC, Marcel Dekker, New York, 1998. [Google Scholar]
- [24].Brun Y, Alden P, Gradient separation of polymers at critical point of adsorption, J. Chromatogr. A 966 (2002) 25–40. [DOI] [PubMed] [Google Scholar]
- [25].Mori S, Suzuki T, Effect of column temperatures on molecular weight determination by high performance size exclusion chromatography, Anal. Chem 52 (1980) 1625–1629. [Google Scholar]
- [26].Mori S, Suzuki M, Hydrodynamic volume fluctuation of polystyrene by column temperature and its effect to retention volume in size exclusion chromatography, J. Liq. Chromatogr 7 (1984) 1841–1850. [Google Scholar]
- [27].Sander LC, Wise SA, Subambient temperature modification of selectivity in reversed-phase liquid chromatography, Anal. Chem 61 (1989) 1749–1754. [Google Scholar]
- [28].Fadeev AY, Staroverov SM, Calculation of the characterstics of the bonded layers of reversed stationary phases, J. Chromatogr 465 (1989) 233–240. [Google Scholar]
- [29].Poplewska I, Piatkowski W, Antos D, Effect of column temperature on competitive adsorption of the solute and the organic solvent in reversed-phase liquid chromatography, J. Chromatogr. A 1103 (2006) 284–295. [DOI] [PubMed] [Google Scholar]
- [30].Buszewski B, Bocian S, Zera R, Influence of temperature and pressure on the preferential adsorption of component of hydroorganic mobile phase in liquid chromatography, Adsorption 16 (2010) 437–445. [Google Scholar]
Associated Data
This section collects any data citations, data availability statements, or supplementary materials included in this article.
Supplementary Materials
Figure 1S Effect of solvent concentration in the mobile phase on stationary phase characteristics relevant to size exclusion: total permeation volume Vt (A, a), interstitial volume V0 (B, b), pore volume Vi (C, c), and phase ratio, Vi/V0 (D, d) - a, b, c and d are the same as A, B, C, D, but fewer solvents in the plot for clarity. Column type: C18. Instrumentation: Agilent 1100 with a variable wavelength detector set to 262 nm. Other conditions: injection volume = 1.0 µL; flow rate = 0.30 mL/min; column temperature = 30˚C (thermostatted).
Figure 4S Effect of solvent concentration in the mobile phase on stationary phase characteristics relevant to size exclusion: total permeation volume Vt (A, a), interstitial volume V0 (B, b), pore volume Vi (C, c), and phase ratio, Vi/V0 (D, d) - a, b, c and d are the same as A, B, C, D, but fewer solvents in the plot for clarity. Column type: cyano. Instrumentation and other conditions as in Fig. 1S.
Figure 5S Comparison of chromatogram for PS calibrants on C18 column using unstabilized THF and 70/30 (v/v) THF/solvent j as the mobile phase. Molar masses of PS standards (g/mol): 791,000; 282,000; 126,000; 51,200; 19,500; 7,350; 2,870; and 580. Instrumentation and other conditions as in Fig. 1S.
Figure 6S Comparison of chromatograms for PS calibrants on C4 column using unstabilized THF and 70/30 (v/v) THF/solvent j as the mobile phase. Molar masses of PS standards (g/mol): 791,000; 282,000; 126,000; 51,200; 19,500; 7,350; 2,870; and 580. Instrumentation and other conditions as in Fig. 1S.
Figure 7S Comparison of chromatograms for PS calibrants on phenyl column using unstabilized THF and 70/30 (v/v) THF/solvent j as the mobile phase. Molar masses of PS standards (g/mol): 791,000; 282,000; 126,000; 51,200; 19,500; 7,350; 2,870; and 580. Instrumentation and other conditions as in Fig. 1S.
Figure 8S Comparison of chromatograms for PS calibrants on cyano column using unstabilized THF and 70/30 (v/v) THF/solvent j as the mobile phase. Molar masses of PS standards (g/mol): 791,000; 282,000; 126,000; 51,200; 19,500; 7,350; 2,870; and 580. Instrumentation and other conditions as in Fig. 1S.
Figure 9S Calibration plots on C4 column with toluene and PS standards (Mp 580; 2,780; 7,350; 19,500; 51,200; 126,000; 282,000; 791,000 and 1,640,00) using 70/30 (v/v) THF/MeOH mobile phase. Instrumentation: Agilent 1100 with a variable wavelength detector set to 262 nm. Other conditions: injection volume = 1.0 µL; flow rate = 0.30 mL/min.; column temperature varied from 10˚C to 60˚C.
Figure 10S Calibration plots on C4 column with PMMA standards (Mp 46,890; 20,310; 7,360; 3,070) using 70/30 (v/v) THF/MeOH mobile phase. Instrumentation: Agilent 1100 with a variable wavelength detector set to 230 nm. Instrumentation: Agilent 1100 with a variable wavelength detector set to 230 nm. Other conditions as in Fig. 9S.
Figure 11S Calibration plots on Phenyl column with toluene and PS standards (Mp 580; 2,780; 7,350; 19,500; 51,200; 126,000; 282,000; 791,000 and 1,640,00) using 70/30 (v/v) THF/MeOH mobile phase. Instrumentation and other conditions as in Fig. 9S.
Figure 12S Calibration plots on Phenyl column with PMMA standards (Mp 46,890; 20,310; 7,360; 3,070) using 70/30 (v/v) THF/MeOH mobile phase. Instrumentation and other conditions as in Fig. 10S.
Figure 13S Calibration plots on Cyano column with toluene and PS standards (Mp 580; 2,780; 7,350; 19,500; 51,200; 126,000; 282,000; 791,000 and 1,640,00) using 70/30 (v/v) THF/MeOH mobile phase. Instrumentation and other conditions as in Fig. 9S.
Figure 14S Calibration plots on Cyano column with PMMA standards (Mp 46,890; 20,310; 7,360; 3,070) using 70/30 (v/v) THF/MeOH mobile phase. Instrumentation and other conditions as in Fig. 10S.
Figure 2S Effect of solvent concentration in the mobile phase on stationary phase characteristics relevant to size exclusion: total permeation volume Vt (A, a), interstitial volume V0 (B, b), pore volume Vi (C, c), and phase ratio, Vi/V0 (D, d) - a, b, c and d are the same as A, B, C, D, but fewer solvents in the plot for clarity. Column type: C4. Instrumentation and other conditions as in Fig. 1S.
Figure 3S Effect of solvent concentration in the mobile phase on stationary phase characteristics relevant to size exclusion: total permeation volume Vt (A, a), interstitial volume V0 (B, b), pore volume Vi (C, c), and phase ratio, Vi/V0 (D, d) - a, b, c and d are the same as A, B, C, D, but fewer solvents in the plot for clarity. Column type: phenyl. Instrumentation and other conditions as in Fig. 1S.