Abstract
Long-chain acyl-CoA synthetase 1 (ACSL1) plays a pivotal role in fatty acid β-oxidation in heart, adipose tissue and skeletal muscle. However, key functions of ACSL1 in the liver remain largely unknown. We investigated acute effects of hepatic ACSL1 deficiency on lipid metabolism in adult mice under hyperlipidemic and normolipidemic conditions. We knocked down hepatic ACSL1 expression using adenovirus expressing a ACSL1 shRNA (Ad-shAcsl1) in mice fed a high-fat diet or a normal chow diet. Hepatic ACSL1 depletion generated a hypercholesterolemic phenotype in mice fed both diets with marked elevations of total cholesterol, LDL-cholesterol and free cholesterol in circulation and accumulations of cholesterol in the liver. Furthermore, SREBP2 pathway in ACSL1 depleted livers was severely repressed with a 50% reduction of LDL receptor protein levels. In contrast to the dysregulated cholesterol metabolism, serum triglycerides, free fatty acid and phospholipid levels were unaffected. Mechanistic investigations of genome-wide gene expression profiling and pathway analysis revealed that ACSL1 depletion repressed expressions of several key enzymes for bile acid biosynthesis, consequently leading to reduced liver bile acid levels and altered bile acid compositions. These results are the first demonstration of a requisite role of ACSL1 in bile acid biosynthetic pathway in liver tissue. Furthermore, we discovered that Acsl1 is a novel molecular target of the bile acid-activated farnesoid X receptor (FXR). Activation of FXR by agonist obeticholic acid repressed the expression of ACSL1 protein and mRNA in the liver of FXR wild-type mice but not in FXR knockout mice.
Keywords: ACSL1, Bile acid synthesis, Hypercholesterolemia, Gene expression profiling, Farnesoid X receptor, Obeticholic acid
1. Introduction
The liver plays a key role in whole-body lipid metabolism by regulating the uptake, synthesis, oxidation and export of fatty acids (FA) and cholesterol. Dysfunction of lipid metabolism in liver underlies the development of obesity, diabetes, nonalcoholic fatty liver disease and cardiovascular disease. Although mechanisms that regulate the hepatic uptake, activation, and metabolism of FA are not completely understood, nearly all pathways of FA metabolism require conversion of FA to acyl-CoAs by acyl-CoA synthetases.
Long-chain acyl-CoA synthetase (ACSL) family of enzymes catalyze the formation of fatty acyl-CoAs from ATP, CoA, and long chain fatty acids (LCFA). Once LCFA is esterified by ACSL, it can enter various metabolic pathways including the cellular FA β-oxidation (catabolism) and anabolic pathways for the synthesis of phospholipid (PL), cholesterol ester (CE), and triglyceride (TG) [1]. Within five ACSL family members (ACSL1, 3, 4, 5 and 6), ACSL1 is the abundant isoform in major metabolic tissues including liver, heart, adipose tissue and muscle [2]. It has broad substrate specificity for saturated FA of 16 and 18 chain lengths and unsaturated FA of 16–20 carbon atoms [3]. Genetic mouse models of ACSL1 knockout (KO) in heart [4] and adipose tissue [5] revealed substantially reduced FA oxidation caused by ACSL1 deficiency. Furthermore, systemic glucose homeostasis became severely compromised in mice lacking ACSL1 in skeletal muscle [6]. In liver tissue, ACSL1 is the highest expressed isoform and contributes to 50% of the total ACSL activity [7]. Transcription of Acsl1 gene is further induced by nuclear receptors peroxisome proliferator activated receptor α (PPARα) [8,9] and sterol-response element binding protein 2 (SREBP2) [10] that are master regulators of lipid metabolism in liver tissue [11,12].
Besides its regulation, in vitro studies carried out in hepatic cell lines have reported functions of ACSL1 in mediating FA oxidation, FA uptake, TG synthesis and PL productions [2,13]. Altogether, these transcriptional and functional studies suggested that ACSL1 is a key acyl-CoA synthetase in hepatic LCFA utilization. However, this notion was bought into question by the finding that genetic mouse model of liver-specific ACSL1 KO (Acsl1L−/−) did not exhibit obvious metabolic phenotype. Hepatic levels of TG, PL, CE and free cholesterol (FC) did not differ between the wild-type (WT) and the Acsl1L−/− mice fed either a normal chow diet (NCD) or challenged by a high-fat diet (HFD) [7].
In the present study, we took the approach of adenovirus-mediated gene knockdown (KD) to examine the acute effects of hepatic ACSL1 deficiency on major FA metabolic pathways in adult mice under a hyperlipidemic state and in normolipidemic conditions. With prominently altered metabolic features of ACSL1 KD mice combined with whole genome transcriptomic analysis, our studies for the first time revealed crucial requirements of hepatic ACSL1 in bile acid (BA) synthesis and cholesterol metabolism in liver tissue. Moreover, we discovered that the hepatic expression of ACSL1 is repressed by obeticholic acid (OCA), an agonist for BA-activated nuclear receptor farnesoid X receptor (FXR) [14–16] in a FXR dependent manner, which further underscores the important roles of hepatic ACSL1 in BA metabolism.
2. Materials and methods
2.1. Mice and diets
All animal studies were approved by the Institutional Animal Care and Use Committees at Veterans Affairs Palo Alto Health Care System (VAPAHCS) (Palo Alto, CA) and Northeast Ohio Medical University (Rootstown, OH) and were consistent with the National Institutes of Health guide for the care and use of Laboratory animals. C57BL/6 mice and FXR KO mice (Fxr−/−) were purchased from The Jackson Laboratory (Bar Harbor, ME) and fed Teklad Mouse/Rat Diet 7001 chow diet and water at libitum. For diet challenge studies, C57BL/6 mice were fed a HFD (no. TD.88137 from Harlan; ~42% of total calories from fat; 0.15% cholesterol) for 8 weeks before adenoviral injections.
2.2. Adenoviral transduction in mouse liver cell line
Mouse hepatic Hepa1–6 cells were transduced with the adenovirus expressing mouse Acsl1 shRNA (Ad-shAcsl1) or the control virus (Ad-shLacZ) at various multiplicity of infection (MOI) in 1 mL medium containing 0.5% FBS. After 5 h of infection, medium was replaced with fresh medium containing 10% FBS and cells were harvested 72 h post infection to isolate total RNA or cell lysates.
2.3. Adenoviral infection in mice
In one study, mice were fed a HFD for eight weeks. At the end of week 8, 12 mice were divided into two groups with similar TC levels in both groups. At day 0, mice were fully anesthetized and injected with Ad-shAcsl1 (6 × 10⁹pfu/per mouse) or equal viral dose of a control adenovirus (Ad-shU6-C) via retro-orbital sinus as previously described [17]. In another study, 12 mice fed a NCD were injected with Ad-shAcsl1 or Ad-shU6-C. Body weight and food intake were monitored throughout the duration of the experiment. After 11-days of infection, mice were fasted for 4 h (10 AM to 2 PM) before sacrificing for serum and liver tissue collections. Purified adenovirus (Ad-shAcsll, Ad-shU6-C) were obtained from Vector Biolabs (Malvern, PA).
2.4. OCA treatment
Three separate studies of OCA in male mice were performed in this report. In the first study, 10- to 12-week-old C57BL/6 mice fed a NCD were orally dosed with either vehicle (0.5% carboxymethyl cellulose, Sigma) or vehicle containing OCA (40 mg/kg/day) for 10 days. In the second study, C57BL/6 mice (8 weeks old) were fed a high fat and high cholesterol diet (HFHCD) containing 40% calories from fat and 0.5% cholesterol (#D12107C, Research Diets, Inc., New Brunswick, NJ) for four weeks, followed by vehicle or OCA treatment at 40 mg/kg/day for 14 days. In the third study, C57BL/6 mice, FXR KO mice and their littermate control mice were gavaged with either vehicle or OCA (40 mg/ kg/day) for 7 days [18]. After the last dosing, all animals were fasted for 4–5 h and then sacrificed for collection of serum and liver tissues. OCA was provided by Intercept Pharmaceuticals (New York, NY) [19].
2.5. Measurement of serum lipids
Serum was isolated at room temperature and stored at —80 °C. Standard enzymatic methods were used to determine TC, FC, free fatty acid (FFA), PL, LDL-C, HDL-C and TG levels of serum using commercially available kits purchased from Stanbio Laboratory (Texas, USA). Each sample was assayed in duplicate. Cholesterol ester (CE) and ester ratio were calculated by using following formula provided in kit manual.
2.6. HPLC separation of serum lipoprotein cholesterol and TGs
Fifty microliter of serum samples of day 11 of adenovirus injection from two animals of the same treatment group were pooled together and a total of three pooled serum samples from each group were analyzed for cholesterol and TG levels of each of the major lipoprotein classes including chylomicron (CM, > 80 nm), VLDL (30–80 nm), LDL (16–30 nm), and HDL (8–16 nm) with a dual detection HPLC system consisting of two tandem connected TSK gel Lipopropak XL columns (300 × 7.8-mm; Tosoh, Japan) at Skylight Biotech, Inc. (Tokyo, Japan) as described [19].
2.7. Measurement of hepatic lipids
Thirty microgram of frozen liver tissue were homogenized in 1 ml chloroform/methanol (2:1) for lipid extraction. Total cholesterol and triglycerides were measured using kits from Stanbio Laboratory.
2.8. Measurement of liver total BAs
Twenty microgram of frozen liver were homogenized and extracted in 1 mL of 75% ethanol at 50 °C for 2h [19]. The extract was centrifuged and the supernatant was used to measure total BAs using a kit from Diazyme, Poway, CA.
2.9. Measurement of serum total BAs and individual BAs
Quantitative measurement of BAs from pooled serum samples of HFD fed mice injected with either Ad-shAcsl1 or the control adenovirus (Ad-shU6-C) were conducted at the Creative Proteomics (Shirley, NY) and individual BAs are quantified using a Waters Acquity uPLC System with a QDa single quadrupole mass detector and an autosampler. In addition, total BAs of individual serum samples were measured using a kit from Diazyme, Poway, CA.
2.10. Real-time PCR
Total RNA isolation, generation of cDNA, and real-time quantitative PCR were conducted as previously reported [19]. Each cDNA sample was assayed in duplicate. The correct size of the PCR product and the specificity of each primer pair were validated by examination of PCR products on an agarose gel. Primer sequences used in real-time PCR are listed in Supplemental Table 1. Target mRNA expression in each sample was normalized to the housekeeping gene GAPDH. The 2—ΔΔCt method was used to calculate relative mRNA expression levels.
2.11. Western blot analysis
Approximately 50 mg of frozen liver was homogenized in RIPA buffer containing 1 mM PMSF and protease inhibitor cocktail (Roche). After protein quantitation using BCA protein assay reagent (Pierce), 50 μg of homogenate proteins from individual samples were used in SDS-PAGE and Western blot analysis to determine relative protein levels of ACSL1, ACSL3, ACSL4, ACSL5, LDLR, and mSREBP2 as described [10,20]. Immunoreactive bands of predicted molecular mass were visualized using a SuperSignal West Femto Maximum Sensitivity Substrate ECL kit from Thermo Scientific (Waltham, MA, USA) and quantified with the Alpha View Software with normalization by signals of β-actin.
2.12. Measurement of liver acyl-CoA synthetase activity
About 50 mg frozen liver tissue were dounce-homogenized 15 times in a buffer containing 250 mM sucrose, 10 mM Tris, pH 7.4, 1 mM EDTA, 1 mM dithiothreitol (DTT), protease inhibitor cocktail (Roche) and phosphatase inhibitor cocktail (Sigma). Homogenates were centrifuged at 16,000 ×g for 30 min at 4 °C, protein concentrations in supernatants were determined by BCA assay, and aliquots were stored at —80 °C. Initial rates of total ACSL activity in liver homogenate were measured using 4 μg of liver homogenate at 37 °C in the presence of 175 mM Tris (pH 7.4), 8 mM MgCl2, 5mM DTT, 10 mM ATP, 250 μM CoA, 50 μM [3H]palmitic acid (PA), [3H]oleic acid (OA), or [3H]arachidonic acid (AA) in 0.5 mM Triton X-100, and 10 μM EDTA in a total volume of 0.1 mL. The reaction was initiated by adding the homogenized sample and terminated by adding 1 mL Dole’s reagent as previously described [21]. Generated [3H]PA-CoA, [3H]OA-CoA, and [3H]AA-CoA were extracted, and the radioactivity was determined in a scintillation counter. The radioactivity in a reaction that contained all components but omitted homogenate was included as a negative control.
2.13. Microarray analysis
Microarray chip hybridization and data analysis were performed on individual livers of mice fed a HFD (n = 4 per treatment group) at Boston University Microarray and Sequencing Resource Core Facility. Mouse Gene 2.0 ST CEL files were normalized to produce gene-level expression values using the implementation of the Robust Multiarray Average (RMA) in the affy package (version 1.36.1) included in the Bioconductor software suite (version 2.11) and an Entrez Gene-specific probe set mapping (17.0.0) from the Molecular and Behavioral Neuroscience Institute (Brainarray) at the University of Michigan. Differential expression was assessed using the moderated (empirical Bayesian) t-test implemented in the limma package (version 3.14.4). Correction for multiple hypothesis testing was accomplished using the Benjamini-Hochberg false discovery rate (FDR). All microarray analyses were performed using the R environment for statistical computing (version 2.15.1). For comparative analysis, general linear models for microarray data were performed for probe sets present on the microarray to identify probe sets that were differentially expressed between Ad-shAcsl1 and Ad-shU6-C groups, based on moderated t-statistics. Probe sets with a 1.5-fold change and a P-value < 0.05 were considered biologically significant.
2.14. Gene Set Enrichment Analysis (GSEA)
GSEA (version 2.2.1) was used to identify biological terms, pathways and processes that are coordinately up- or down-regulated within each pairwise comparison. The Entrez Gene identifiers of the human homologs of the genes interrogated by the array were ranked according to the moderated t statistic computed between Ad-shAcsl1 and Ad-shU6-C. Mouse genes with multiple human homologs (or vice versa) were removed prior to ranking, so that the ranked list represents only those human genes that match exactly one mouse gene. This ranked list was then used to perform pre-ranked GSEA analyses using the Entrez Gene versions of the Hallmark, Biocarta, KEGG, Reactome, Gene Ontology (GO), and transcription factor and microRNA motif gene sets obtained from the Molecular Signatures Database (MSigDB), version 6.0.
2.15. Culture of primary hepatocytes
Mouse primary hepatocytes (MPH) or human primary hepatocytes (HPH) obtained from Invitrogen were seeded on collagen coated plates at a density of 1 × 10⁵ cells/well in 24-well plates in Williams E Medium supplemented with a Cell Maintenance Cocktail (Cell Maintenance Supplement Pack, Invitrogen). After overnight seeding, cells were treated with FXR agonists for 24 h before isolation of total RNA for qRT-PCR analysis. FXR agonists GW4064 and FXR-450 were purchased from Sigma and OCA was provided by Intercept Pharmaceuticals.
2.16. Statistical analysis
MS Excel and GraphPad Prism 5 were used to calculate averages and errors, generate graphs, and preform statistical tests. All values are presented as mean ± SEM. One Way ANOVA was used to compare groups of three or more with Dunnett’s Multiple Comparison Test, and unpaired Student two-tailed t-test was used to compare two groups. Statistical significance is displayed as p < 0.05 (one asterisk), p < 0.01 (two asterisks) or p < 0.001 (three asterisks).
3. Results
3.1. Hepatic depletion of ACSL1 in adult mice by adenovirus infection
To uncover specific functions of hepatic ACSL1 in adult mice we employed shRNA technology to deplete hepatic ACSL1 using adenovirus expressing a mouse Acsl1 shRNA (Ad-shAcsl1). Efficiency of the viral particle was first examined in cultured mouse Hepa1–6 cells that were transduced with Ad-shAcsl1 or a shRNA control virus Ad-shLacZ for 3 days. Expression of Acsl1 shRNA caused a robust reduction in ACSL1 protein levels without affecting ACSL3, ACSL4 and ACSL5 protein abundances (Fig. 1A). Real-time PCR analysis of all hepatic ACSL isoforms demonstrated that Ad-shAcsl1 specifically targets Acsl1 mRNA and reduces its steady state levels (Fig. 1B).
Fig. 1.
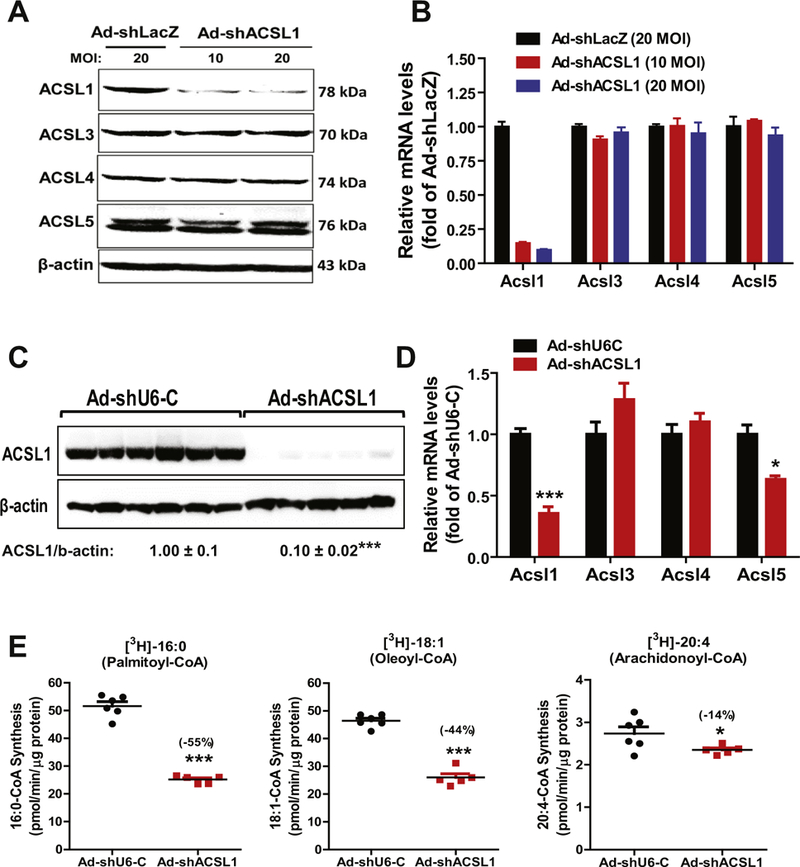
Knockdown of hepatic ACSL1 by Ad-shAcsl1 transduction. Hepa1–6 cells seeded in 12-well cell culture plate were transduced with Ad-shLacZ (20 MOI) or Ad-shAcsl1 (10, 20 MOI) adenovirus for three days. Total cell lysates and total RNA were separately isolated.
(A) Western blot analysis of ACSL isoforms using specific antibodies.
(B) Real-time PCR analysis of ACSL RNA levels.
Male C57BL/6J mice fed a HFD for 8weeks were injected with Ad-shAcsl1 or Ad-shU6-C. After 11-days of adenoviral injection, mice were sacrificed and serum samples and livers were isolated at the termination and used for the following measurements. All data are mean ± SEM of 5–6 liver samples.
(C) Western blot analysis of hepatic ACSL1 protein and β-actin levels in individual livers of Ad-shAcsl1 or Ad-shU6-C injected mice. The protein abundance of ACSL1 was quantified with normalization with signals of β-actin using Alpha View Software. Significance was determined by Student’s t-test. n = 6 mice per group. *** p < 0.001.
(D) Real-time PCR was conducted to determine the relative expression levels of ACSL isoform mRNAs after normalization with GAPDH mRNA levels. Significance was determined by Student’s t-test. n = 6 mice per group. ***p < 0.001. *p < 0.05.
(E) Total ACSL enzymatic activity in tissue homogenate was measured using 4 μg of homogenate proteins at 37 °C in the presence of [3H] labeled PA, [3H] labeled OA and [3H] labeled AA. Significance was determined by Student’s t-test. n = 6 mice per group. ***p < 0.001 and *p < 0.05.
Having confirmed its specificity and efficacy, we injected Ad-shAcsl1 or control virus (Ad-shU6-C) into mice that have been fed a HFD for 8 weeks. Analysis of liver tissues of mice sacrificed on day 11 after viral injection showed that transduction of Ad-shAcsl1 resulted in ~90% depletion of ACSL1 protein (Fig. 1C) and Acsl1 mRNA levels were reduced by 65% (p < 0.001). Levels of Acsl3 and Acsl4 mRNAs were unchanged while Acsl5 mRNA levels were modestly reduced by 37% (p < 0.05) (Fig. 1D). We measured total ACSL activity in liver homogenates of control and ACSL1 depleted groups in the presence of three different 3H-labeled FA substrates: 3H-palmitic acid (16:0), 3H-oleic acid (18:1) and 3H-arachidonic acid (20:4). Fig. 1E shows that the palmitoyl-CoA synthetase activity and oleoyl-CoA synthetase activity in Ad-shAcsl1 group were markedly reduced by 55% (p < 0.001) and 44% (p < 0.001), respectively as compared to the control group whereas arachidonoyl-CoA synthetase activity was only slightly lower in ACSL1 KD mice. These results are in good agreement with the reported ACSL1 substrate preference for palmitic acid and oleic acid [3,22]. Altogether, results in Fig. 1 demonstrate the high efficacy and specificity of Ad-shAcsl1 in depleting hepatic ACSL1 in cultured hepatic cells and in the liver.
3.2. Hepatic ACSL1 deficiency induced hypercholesterolemia and repressed SREBP pathway
The body weight, food intake, liver weight and liver index did not differ between the two groups of mice injected with Ad-shAcsl1 or Ad-shLacZ (Supplemental Fig. 1). Measurements of serum lipid levels showed that the transient depletion of liver ACSL1 exacerbated the HFD induced hypercholesterolemia leading to a ~54% increase in serum TC and nearly 2-fold increase in LDL-C compared to the control group (AdshU6-C). Furthermore, serum FC levels were highly elevated to 2.6-fold of control (p < 0.01), leading to a reduction in serum CE ratio (Fig. 2A–F). In a sharp contrast to dysregulated cholesterol homeostasis, serum levels of TG, FFA and PL were not changed (Fig. 2G–I).
Fig. 2.
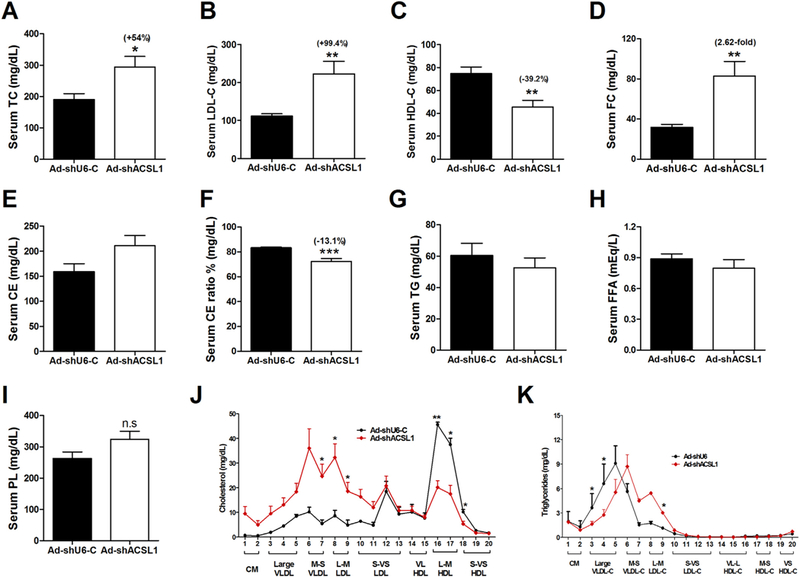
Hepatic ACSL1 deficiency induces hypercholesterolemia in mice fed a HFD. After 11-days of adenoviral injection, mice were fasted 4 h and then sacrificed for serum and liver sample collections. TC and FC were measured. CE and ester ratio were calculated as indicated in the Materials and methods section. In A–I, significance was determined by Student’s t-test. n = 6 mice per group. *p < 0.05, **p < 0.01, and ***p < 0.001.
(A) Serum TC.
(B) Serum LDL-C.
(C) Serum HDL-C.
(D) Serum FC.
(E) Calculated serum CE.
(F) Calculated serum CE ratio.
(G) Serum triglyceride.
(H) Serum free FA levels.
(I) Serum PL levels.
(J–K) Serum samples from two animals of the same treatment group were pooled together and a total of three pooled serum samples from each group were analyzed for cholesterol (J) and triglyceride (K) distribution in HPLC-separated lipoprotein factions. n = 3, *, p < 0.05.
To gain a better understanding of the cholesterol elevating effect of ACSL1 deficiency and its impact on plasma lipoprotein cholesterol profiles, we performed HPLC separation of pooled serum samples (Fig. 2J). Results demonstrated that the elevation of circulating cholesterol was driven by increases in both LDL-C and VLDL-C fractions. HPLC data further indicated the reduction of HDL-C which was consistent with individual HDL-C measurement (Fig. 1C). HPLC analysis of lipoprotein-TG fractions (Fig. 2K) revealed only a slight increase of LDL-TG in hepatic ACSL1 deficient mice, which was consistent with the data of individual TG measurement (Fig. 2G).
Measurement of liver lipid contents further showed significant accumulations of hepatic TC (+39.4%, p < 0.01) and FC (+55%, p < 0.01) in ACSL1 depleted livers compared to control (Fig. 3A, B). In addition, we observed relatively smaller increases in hepatic TG and FFA content in ACSL1 depleted livers (Fig. 3C, D). Like the unchanged PL levels in serum, depletion of hepatic ACSL1 did not alter PL abundance in the liver (Ad-shAcsl1: 15.6 ± 0.6 mg/g; Ad-shU6-C: 16.9 ± 0.7 mg/g; p=0.2).
Fig. 3.
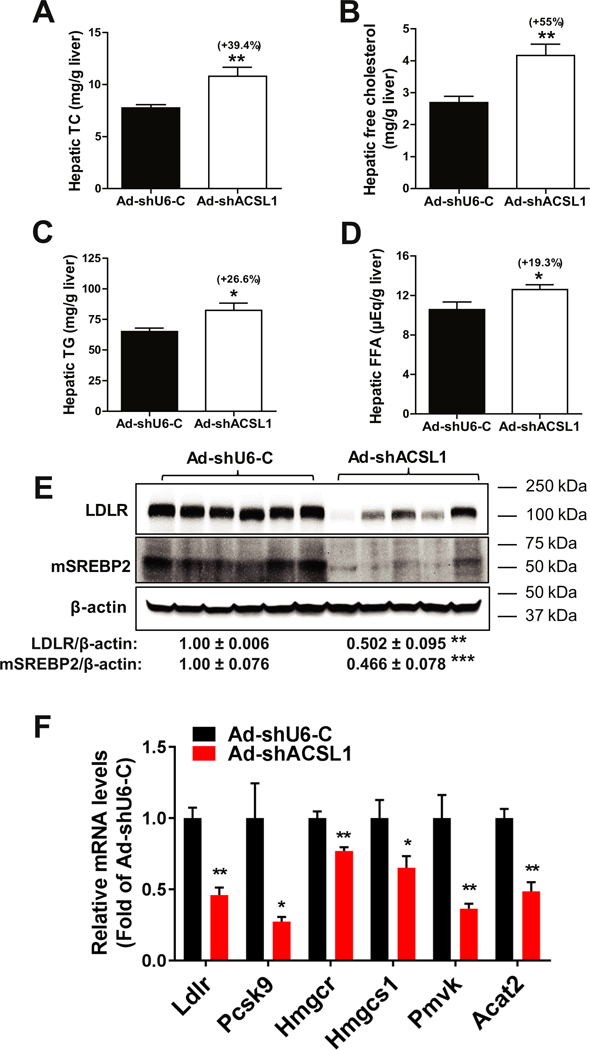
Accumulations of hepatic TC and FC and downregulation of SREBP2 pathway by hepatic ACSL1 deficiency.
(A–D) Lipids were extracted from livers of Ad-shAcsll and Ad-shU6-C injected mice and measured for TC (A), FC (B), TG (C) and FFA (D). Liver PL contents were also measured and described in the text.
(E) Individual liver homogenates were analyzed by Western blot analysis for LDLR and mSREBP2 protein levels. The membrane was reprobed for β-actin. mSREBP2, mature form of SREBP2.
(F) Real-time PCR was conducted to measure mRNA levels of indicated genes.
In A–F, all values are expressed as mean ± SEM. Significance was determined by Student’s t-test. n = 6 mice per group. *p < 0.05, **p < 0.01, and ***p < 0.001.
The accumulation of hepatic TC and FC with a marked increase in serum LDL-C level suggested that the SREBP2 pathway could be repressed in the ACSL1 deficient liver leading to reduced LDL receptor (LDLR) expression. Indeed, Western blot analysis of liver homogenates showed that LDLR protein levels in Ad-shAcsll transduced mice were 50% (p < 0.01) lower than that in control mice and the amount of mature form of SREBP2 (mSREBP2) in ACSLl-depleted liver was only 47% (p < 0.001) of the control (Fig. 3E). Consistent with these data, ACSL1 deficiency led to inhibition of SREBP2 target genes in cholesterol biosynthetic pathway including Ldlr, Pcsk9, Hmgcr, Hmgcs1, Pmvk and Acat2 (Fig. 3F).
3.3. Bile acid synthesis is impaired in ACSL1-depleted liver
Cellular cholesterol is the only source of primary BA biosynthesis in liver tissue. Elevated FC and TC levels in serum and in the liver of Ad-shAcsl1 transduced mice prompted us to examine a potential impact of ACSL1 deficiency on BA synthesis. It is well established that the synthesis of primary BAs from cholesterol occurs via the classic pathway for cholic acid (CA) synthesis or alternative pathway to produce chenodeoxycholic acid (CDCA). Within the classic pathway, cholesterol 7a-hydroxylase CPY7A1 is the rate-limiting enzyme and sterol 12α-hydroxylase CYP8B1 regulates CA synthesis. The alternative BA synthesis pathway involves key enzymes oxysterol 7α-hydroxylase CYP7B1 and sterol 27-hydroxylase CYP27A1. Hepatic gene expression analysis of a panel of genes encoding key enzymes in BA synthesis and metabolism from liver samples of Ad-shAcsl1 and Ad-shU6-C control mice demonstrated that while Cyp7a1 and Cyp27a1 gene expressions were not changed, mRNA levels of Cyp8b1 and Cyp7b1 were substantially lower in Ad-shAcsl1 mice compared to control mice (Fig. 4A), suggesting that both the classic and alternative BA synthetic pathways were impaired. In addition, mRNA levels of Acox2 and BA-Co enzyme A: amino acid N-acyltransferase (Baat) were also attenuated by ACSL1 deficiency, suggesting reduced activity in BA metabolism through side chain oxidation and conjugation.
Fig. 4.
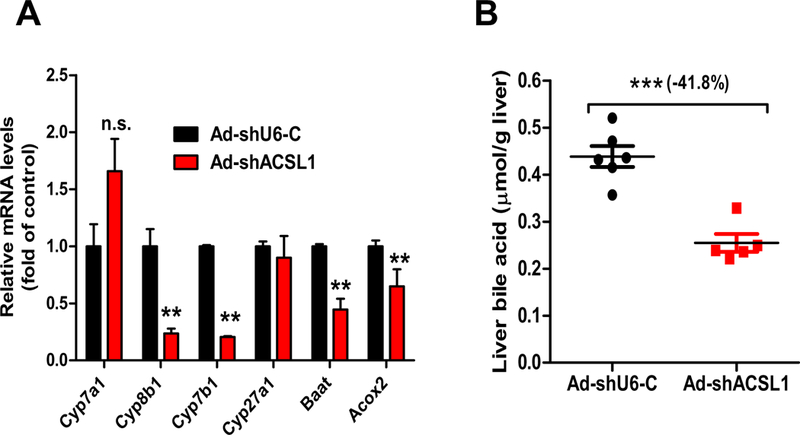
Downregulation of BA synthesis by hepatic ACSL1 deficiency.
(A) Real-time PCR analysis of hepatic genes involved in BA de novo synthesis and modifications. All values are expressed as mean ± SEM. n = 6 mice per group. Significance was determined by Student’s t-test. **p < 0.01.
(B) Liver total BAs were extracted from individual livers and measured. n = 6 mice per group. Significance was determined by Student’s t-test. ***p < 0.001.
Next, we measured total BA contents in liver samples of both groups. BA contents in Ad-shAcsl1 transduced mice were 42% lower compared to the control mice (p < 0.001) (Fig. 4B). In addition to reduced liver BA levels, serum total BA levels were also lower by 46% in the KD mice compared to control mice (Supplemental Fig. 2). Analysis of individual BA levels in pooled serum samples of Ad-shAcsl1 and Ad-shU6-C groups revealed a 27% reduction in total amounts and altered compositions of BAs by ACSL1 deficiency (Supplemental Table 2). The most notable changes were that ACSL1 KD reduced, by 49%, levels of taurocholic acid (TCA), the most abundant BA. In addition, knocking down ACSL1 in the liver increased CA content in serum and reduced serum CDCA to undetectable level. Altogether, these results of gene expression analysis and biochemical characterization revealed an unprecedented function of hepatic ACSL1 in BA biosynthesis and suggest that reduction in BA synthesis accounts, at least in part, for elevated FC and TC levels in liver tissue and in the plasma of ACSL1 deficient mice.
3.4. Gene expression profiling
To further examine molecular mechanisms underlying these metabolic changes in BA synthesis and plasma lipoprotein-cholesterol profile we carried out gene expression profiling of individual livers of HFD fed mice infected with Ad-shAcsl1 or control adenovirus Ad-shU6-C. Using a cut off criteria of 1.5-fold change and a p value of < 0.05, we identified 1104 genes that were downregulated and 1707 genes that were upregulated by ACSL1 deficiency. GSEA Reactome pathway analysis of hepatic genes that are downregulated following depletion of ACSL1 revealed that cholesterol biosynthesis and BA metabolism are ranked among the top 10 enriched biological pathways (Fig. 5A). Within the BA metabolism gene set of 23 genes, 15 genes were significantly downregulated that included Cyp8b1 and Cyp7b1 as well as the apical Na+/−dependent bile salt transporter (Asbt, gene symbol SLC10A2) and Baat (Fig. 5B). The array results are consistent with our real-time PCR data. Supplemental Table 3 lists microarray results of all genes within this gene set and shows that the gene expression of Cyp7α1 and Bsep (ABCB11) was unchanged. Interestingly, GSEA KEGG pathway analysis identified that PPAR signaling pathway was down regulated by depleting ACSL1 in the liver of HFD-fed mice (Fig. 5C). Notably, four down-regulated BA metabolic genes Cpy8b1, Cyp27A1, Acox2 and Scp2 are within the PPAR signaling pathway.
Fig. 5.
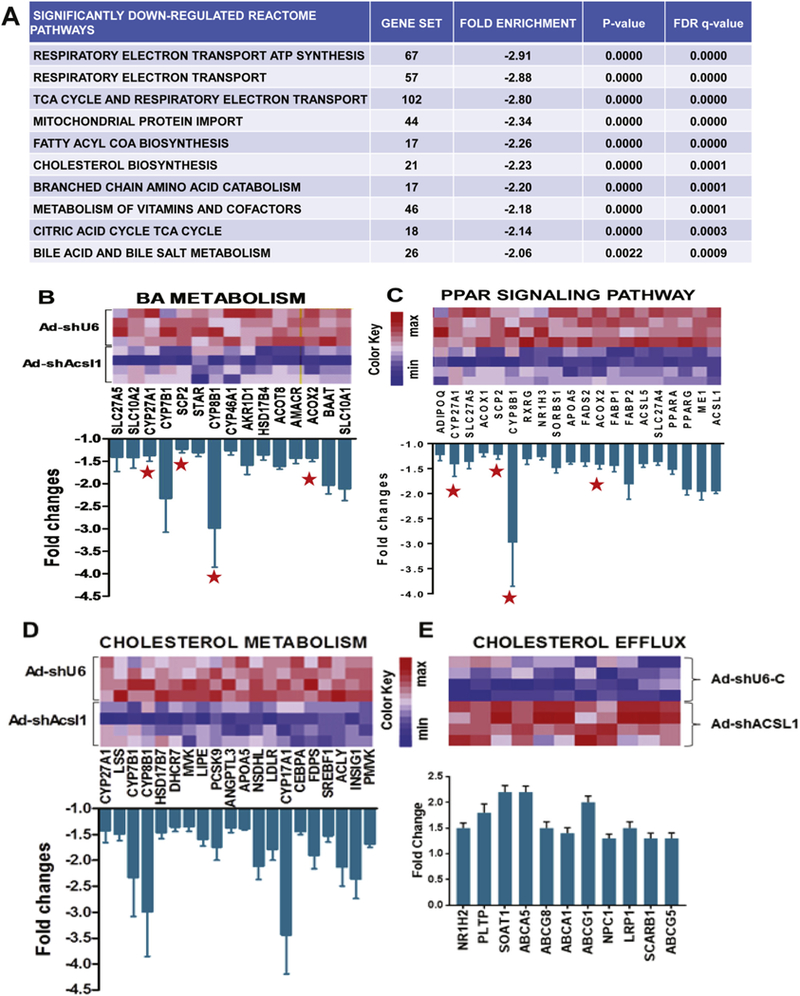
GSEA pathway analyses for lipid categories significantly enriched in a genome-wide expression profiling of repressed or increased genes caused by ACSL1 deficiency.
(A) Top 10 reactome pathways that are enriched in genes downregulated in livers of Ad-shAcsll injected mice (n = 4) compared to that of Ad-shU6-C mice (n = 4).
(B–C) Heatmap illustrations of changes in gene expression of BA metabolism and PPAR signaling pathways. Graphs show fold changes in all genes within the indicated pathway that have a p value < 0.05. A red star sign marks the 4 genes in both pathways.
(D–E) Heatmap illustrations of down regulation of gene expression involved in cholesterol biosynthesis pathway and increased expression of genes in cholesterol excretion pathway. Graphs show fold changes in all genes within the indicated pathway that have a p value < 0.05.
Our previous study identified ACSL1 as a SREBP2 target gene implying its function in cholesterol metabolism [10]. This is supported by the pathway analysis showing that numerous genes involved in the process of cholesterol uptake and biosynthesis including Ldlr, Pcsk9, Srebp1c, farnesyl diphosphate synthetase (Fdps), ATP citrate lyase (Acly), steroid 17-alpha-monooxygenase (gene symbol Cyp17a1) were significantly repressed in the absence of hepatic ACSL1 (Fig. 5D), which corroborated our qRT-PCR results (Fig. 3F).
In contrast to the down regulated cholesterol biosynthesis pathway, the cholesterol efflux pathway was upregulated (Fig. 5E). Several genes within this pathway involved in cholesterol efflux are molecular targets of the liver X receptor (LXR). This suggests that in the ACSL1 depleted liver, LXR was activated to promote cholesterol output to maintain hepatic cholesterol homeostasis, perhaps through a compensatory mechanism. In addition, Reactome pathway analysis of hepatic genes that are repressed following ACSL1 depletion revealed significant enrichments in genes of pyruvate metabolism, TCA cycle, FA metabolism and TG biosynthesis (Supplemental Fig. 3A–D). These data suggest that ACSL1 deficiency suppressed both the synthesis and degradation of fatty acids, resulting in a slightly increased hepatic triglyceride and FFA content (Fig. 3C, D) without affecting their serum levels under the hyperlipidemic condition (Fig. 2G, H). Relative expression values of all genes within the gene sets of above described pathways are listed in Supplemental Table 3.
3.5. Hypercholesterolemic effects of hepatic ACSL1 deficiency in chow-fed mice
Next, we examined effects of ACSL1 KD in mice under normolipidemic conditions. Mice fed a NCD were injected with Ad-shAcsl1 or Ad-shU6-C and liver tissue and fasting serum samples were collected after 11 days of viral injection. Analysis of liver tissues showed an efficient depletion of hepatic ACSL1 protein (Fig. 6A) and mRNA levels (Fig. 6B) as well as reductions of ACSL enzymatic activities (Fig. 6C) albeit to lesser extents as compared to that in HFD fed mice. Importantly, like the hyperlipidemic condition, both serum and hepatic TC and FC levels under the normolipidemic condition were significantly increased in Ad-shAcsl1 transduced mice as compared to control mice (Fig. 6D, E, G, H). Again, we did not observe changes in serum TG levels while the hepatic triglyceride content was slightly increased in ACSL1 KD mice (Fig. 6F, I). Hepatic PL and FFA amounts were unaffected by ACSL1 KD (Supplemental Fig. 4). Although we did not detect a substantial reduction of BA content in the liver of ACSL1 KD mice fed a NCD (Fig. 6J), hepatic gene expression analysis by real-time PCR demonstrated the strong suppression of BA synthetic genes Cyp8b1, Cyp7b1, Baat and cholesterol 24-hydroxylase (gene symbol Cyp46a1) (Fig. 6K) as well as several genes in cholesterol and FA metabolic pathway (Fig. 6L). Overall, these data are highly consistent with results obtained from HFD fed mice, further demonstrating that ACSL1 deficiency in liver tissue significantly affected BA synthesis and cholesterol metabolism without substantial impacts on PL synthesis or triglyceride metabolism.
Fig. 6.
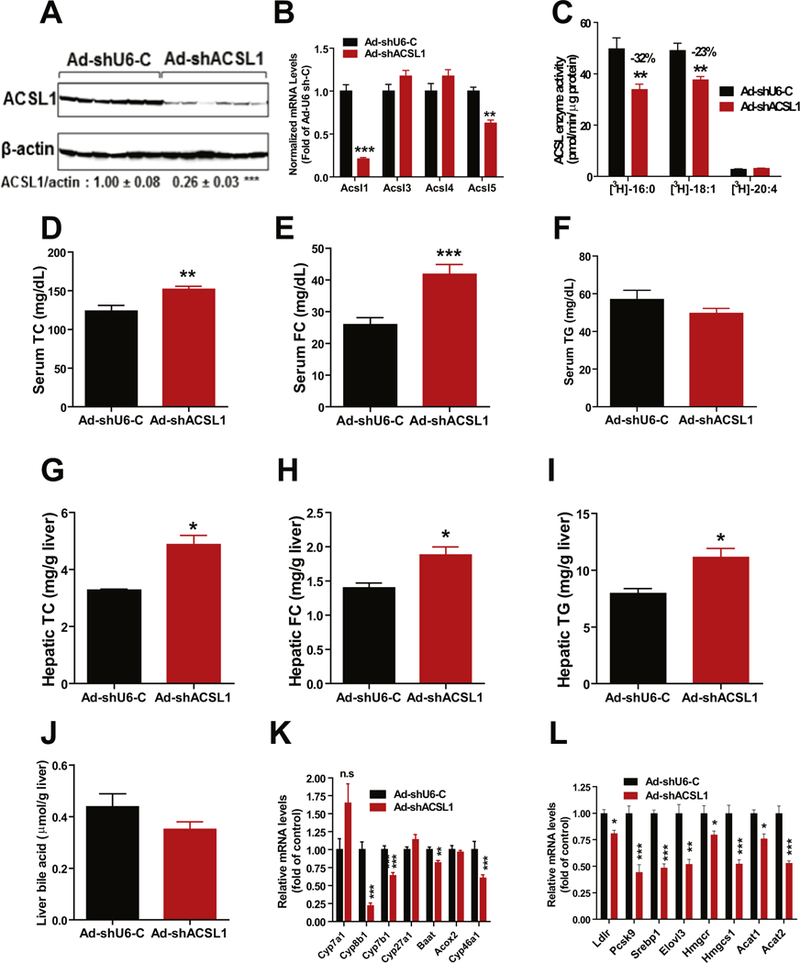
Effects of knocking down hepatic ACSL1 in mice fed a NCD. Male C57BL/6J mice fed a NCD were injected with Ad-shAcsl1 or Ad-shU6-C. After 11-days of adenoviral injection, mice were sacrificed and serum and livers were isolated at the termination. All data are mean ± SEM of 6 mice per group.
(A) Western blot analysis of hepatic ACSL1 protein and β-actin levels. The protein abundance of ACSL1 was quantified and normalized with signals of P-actin using Alpha View Software.
(B) Real-time PCR was conducted to determine the relative expression levels of ACSL isoform mRNAs after normalization with GAPDH mRNA levels.
(C) Total ACSL enzymatic activity in 4 μg of liver homogenate using [3H] labeled PA, [3H] labeled OA and [3H] labeled AA as substrates.
(D) Serum TC.
(E) Serum FC.
(F) Serum triglycerides.
(G) Liver TC.
(H) Liver FC.
(I) Liver TG.
(J) Liver total BA amounts.
(K, L) Real-time PCR measurement of hepatic mRNA levels of indicated genes in BA synthesis and cholesterol metabolism.
In A–L, Significance was determined by Student’s t-test. n = 6 mice per group. *p < 0.05, **p < 0.01, and ***p < 0.001.
3.6. Hepatic ACSL1 is a novel molecular target of FXR
FXR is the BA-activated nuclear receptor that plays key roles in de novo BA synthesis and metabolism. Activations of FXR by its endogenous ligand CDCA or synthetic ligands GW4064 and OCA inhibit BA synthesis via transcriptional suppression of numerous genes encoding enzymes in BA synthetic pathway in liver tissue. Since we have discovered that hepatic ACSL1 is required for BA synthesis, we asked the question of whether FXR regulates Acsl1 gene expression. Initially we treated chow-fed C57BL/6J mice with OCA at a daily dose of 40 mg/ kg or vehicle for 10 days. Impressively, OCA treatment reduced hepatic ACSL1 protein levels to 55% of control (p < 0.001) (Fig. 7A). Hepatic gene expression analysis by real-time PCR further demonstrated the downregulation of Acsl1 gene expression along with known FXR repressive genes Cyp7a1 and Baat and induction of Shp by OCA treatment (Fig. 7B). In contrast to Acsl1, there were no changes in mRNA levels of other ACSL family members Acsl4 and Acsl5. Analysis of serum cholesterol profile and BA levels validated effects of OCA on activation of FXR in these animals as shown by significant reductions of serum TC and HDL-C (Fig. 7C, D) as well as decreases in amounts of total BAs in the liver and serum (Fig. 7E, F). In addition, we examined effects of OCA-induced FXR activation on the expression of ACSL1 mRNA and protein levels in mice fed a high fat and a high cholesterol diet (HFHCD). OCA treatment led to 40% (p < 0.01) reduction of Acsl1 mRNA levels and a 53% (p < 0.01) reduction of ACSL1 protein abundance in the liver of HFHCD fed mice (Supplemental Fig. 5).
Fig. 7.
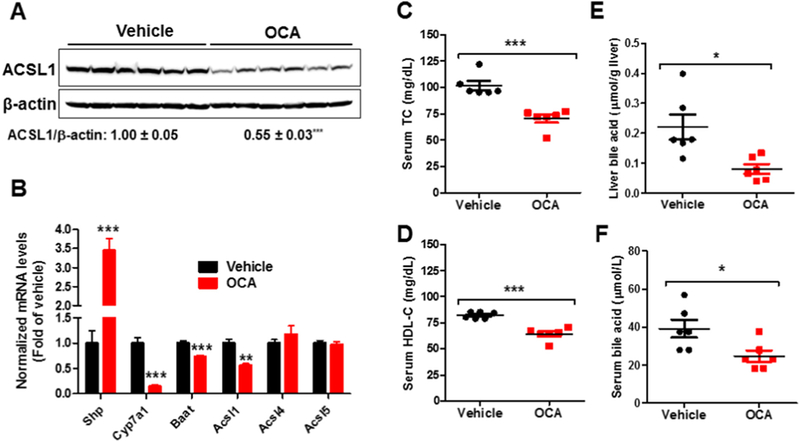
Effects of OCA treatment on hepatic ACSL1 expression and lipid metabolism.
Male mice fed a NCD were orally administered vehicle (n = 6) or OCA at 40 mg/kg/day (n = 6) for 10 days. Mice were sacrificed and 4-h fasting serum and livers were isolated at the termination for the following measurements.
(A) Western blot analysis of hepatic ACSL1 protein and β-actin levels.
(B) Real-time PCR measurement of hepatic mRNA levels of indicated genes modulated by FXR and ACSL isoforms.
(C) Serum TC.
(D) Serum HDL-C.
(E) Liver BA amounts.
(F) Serum BA levels.
In A–F, significance was determined by Student’s t-test. n = 6 mice per group. *p < 0.05, **p < 0.01, and ***p < 0.001. *p < 0.05, **p < 0.01 and ***p < 0.001 compared with the vehicle control group.
To prove that Acsl1 is a bona fade direct target gene of FXR, we analyzed ACSL1 protein expression in liver samples of Fxr−/− mice and their WT littermates as well as C57BL/6 mice that were treated with either vehicle or OCA for 7-days. OCA treatment reduced hepatic ACSL1 protein levels in C57BL/6 mice and WT mice but not in Fxr−/− mice (Fig. 8A–C). Measurement of liver Acsl1 mRNA levels demonstrated a 45% (p < 0.05) reduction by OCA treatment in FXR WT mice but not in the FXR KO mice (Fig. 8D). Additional studies conducted in mouse and human primary hepatocytes further showed that the expression of Acsl1 mRNA was significantly repressed by FXR ligands GW4064 and OCA in MPH along with Cyp7α1 without affecting the expression of other ACSL family members (Fig. 9A). Likewise, treating HPH with three synthetic FXR agonists GW4064, OCA and FXR-450 all led to the repression of ACSL1 mRNA expression (Fig. 9B). Altogether, these data, for the first time, identify ACSL1 as a novel molecular target of BA-activated nuclear receptor FXR.
Fig. 8.
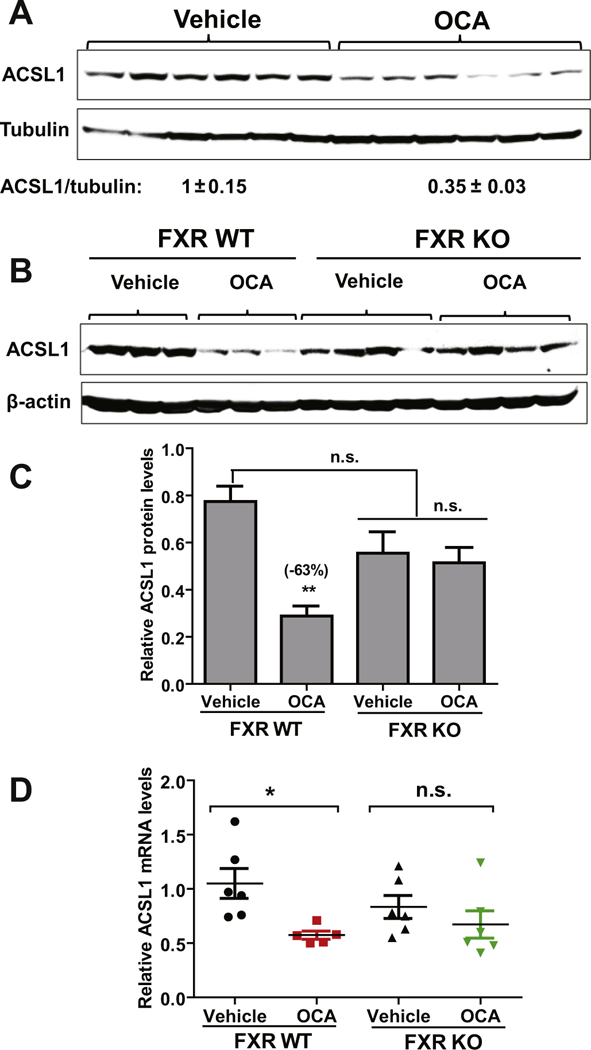
FXR-dependent repression of hepatic ACSL1 expression by OCA. C57BL/6J mice, Fxr−/− mice and their littermate control WT mice were fed a NCD and orally dosed with OCA (40 mg/kg/day) or vehicle for 7-days. At the end of treatment, mice were fasted for 4 h before sacrifice for liver tissue collections.
(A) Western blot analysis of ACSL1 protein and β-actin levels in liver samples of C57BL/6J mice treated with OCA (n = 6) or vehicle (n = 6). Levels of ACSL1 were normalized levels of β-actin. Significance was determined by Student’s t-test. n = 6 mice per group. ***p < 0.001.
(B) Western blot analysis of liver samples from WT mice (n = 3 per group) and Fxr−/− mice (n = 4 per group) treated with OCA (40 mg/kg/day) or vehicle.
(C) ACSL1 protein quantification of all biological replicates from B. Signal is normalized to β-actin. Significance was determined by one-way ANOVA with Dunnett’s correction (vs. vehicle-treated WT group). **, p < 0.01; n.s., not significant.
(D) Real-time PCR analysis of Acsl1 and Gapdh mRNA levels in individual livers of WT and Fxr−/− mice treated with OCA or vehicle. n = 6 per group. Significance was determined by one-way ANOVA with Dunnett’s correction (vs. vehicle-treated WT group). *, p < 0.05; n.s., not significant.
Fig. 9.
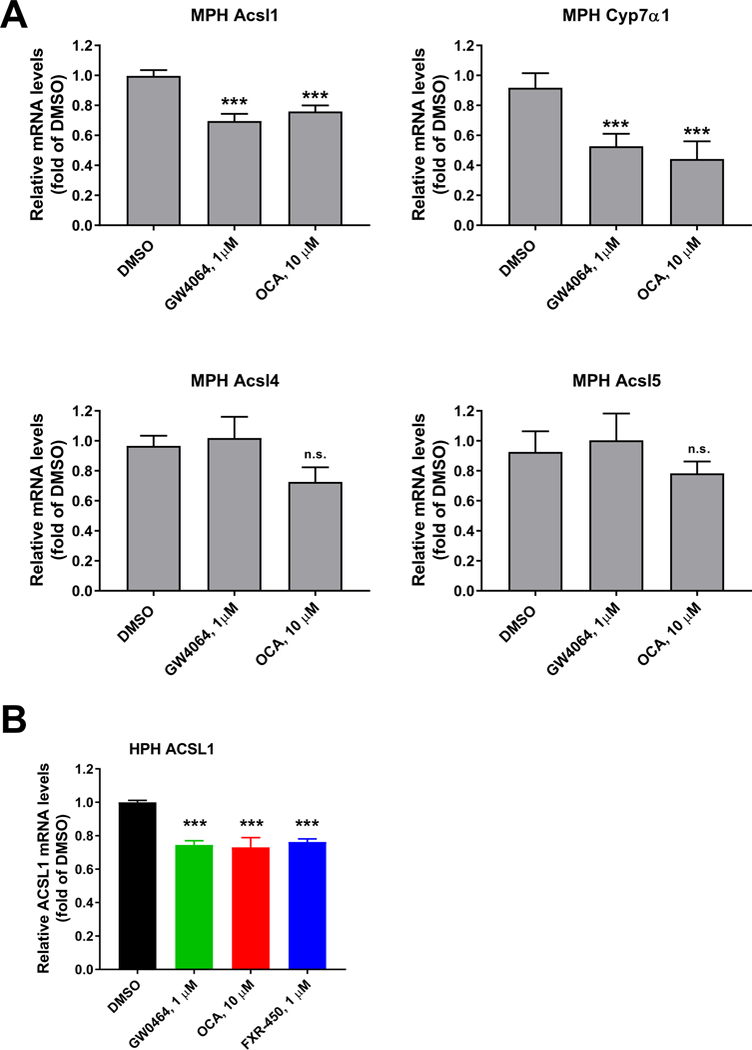
Repression of ACSL1 mRNA expression by FXR agonists in mouse and human primary hepatocytes.
(A) MPHs were treated with GW4064 (1 μM) and OCA (10 μM) for 24 h before isolation of total RNA. Triplicate wells were used in each condition. qRT-PCR was performed to measure relative mRNA levels of indicated genes with triplicate measurement of each cDNA sample.
(B) HPHs were treated with FXR agonists at indicated concentrations for 24 h before isolation of total RNA. Duplicate wells were used in each condition and qRT-PCR was performed to measure ACSL1 and GAPDH mRNA levels with triplicate measurement of each cDNA sample.
Statistical significance was determined with One-way ANOVA with Dunnett’s Multiple Comparison posttest. ***p value < 0.001 compared to the DMSO control.
4. Discussion
ACSL1 is the dominant isoform of ACSL family in liver tissue, reduction of ACSL1 levels of expression and activity should inevitably impact the LCFA metabolism at hepatic level and at the whole-body level, particularly under hyperlipidemic conditions. In this current study, we utilized a model of acute deficiency of hepatic ACSL1 in adult mice to elucidate its hepatic functions in major FA metabolic pathways. The most important and novel findings of our study are the obligatory role of hepatic ACSL1 in BA synthesis and the repression of ACSL1 expression by activated FXR in liver tissue and cultured primary hepatocytes.
ACSL family enzymes catalyze the first step in FA metabolism by converting LCFA into acyl-CoA thioesters, that allows acyl-CoAs entry into both anabolic and catabolic pathways [1,5,23–25]. Functions of ACSL1 in channeling LCFA into catabolic FA β-oxidation pathway in heart, adipose tissues and skeletal muscle have been demonstrated in previous studies utilizing tissue-specific knockout mouse models [4–6]. Additionally, in vitro functions of ACSL1 in channeling LCFA into anabolic pathways of diacylglycerol and PL synthesis in primary rat hepatocytes were previously shown by adenovirus mediated overexpression [13]. However, functions of ACSL1 in directing LCFA into specific anabolic pathways in liver tissue in vivo have not been clearly identified because genetic deletion of hepatic ACSL1 did not grossly change CE, TAG, PL or FC content in plasma or in liver tissue of ACSL1L−/− mice [7].
In the current investigation, we first demonstrated that adenovirus mediated expression of Acsl1 shRNA led to efficient and specific depletion of Acsl1 mRNA and ACSL1 protein in the liver of mice fed a HFD. Using 3H-palmitic acid as the substrate, we showed that total acyl-CoA synthetase activity in the liver of Ad-shAcsl1 transduced mice fed a HFD was lowered to 45% of control, which was comparable to the decreased level achieved by the genetic deletion in Acsl1L−/− mice [7]. Interestingly, unlike the Acsl1L−/− adult mice which had normal lipid levels indistinguishable from the control WT mice, the acute depletion of ACSL1 generated a hypercholesterolemic phenotype with substantially elevated circulating TC, LDL-C and FC without altering serum TG, FFA and PL levels. Furthermore, ACSL1 KD resulted in significant accumulations of hepatic TC and FC levels compared to the control mice. These in vivo observations contrast with previous in vitro studies that suggested roles of hepatic ACSL1 in TG and PL synthesis [13,26,27]. Our results from hyperlipidemic mice suggested that the primary function of hepatic ACSL1 is to maintain cholesterol homeostasis as in the absence of ACSL1 both plasma and hepatic cholesterol metabolism became dysregulated. This notion is supported by results of subsequent studies of chow-fed mice. Depletion of hepatic ACSL1 in mice fed a NCD led to elevations of serum and hepatic TC and FC as well (Fig. 6).
It was intriguing that most significant changes in lipid profile were increased FC amounts in circulation and in liver tissue. One possible underlying mechanism accountable for accumulations of FC in ACSL1 deficient mice could be a compromised BA synthesis in the liver. However, none of previous studies of ACSL enzyme family have ever reported involvements of ACSL in BA metabolic pathway. We first explored this possibility by measuring mRNA levels of a panel of genes encoding key enzymes in BA synthesis and discovered that ACSL1 deficiency resulted in severely reduced gene expression of Cyp8b1 and Cyp7b1, encoding two key enzymes in BA synthesis [28]. Another supporting evidence came from measurements of hepatic total BA levels that showed a substantial 42% reduction in ACSL1 KD mice compared to control mice. In addition to reduced total BA content in the liver, measurements of individual BAs from pooled serum samples of Ad-shAcsl1 and AdshU6-C mice revealed substantial changes in BA compositions (Supplemental Table 2). Our whole genome-wide gene expression profiling of liver tissues from HFD fed mice further identified BA metabolic pathway being significantly repressed by ACSL1 deficiency (Fig. 5B). Interestingly, PPAR signaling pathway was also repressed in ACSL1 deficient liver and the gene list includes four genes identified in BA pathway. It has been previously reported that PPARα activation induces Cpy8b1, ACOX and SCP2 in liver tissues [29,30], and it is also recognized that certain acyl-CoA species act as agonists or signaling molecules to regulate nuclear receptors [1]. Thus, it is possible that depletion of ACSL1 in the liver reduced acyl-CoA derived endogenous ligands for PPARα, which in turn lowered the transcription for Cyp8b1 and other genes involved in BA synthetic pathway. ACSL5 has been shown to be induced by PPARα activation in liver tissue [31]. The facts that Acsl5 mRNA levels were not reduced by Ad-shAcsl1 transduction in cultured hepatic cells but was decreased in ACSL1-depleted liver provide additional evidence supporting the connection between ACSL1 depletion and reduced PPARα activity.
ACSL1 is known to be transcriptionally activated by PPARα and is considered contributing to PPARα-induced FA catabolism by channeling LCFA into β-oxidation pathway [8,9]. In addition to PPARα, our previous studies have identified ACSL1 as a SREBP2 target gene. We showed that activation of SREBP2 by statin increased ACSL1 expression and activity that were associated with increased CE and reduced FC levels in plasma and the liver of mice [10]. Thus, upregulation of ACSL1 transcription by SREBP2 provides a molecular mechanism to explain the function of ACSL1 in channeling acyl-CoAs into anabolic pathway of CE synthesis.
Intriguingly, in this study we have discovered a new regulation of ACSL1 gene expression by OCA-activated FXR that inhibits Acsl1 gene expression in liver tissue. In all three separate treatments, we found that OCA treatment markedly reduced hepatic ACSL1 mRNA level and protein abundance. Importantly, we observed OCA-induced down-regulation of ACSL1 expressions only in FXR WT mice but not in the FXR KO mice, which demonstrated the FXR dependency of this novel regulation. In contrast to ACSL1, hepatic expressions of other ACSL family members were unaffected by OCA treatment, indicating an isoform specific regulation by FXR. Utilizing primary hepatocytes of mouse and human origins, we further demonstrated the repression of Acsl1 gene expression by FXR activated by three FXR agonists GW4064, OCA and FXR-450 (Fig. 9).
It is well documented that FXR mediates the repression of numerous genes involved in BA metabolism indirectly through upregulations of small heterodimer partner (SHP) and MAFG (V-Maf Avian Musculoaponeurotic Fibrosarcoma Oncogene Homolog G) that are FXR-induced transcriptional repressors [32]. However, our microarray results indicated that hepatic ACSL1 depletion had no effects on SHP or MAFG gene expression, suggesting that these FXR-induced transcriptional repressors are not directly involved. Utilizing the Matinspector software, we analyzed the upstream 5′ flanking regions of human ACSL1 gene and mouse ACSL1 gene and a consensus FXRE (IR-1) sequence motif was not identified in ACSL1 promoter.
Additional to the transcriptional suppression, a recent study reported that FXR activation led to repression of Cyp7α1 gene expression via a posttranscriptional mechanism of reduced mRNA stability [33]. Thus, the down regulation of Acsl1 gene expression by activated FXR could be mediated by transcriptional repression or accelerated mRNA degradation. Further investigations will be required to fully understand the underlying mechanism by which OCA downregulates hepatic Acsl1 expression and its consequential impact on BA synthesis and metabolism. Nevertheless, the fact that Acsl1 expression is repressed by FXR along with other FXR regulated genes encoding key enzymes in BA synthesis further underscores the key role of ACSL1 in this anabolic pathway.
In conclusion, as summarized in the left panel of Fig. 10, ACSL1 plays critical roles in FA β-oxidation in extra hepatic metabolic tissues such as heart. In liver tissue, ACSL1 channels fatty acyl-CoA into anabolic pathways to synthesize TAG, PL, ceramide and CE as well as bile acids that is a novel function of this enzyme identified by the current study. As illustrated in the right panel, transcription of Acsl1 in liver tissue is under tight regulations of SREBP2 and FXR, the two master regulators of cholesterol biosynthesis and BA synthesis. ACSL1 generates acyl-CoA substrates that can be utilized in CE synthesis. Induction of Acsl1 transcription by SREBP2 leads to increased formation of CE and reduced FC in hepatocytes. Based upon the biochemical data and transcriptomic analysis, we hypothesize that some ACSL1 produced acyl-CoA species might serve as ligands for nuclear receptor PPARα to upregulate the expression of genes involved in BA synthesis such as Cyp8b1 to convert FC into BA. Increased hepatic BA concentrations activate FXR via a negative feedback mechanism to inhibit Acsl1 expression along with Cyp7α1 and other genes involved in BA synthesis. Our discovery of down regulation of ACSL1 by activated FXR uncovers a key role of this ACSL enzyme in maintaining hepatic cholesterol homeostasis.
Fig. 10.
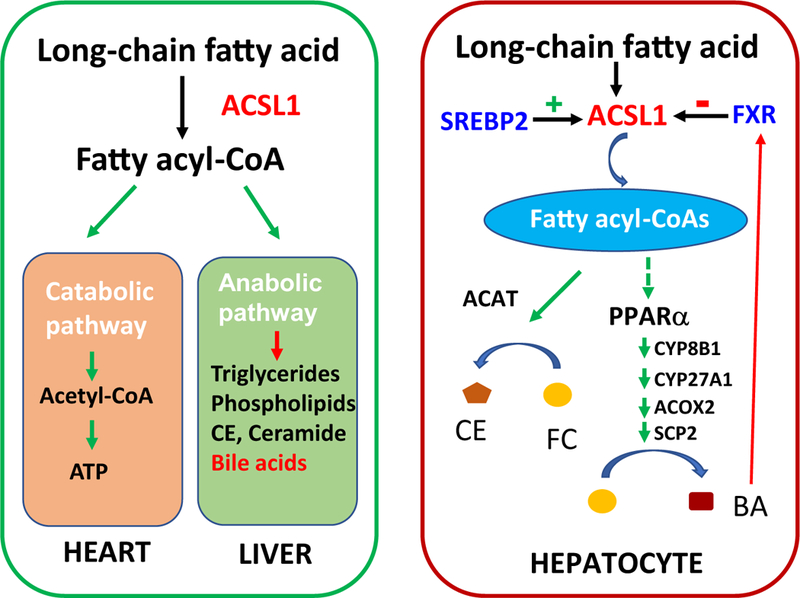
Functions of ACSL1 in hepatic and extra-hepatic tissues and its role in maintaining hepatic cholesterol homeostasis.
ACSL1 plays critical roles in catabolic pathway of FA metabolism to produce energy in extra hepatic metabolic tissues such as heart; in liver tissue, ACSL1 channels fatty acyl-CoA into anabolic pathways for synthesis of TAG, PL, ceramide, and the newly identified bile acids (left panel). Transcription of Acsl1 is upregulated by SREBP2 and downregulated by FXR. ACSL1 generates fatty acyl-CoA substrates that can be utilized in CE synthesis and this pathway is induced by SREBP2. Hypothetically, some ACSL1 produced acyl-CoA species might serve as endogenous ligands for PPARα to upregulate the expression of its target genes involved in BA synthesis including Cyp8b1 to convert cholesterol into BA. Increased hepatic BA concentrations activate FXR as a negative feedback mechanism to inhibit Acsl1 expression to repress BA synthesis (right panel).
Finally, it is important to note that our current study did not identify the ACSL1 produced and specific acyl-CoA species for PPARα activation and the possible impact of hepatic ACSL1 deficiency on BA metabolism in other tissues such as intestine and gallbladder, which will be the focus on our future investigations.
Supplementary Material
Acknowledgements
This study was supported by the Department of Veterans Affairs (Office of Research and Development, Medical Research Service; I01 BX001419 to J. L.) and by NIH grants (R01AT006336-01A1 to J.L.; R01HL103227 and R01DK102619 to Y.Z.).
Abbreviations:
- AA
arachidonic acid
- ACSL
long-chain acyl-CoA synthetases
- BA
bile acid
- CA
cholic acid
- CDCA
chenodeoxycholic acid
- CE
cholesterol ester
- FA
fatty acid
- FC
free cholesterol
- FDR
false discovery rate
- FFA
free fatty acid
- FXR
farnesoid X receptor
- HFD
high-fat diet
- HFHCD
high fat and high cholesterol diet
- HPH
human primary hepatocytes
- KD
knockdown
- KO
knockout
- LCFA
long-chain fatty acids
- MOI
multiplicity of infection
- MPH
mouse primary hepatocytes
- NCD
normal chow diet
- OA
oleic acid
- OCA
obeticholic acid
- PA
palmitic acid
- PL
phospholipid
- PPAR
peroxisome proliferator activated receptor
- SHP
small heterodimer partner
- SREBP
sterol-response element binding protein
- TCA
taurocholic acid
- TG
triglyceride
- WT
wild-type
Footnotes
Transparency document
The Transparency document associated with this article can be found, in online version.
Appendix A. Supplementary data
Supplementary data to this article can be found online at https://doi.org/10.1016/j.bbalip.2018.12.012.
Conflict of interest
None of authors have a conflict of interest regarding this study.
References
- [1].Grevengoed TJ, Klett EL, Coleman RA, Acyl-CoA metabolism and partitioning, Annu. Rev. Nutr. 34 (2014) 1–30. [DOI] [PMC free article] [PubMed] [Google Scholar]
- [2].Mashek DG, Li LO, Coleman RA, Rat long-chain acyl-CoA synthetase mRNA, protein, and activity vary in tissue distribution and in response to diet, J. Lipid Res. 47 (2006) 2004–2010. [DOI] [PubMed] [Google Scholar]
- [3].Soupene E, Kuypers FA, Mammalian long-chain acyl-CoA synthetases, Exp. Biol. Med. 233 (2008) 507–521. [DOI] [PMC free article] [PubMed] [Google Scholar]
- [4].Ellis JM, Mentock SM, Depetrillo MA, Koves TR, Sen S, Watkins SM, Muoio DM, Cline GW, Taegtmeyer H, Shulman GI, Willis MS, Coleman RA, Mouse cardiac acyl coenzyme a synthetase 1 deficiency impairs fatty acid oxidation and induces cardiac hypertrophy, Mol. Cell. Biol. 31 (2011) 1252–1262. [DOI] [PMC free article] [PubMed] [Google Scholar]
- [5].Ellis JM, Li LO, Wu PC, Koves TR, Ilkayeva O, Stevens RD, Watkins SM, Muoio DM, Coleman RA, Adipose acyl-CoA synthetase-1 directs fatty acids to-ward beta-oxidation and is required for cold thermogenesis, Cell Metab. 12 (2010) 53–64. [DOI] [PMC free article] [PubMed] [Google Scholar]
- [6].Li LO, Grevengoed TJ, Paul DS, Ilkayeva O, Koves TR, Pascual F, Newgard CB, Muoio DM, Coleman RA, Compartmentalized acyl-CoA metabolism in skeletal muscle regulates systemic glucose homeostasis, Diabetes 64 (2015) 23–35. [DOI] [PMC free article] [PubMed] [Google Scholar]
- [7].Li LO, Ellis JM, Paich HA, Wang S, Gong N, Altshuller G, Thresher RJ, Koves TR, Watkins SM, Muoio DM, Cline GW, Shulman GI, Coleman RA, Liver-specific loss of long chain acyl-CoA synthetase-1 decreases triacylglycerol synthesis and beta-oxidation and alters phospholipid fatty acid composition, J. Biol. Chem. 284 (2009) 27816–27826. [DOI] [PMC free article] [PubMed] [Google Scholar]
- [8].schoonjans K, Watanabe M, Suzuki H, Mahfoudi A, Krey G, Wahli W, Grimaldi P, Staels B, Yamamoto T, Auwerx J, Induction of the acyl-coenzyme A synthetase gene by fibrates and fatty acids is mediated by a peroxisome proliferator response element in the C promoter, J. Biol. Chem. 270 (1995) 19269–19276. [DOI] [PubMed] [Google Scholar]
- [9].Suzuki H, Watanabe M, Fujino T, Yamamoto T, Multiple promoters in rat acyl-CoA synthetase gene mediate differential expression of multiple transcripts with 5′-end heterogeneity, J. Biol. Chem. 270 (1995) 9676–9682. [DOI] [PubMed] [Google Scholar]
- [10].Singh AB, Kan CF, Dong B, Liu J, SREBP2 activation induces hepatic long-chain acyl-CoA synthetase 1 (ACSL1) expression in vivo and in vitro through a sterol regulatory element (SRE) motif of the ACSL1 C-promoter, J. Biol. Chem. 291 (2016) 5373–5384. [DOI] [PMC free article] [PubMed] [Google Scholar]
- [11].Horton JD, Goldenstein JL, Brown MS, SREBPs: activators of the complete program of cholesterol and fatty acid synthesis in the liver, J. Clin. Invest. 109 (2002) 1125–1131. [DOI] [PMC free article] [PubMed] [Google Scholar]
- [12].Sanderson LM, Boekschoten MV, Desvergne B, Muller M, Kersten S, Transcriptional profiling reveals divergent roles of PPARalpha and PPARbeta/delta in regulation of gene expression in mouse liver, Physiol. Genomics 41 (2010) 42–52. [DOI] [PubMed] [Google Scholar]
- [13].Li LO, Mashek DG, An J, Doughman SD, Newgard CB, Coleman RA, Overexpression of rat long chain acyl-coa synthetase 1 alters fatty acid metabolism in rat primary hepatocytes, J. Biol. Chem. 281 (2006) 37246–37255. [DOI] [PubMed] [Google Scholar]
- [14].Sinal CJ, Tohkin M, Miyata M, Ward JM, Lambert G, Gonzalez FJ, Targeted disruption of the nuclear receptor FXR/BAR impairs bile acid and lipid homeostasis, Cell 102 (2000) 731–744. [DOI] [PubMed] [Google Scholar]
- [15].Forman BM, Goode E, Chen J, Oro AE, Bradley DJ, Perlmann T, Noonan DJ, Burka LT, McMorris T, Lamph WW, Evans RM, Weinberger C, Identification of a nuclear receptor that is activated by farnesol metabolites, Cell 81 (1995) 687–693. [DOI] [PubMed] [Google Scholar]
- [16].Ijssennagger N, Janssen AWF, Milona A, Ramos Pittol J.M., Hollman DAA, Mokry M, Betzel B, Berends FJ, Janssen IM, van Mil SWC, Kersten S, Gene expression profiling in human precision cut liver slices in response to the FXR agonist obeticholic acid, J. Hepatol. 64 (2016) 1158–1166. [DOI] [PubMed] [Google Scholar]
- [17].Singh AB, Liu J, Identification of hepatic lysophosphatidylcholine acyltransferase 3 as a novel target gene regulated by peroxisome proliferator-activated receptor delta, J. Biol. Chem. 292 (2017) 884–897. [DOI] [PMC free article] [PubMed] [Google Scholar]
- [18].Xu Y, Li F, Zalzala M, Xu J, Gonzalez FJ, Adorini L, Lee YK, Yin L, Zhang Y, Farnesoid X receptor activation increases reverse cholesterol transport by modulating bile acid composition and cholesterol absorption in mice, Hepatology 64 (2016) 1072–1085. [DOI] [PMC free article] [PubMed] [Google Scholar]
- [19].Dong B, Young M, Liu X, Singh AB, Liu J, Regulation of lipid metabolism by obeticholic acid in hyperlipidemic hamsters, J. Lipid Res. 58 (2017) 350–363. [DOI] [PMC free article] [PubMed] [Google Scholar]
- [20].Singh AB, Kan CF, Shende V, Dong B, Liu J, A novel posttranscriptional mechanism for dietary cholesterol-mediated suppression of liver LDL receptor expression, J. Lipid Res. 55 (2014) 1397–1407. [DOI] [PMC free article] [PubMed] [Google Scholar]
- [21].Dong B, Kan CF, Singh AB, Liu J, High-fructose diet downregulates long-chain acyl-CoA synthetase 3 expression in liver of hamsters via impairing LXR/RXR signaling pathway, J. Lipid Res. 54 (2013) 1241–1254. [DOI] [PMC free article] [PubMed] [Google Scholar]
- [22].Klett EL, Chen S, Yechoor A, Lih FB, Coleman RA, Long-chain acyl-CoA synthetase isoforms differ in preferences for eicosanoid species and long-chain fatty acids, J. Lipid Res. 58 (2017) 884–894. [DOI] [PMC free article] [PubMed] [Google Scholar]
- [23].Askari B, Kanter JE, Sherrid AM, Golej DL, Bender AT, Liu J, Hsueh WA, Beavo JA, Coleman RA, Bornfeldt KE, Rosiglitazone inhibits acyl-CoA synthetase activity and fatty acid partitioning to diacylglycerol and triacylglycerol via a peroxisome proliferator-activated receptor-gamma-independent mechanism in human arterial smooth muscle cells and macrophages, Diabetes 56 (2007) 1143–1152. [DOI] [PMC free article] [PubMed] [Google Scholar]
- [24].Lopes-Marques M, Cunha I, Reis-Henriques MA, Santos MM, Castro LF, Diversity and history of the long-chain acyl-CoA synthetase (Acsl) gene family in vertebrates, BMC Evol. Biol. 13 (2013) 271. [DOI] [PMC free article] [PubMed] [Google Scholar]
- [25].Ellis JM, Frahm JL, Li LO, Coleman RA, Acyl-coenzyme A synthetases in metabolic control, Curr. Opin. Lipidol. 21 (2010) 212–217. [DOI] [PMC free article] [PubMed] [Google Scholar]
- [26].Fujimoto Y, Itabe H, Kinoshita T, Homma KJ, Onoduka J, Mori M, Yamaguchi S, Makita M, Higashi Y, Yamashita A, Takano T, Involvement of ACSL in local synthesis of neutral lipids in cytoplasmic lipid droplets in human hepatocyte HuH7, J. Lipid Res. 48 (2007) 1280–1292. [DOI] [PubMed] [Google Scholar]
- [27].Coleman RA, Lewin TM, Muoio DM, Physiological and nutritional regulation of enzymes of triacylglycerol synthesis, Annu. Rev. Nutr. 20 (2000) 77–103. [DOI] [PubMed] [Google Scholar]
- [28].Russell DW, The enzymes, regulation, and genetics of bile acid synthesis, Annu. Rev. Biochem. 72 (2003) 137–174. [DOI] [PubMed] [Google Scholar]
- [29].Hunt MC, Yang YZ, Eggertsen G, Carneheim CM, Gafvels M, Einarsson C, Alexson SE, The peroxisome proliferator-activated receptor alpha (PPARalpha) regulates bile acid biosynthesis, J. Biol. Chem. 275 (2000) 28947–28953. [DOI] [PubMed] [Google Scholar]
- [30].Ellinghaus P, Wolfrum C, Assmann G, Spener F, Seedorf U, Phytanic acid activates the peroxisome proliferator-activated receptor alpha (PPARalpha) in sterol carrier protein 2-/sterol carrier protein x-deficient mice, J. Biol. Chem. 274 (1999) 2766–2772. [DOI] [PubMed] [Google Scholar]
- [31].Janssen AW, Betzel B, Stoopen G, Berends FJ, Janssen IM, Peijnenburg AA, Kersten S, The impact of PPARalpha activation on whole genome gene expression in human precision cut liver slices, BMC Genomics 16 (2015) 760. [DOI] [PMC free article] [PubMed] [Google Scholar]
- [32].de Aguiar Vallim TQ, Tarling EJ, Ahn H, Hagey LR, Romanoski CE, Lee RG, Graham MJ, Motohashi H, Yamamoto M, Edwards PA, MAFG is a transcriptional repressor of bile acid synthesis and metabolism, Cell Metab. 21 (2015) 298–310. [DOI] [PMC free article] [PubMed] [Google Scholar]
- [33].Tarling EJ, Clifford BL, Cheng J, Morand P, Cheng A, Lester E, et al. , RNA-binding protein ZFP36L1 maintains posttranscriptional regulation of bile acid metabolism, J. Clin. Invest. 127 (2017) 3741–3754. [DOI] [PMC free article] [PubMed] [Google Scholar]
Associated Data
This section collects any data citations, data availability statements, or supplementary materials included in this article.


