

Abstract
Background:
The aim of this study was to determine the association between cardiovascular health (CVH) in young adulthood and left ventricular (LV) structure and function later in life.
Methods:
Participants from the Coronary Artery Risk Development in Young Adults study, which recruited black and white participants aged 18 to 30 years at baseline, were included; echocardiography was performed at year 25. CVH at year 0 was defined on the basis of blood pressure, total cholesterol, fasting glucose, body mass index, smoking status, diet, and physical activity. Two, 1, or 0 points were assigned to each component for ideal, intermediate, and poor levels of each component. Participants were stratified into CVH groups on the basis of point score: #8 (poor), 9 to 11 (intermediate), and 12 to 14 (ideal).
Results:
The distribution of CVH at year 0 was as follows: poor, n = 264 (9%); intermediate, n = 1,315 (47%); and ideal, n = 1,224 (44%). Individuals with ideal and intermediate CVH at year 0 had significantly lower LV end-diastolic volume and lower LV mass index at year 25. In participants with ideal and intermediate CVH, the multivariate-adjusted odds ratios for diastolic dysfunction at year 25 was 0.52 (95% CI, 0.37–0.73) and 0.63 (95% CI, 0.46–0.83), respectively, compared with participants with poor CVH. Participants with ideal and intermediate CVH had significantly lower odds for LV hypertrophy; the LV mass index was 5.3 to 8.7 g/m2.7 lower (P < .001 for both) than in participants with poor CVH.
Conclusion:
Greater levels of CVH in young adulthood are associated with lower LV mass and lower risk for diastolic dysfunction 25 years later.
Keywords: Echocardiography, Cardiovascular health, Left ventricular mass
Background
The American Heart Association (AHA) published a set of priorities to promote cardiovascular health (CVH) in the general population.1 The AHA’s 2020 strategic impact goals define ideal, intermediate, and poor levels of three health factors (blood pressure, total cholesterol, and fasting blood glucose) and four health behaviors (nonsmoking status, body mass index (BMI), physical activity, and nutrition) that form the basis of defining levels of CVH. Previous data from epidemiologic cohorts have reported that the CVH profile is associated with overall survival, cardiovascular mortality, fatal and nonfatal cardiovascular disease (CVD) events, reduced burden of subclinical atherosclerosis,2,3 and cancer incidence.4 However, data are sparse on the longitudinal association of CVH in young adulthood with left ventricular (LV) structure and function later in life.
Subclinical LV systolic and diastolic dysfunction is an important precursor of incident heart failure and is associated with markedly increased risk for all-cause mortality.5,6 Indeed, an observational study from Rochester, Minnesota, reported that incident heart failure is nearly always preceded by preclinical systolic or diastolic dysfunction.5 Even in young adults, the presence of LV diastolic dysfunction is associated with increased risk for clinical CVD and all-cause mortality.7 The objective of our study was to determine if CVH factors and behaviors in young adulthood are associated with LV structure and systolic and diastolic function later in life. An association between optimal CVH factors and behaviors with favorable LV structure and function would provide important insight into prevention strategies for heart failure.
Methods
Cohort
The Coronary Artery Risk Development in Young Adults (CARDIA) study is an ongoing community-based study funded by the National Heart, Blood, and Lung Institute. Details of the study design and objectives have been published elsewhere.8,9 Briefly, the initial cohort included 5,115 individuals recruited in 1985 and 1986 from four urban communities: Birmingham, Alabama; Chicago, Illinois; Minneapolis, Minnesota; and Oakland, California. The sample consisted of approximately equal proportions of black and white men and women, aged 18 to 30 years at the time of enrollment and aged 43 to 55 years at the time of echocardiography. A total of 3,499 participants were examined at year 25, representing 72% of the surviving cohort. We excluded participants who experienced myocardial infarctions, strokes, or coronary revascularization during the follow-up period (n = 103 [2% of the overall cohort]). We also excluded two transgender participants and 200 participants with incomplete CVH information. Among the remaining 3,194 participants, 60 did not undergo echocardiography, and 331 had incomplete echocardiographic measurements. Thus, 2,803 participants constituted the sample for this analysis.
The CARDIA protocol for the measurement of covariates has been described in detail.9 Following a 5-min rest, an Omron sphygmomanometer (Omron, Kyoto, Japan) was used to measure systolic blood pressure. Total and high-density lipoprotein cholesterol was measured enzymatically.10 Fasting blood glucose was measured using the hexokinase ultraviolet assay. Height and weight were measured with participants wearing no shoes and only light clothing, and BMI was calculated as weight in kilograms divided by the square of height in meters. Smoking status was determined by self-report and validated in a prior study using serum cotinine levels.11 Dietary intake was measured using an interviewer-administered food frequency questionnaire. Intake of potassium, calcium, fiber, and saturated fat was calculated from the University of Minnesota Nutrition Coordinating Center Food Composition Database, version 10.12 The CARDIA physical activity history was used to derive the physical activity score and has been described in detail elsewhere.13 We used the education measure from the year 25 examination.
Definition of CVH
The seven components of the CVH profile are blood pressure, total cholesterol, fasting blood glucose, BMI, smoking status, physical activity, and diet. The classification for each health behavior and health factor is shown in Table 1 and is identical to definitions used in a previous CARDIA analysis.14 We used partition values for physical activity and diet that were also similar to a previous analysis.14 For the physical activity score, the highest 40% corresponds to 480.0 and 307.3 exercise units for men and women, respectively. Approximately 300 exercise units corresponds to the recommendation by the American College of Sports Medicine for the amount of exercise needed to support weight loss.15 The dietary score calculation has also been described in detail previously.14 The highest 40% is intended to correspond with the Dietary Approaches to Stop Hypertension eating pattern.16
Table 1.
Classification of CVH components
| Component | Optimal (2 points) | Intermediate (1 point) | Poor (0 points) |
|---|---|---|---|
| Smoking | Never or quit >12 months | Former ≤12 months | Current |
| BMI (kg/m2) | <25 | 25–29.9 | ≥30 |
| PA | Top 40% on PA questionnaire | Second 40% on PA questionnaire | Lowest 20% on PA questionnaire |
| Diet | Highest 40% diet score | Second 40% on diet score | Lowest 20% on diet score |
| Blood pressure (mm Hg) | <120/<80 without any medications | SBP 120–139 or DBP 80–89 or treated to <120/<80 | SBP ≥ 140 or DBP ≥ 90 |
| Total cholesterol (mg/dL) | <200 without medication | 200–239 or treated to <200 | ≥240 |
| Fasting glucose (mg/dL) | < 100 without medication | 100–125 or treated to <100 | ≥126 |
DBP, Diastolic blood pressure; PA, physical activity; SBP, systolic blood pressure.
We defined a composite CVH score for each participant at the year 0 examination, as has been described previously.14,17 Each individual component was assigned a score of 0 (poor), 1, (intermediate), or 2 (optimal). Thus, a participant with optimal levels of all components would have a score of 14. We then classified participants with point scores ≤ 8 as having poor overall CVH, those with scores of 9 to 11 as having intermediate overall CVH, and those with scores ≥ 12 as having ideal overall CVH.
Echocardiography
The design, acquisition, and storage of echocardiographic data were similar to a protocol that has been previously described and are similar to recommendations from the American Society of Echocardiography.18,19 Participants underwent two-dimensional, M-mode, Doppler, and tissue Doppler scanning at the year 25 examination using an Artida cardiac ultrasound scanner (Toshiba Medical Systems, Otawara, Japan). The complete scanning protocol, cardiologists and technologists, and members of the CARDIA Echo Committee are available online at the CARDIA study web site (http://cardia2.dopm.uab.edu/).
We used the biplane method of disks in the apical four-chamber view to calculate LV end-diastolic volume (LVEDV) and LV end-systolic volume (LVESV). Stroke volume was calculated as LVEDV - LVESV, and LV ejection fraction (LVEF) was calculated as (LVEDV - LVESV)/LVEDV. LV volumes were indexed to height. LV mass was derived from diastolic measurements of LV internal diameter in diastole (LVIDd), LV posterior wall thickness (LVPWT), and interventricular septal thickness (IVST). LV mass was then calculated according to the formula developed by Devereux and indexed to height2.7, as previously done in CARDIA20: LV mass (g) = 0.80{1.04 [(LVIDd + IVST + LVPWT)3 - LVIDd3]} + 0.6. Parasternal long-axis two-dimensional views were used to guide the assessment of M-mode anteroposterior diameter of the left atrium. Left atrial volumes were acquired from a two-dimensional four-chamber view, measured at the point of maximum atrial volume, and calculated using the biplane method of disks.
Pulsed-wave Doppler was performed in the apical four-chamber view to assess mitral inflow velocities. Peak early filling (E wave) and peak late filling (A wave) were measured. Pulsed-wave Doppler tissue imaging was used to acquire early and late mitral annular velocities in diastole. The sample volume was placed within 1 cm of the mitral valve septal and lateral insertion sites; E′ denotes the early mitral annular velocity. The tissue Doppler velocity at the lateral mitral annulus in systole was also acquired (denoted as S′). We estimated LV filling pressures by dividing E velocity by lateral E′ velocity.
For the categorical classification of diastolic dysfunction, we used an age-based partition value for lateral E′ velocity as our primary definition of diastolic dysfunction: lateral E′ velocity < 10 cm/sec was considered diastolic dysfunction. This value was derived in a population-based study,21 was used in a large clinical trial,22 and is also recommended as a partition value in guidelines from the American Society of Echocardiography.23 In a secondary analysis, we defined diastolic dysfunction as (1) increased left atrial volume index (>34 mL/m2) and (2) either abnormal lateral E′ (<10 cm/sec) or septal E′ (<8 cm/sec). We elected not to assign grades of diastolic dysfunction in favor of this method, which is more feasible and more easily reproduced. In separate analyses, we also examined measures of diastolic function, including tissue Doppler velocities and estimated filling pressures, as continuous variables. LV hypertrophy (LVH) was defined on the basis of sex-specific partition values published by the American Society of Echocardiography.18 LV mass index ≥ 45 g/m2.7 was used as the partition value to define LVH in women, and ≥49 g/m2.7 was used as the partition value in men. LVEF < 50% was considered systolic dysfunction.
Statistical Analysis
We used χ2 tests for categorical variables and analysis of variance for continuous variables, as appropriate, to compare baseline characteristics across CVH groups. We then compared year 25 echocardiographic parameters across CVH groups, using c2 tests for categorical parameters and analysis of variance for continuous parameters. We used multivariate-adjusted linear regression analyses to determine the association between CVH group at year 0 and continuous echocardiographic parameters at year 25. Multivariate models were adjusted for age, race, sex, and year 25 education level. Logistic regression modeling was used to determine the association between CVH group and LVH, diastolic dysfunction, and systolic dysfunction at year 25. We focused the multivariate analyses on the dependent variables of LV mass and LVH, systolic function (as represented by ejection fraction), and diastolic function because these measures represent the most clinically important intermediate phenotypes of CVD. The poor CVH group was used as the referent in all models. We performed sensitivity analyses excluding obesity from the CVH score. For the sensitivity analyses, a score of 10 to 12 was considered ideal, 6 to 9 was considered intermediate, and ≤5 was considered poor.
We also analyzed the association between the change in CVH over time with diastolic dysfunction and LVH 25 years later, using a method previously described in CARDIA.24 As above, each individual component was assigned a score of 0, 1, or 2 for poor, intermediate, or ideal CVH status, respectively. We assessed the total CVH score for each participant at year 0 and year 20, which ranged from 0 to 14. The change in CVH was defined as the difference of CVH score between year 0 and year 20. We used year 20 because the diet score was not available at year 25.
We used spline analysis for logistic regression to investigate the relationship between LV diastolic dysfunction (primary definition) and LV mass with the continuous CVH point score. To fit the spline, we attempted to fit linear, quadratic, and cubic curves with one interior knot placed on the median, two interior knots placed on tertiles, and three interiors knots placed on quartiles, respectively. The curves appeared similar, and we chose to present the quartile splines with one interior knot. This model was chosen on the basis of the optimal model fit as determined by the Akaike information criterion. The multivariate-adjusted odds ratios (ORs) for diastolic dysfunction and LVH were plotted against the CVH point score, using a point score of 7 as the referent value. We also calculated the attributable risk for LVH and diastolic dysfunction, which represents the excess risk for these outcomes in participants with poor or intermediate CVH. SAS version 9.3 (SAS Institute, Inc, Cary, North Carolina) was used for all analyses. Two-sided P values < .05 were considered to indicate statistical significance.
Results
Baseline Characteristics
Table 2 shows the year 0 characteristics of the study population stratified by CVH group. The prevalence of ideal, intermediate, and poor CVH at year 0 was 44% (n = 1,224), 47% (n = 1,315), and 9% (n = 264), respectively. As expected, participants with poor CVH had more adverse levels of cardiovascular risk factors compared with those with intermediate and ideal CVH. Black participants constituted a majority of those with poor CVH (78%) and only 28% of those with ideal CVH (P for trend < .001). Participants with ideal CVH had more years of education than those with lower levels of CVH (P for trend < .001). Table 3 shows the year 0 characteristics of the entire cohort, the participants examined at year 25, and the participants included in the study. Table 3 also shows the year 25 characteristics of those available for analysis and those ultimately included and demonstrates that the study cohort consisted of fewer black participants, fewer smokers, and a lower mean BMI than the overall cohort and excluded participants.
Table 2.
Year 0 characteristics by CVH stratum
| CVH point score stratum | ||||
|---|---|---|---|---|
| Covariate | Poor CVH (n = 264) |
Intermediate CVH (n = 1,315) |
Ideal CVH (n = 1,224) |
P |
| Age (y) | 25.8 ± 3.5 | 24.8 ± 3.6 | 25.1 ± 3.6 | <.001 |
| Black race | 205 (78%) | 750 (57%) | 341 (28%) | <.001 |
| Men | 98 (37%) | 578 (44%) | 524 (43%) | 0.13 |
| Education (y) | 14 ± 2 | 15 ± 2 | 16 ± 2 | <.001 |
| Systolic blood pressure (mm Hg) | 115 ± 11 | 111 ± 11 | 107 ± 9 | <.001 |
| Diastolic blood pressure (mm Hg) | 71 ± 11 | 68 ± 10 | 67 ± 8 | <.001 |
| Creatinine (mg/dL) | 1.1 ± 0.9 | 1.0 ± 0.2 | 1.0 ± 0.2 | 0.32 |
| BMI (kg/m2) | 28.8 ± 6.6 | 24.6 ± 4.6 | 22.5 ± 2.5 | <.001 |
| Total cholesterol (mg/dL) | 198 ± 41 | 180 ± 34 | 168 ± 26 | <.001 |
| HDL cholesterol (mg/dL) | 50 ± 15 | 53 ± 13 | 55 ± 12 | <.001 |
| LDL cholesterol (mg/dL) | 130 ± 37 | 113 ± 32 | 101 ± 24 | <.001 |
| Triglycerides (mg/dL) | 93 ± 77 | 71 ± 40 | 62 ± 29 | <.001 |
| Fasting blood glucose (mg/dL) | 86 ± 20 | 82 ± 10 | 81 ± 7 | <.001 |
| Current smoker | 177 (67%) | 461 (35%) | 57 (5%) | <.001 |
| Antihypertensive medication | 26 (10%) | 25 (2%) | 2 (1%) | <.001 |
| Diabetes medication | 12 (5%) | 5 (1%) | 0 (0%) | <.001 |
HDL, High-density lipoprotein; LDL, low-density lipoprotein.
Data are expressed as mean ± SD or as number (percentage) P values refer to the distribution of results for each variable across all three categories of CVH.
Table 3.
Year 0 characteristics of the overall CARDIA cohort, participants eligible for analysis at year 25, and the final study cohort
| Covariate | Entire cohort (n = 5,113) |
All year 25 participants (n = 3,482) |
Study cohort (n = 2,803) |
|---|---|---|---|
| Year 0 baseline characteristics | |||
| Age (y) | 24.8 ± 3.7 | 25.1 ± 3.6 | 25.0 ± 3.6 |
| Sex (% female) | 54.5 (n = 2,785) | 56.6% (n = 1,980) | 57.3% (n = 1,579) |
| Race (% black) | 48.4% (n = 2,637) | 46.9% (n = 1,640) | 46.0% (n = 1,267) |
| Education (y) | 13 ± 2 | 14 ± 2 | 14 ± 2 |
| BMI (kg/m2) | 24.5 ± 5.0 | 24.5 ± 5.0 | 24.0 ± 4.4 |
| SBP (mm Hg) | 110 ± 11 | 110 ± 11 | 110 ± 11 |
| DBP (mm Hg) | 69 ± 10 | 68 ± 9 | 68 ± 9 |
| Total cholesterol (mg/dL) | 177 ± 33 | 177 ± 33 | 177 ± 33 |
| HDL cholesterol (mg/dL) | 53 ± 13 | 53 ± 13 | 53 ± 13 |
| Fasting glucose (mg/dL) | 83 ± 16 | 82 ± 10 | 82 ± 10 |
| Current smoker | 30% (n = 1,544) | 26.7% (n = 927) | 24.7% (n = 679) |
| Year 25 characteristics | |||
| Education (y) | — | 15 ± 3 | 15 ± 3 |
| BMI (kg/m2) | — | 30 ± 7 | 29 ± 7 |
| SBP (mm Hg) | — | 120 ± 16 | 119 ± 16 |
| DBP (mm Hg) | — | 75 ± 11 | 74 ± 11 |
| Total cholesterol (mg/dL) | — | 192 ± 37 | 192 ± 36 |
| HDL cholesterol (mg/dL) | — | 58 ± 18 | 59 ± 18 |
| Fasting glucose (mg/dL) | — | 99 ± 29 | 98 ± 27 |
| Current smoker | — | 17% (n = 589) | 16% (n = 429) |
Echocardiographic Parameters
Table 4 shows echocardiographic characteristics at year 25 stratified by CVH group at year 0. Participants with ideal and intermediate CVH had lower indexed LVEDV and LVESV than those with poor CVH. Participants with ideal and intermediate CVH also had smaller LV internal diastolic diameter. Participants with ideal CVH had significantly lower LV mass index and left atrial volume compared with participants who had poor or intermediate CVH. There was no difference in the mean LVEF across the CVH groups; however, with participants with ideal and intermediate CVH had higher lateral S′ velocity than those with poor CVH. Given the differences observed in mean heart rate and stroke volume, there was a significant difference observed in cardiac index across CVH groups as well.
Table 4.
Echocardiographic parameters by CVH stratum
| CVH point score stratum | ||||
|---|---|---|---|---|
| Covariate | Poor (n = 264) | Intermediate (n = 1,315) | Ideal (n = 1,224) |
P-value for trend |
| LVEDV index (mL/m) | 41 ± 9 | 38 ± 9 | 37 ± 9 | <.001 |
| LVESV (mL/m) | 16 ± 6 | 15 ± 6 | 14 ± 6 | <.001 |
| LVIDd (cm) | 5.2 ± 0.5 | 5.1 ± 0.5 | 5.1 ± 0.5 | <.001 |
| Heart rate (beats/min) | 68 ± 11 | 66 ± 10 | 64 ± 10 | <.001 |
| LV stroke volume (mL) | 93 ± 21 | 88 ± 21 | 86 ± 21 | <.001 |
| Left atrial volume index (mL/m2) | 28 ± 9 | 27 ± 8 | 27 ± 8 | 0.008 |
| Left atrial diameter (cm) | 3.9 ± 0.5 | 3.7 ± 0.5 | 3.6 ± 0.5 | <.001 |
| LV mass index (g/m2.7) | 47 ± 15 | 41 ± 12 | 37 ± 10 | <.001 |
| LVH (N,%) | 111 (44%) | 338 (26%) | 169 (14%) | <.001 |
| Cardiac index (L/min/m2) | 3.3 ± 0.9 | 3.2 ± 0.8 | 3.1 ± 0.8 | <.001 |
| LVEF (%) | 62 ± 8 | 62 ± 7 | 62 ± 7 | 0.97 |
| Systolic lateral S′ (cm/sec) | 8.6 ± 2.0 | 9.2 ± 2.3 | 9.3 ± 2.1 | <.001 |
| Lateral E′ velocity (cm/sec) | 10.9 ± 2.9 | 11.6 ± 2.7 | 12.3 ± 2.8 | <.001 |
| Septal E′ velocity (cm/sec) | 8.6 ± 2.5 | 9.2 ± 2.3 | 9.8 ± 2.4 | <.001 |
| E/E′ ratio | 8.0 ± 3.0 | 7.3 ± 2.4 | 6.6 ± 2.1 | <.001 |
| Mitral E/A ratio | 1.2 ± 0.4 | 1.4 ± 0.4 | 1.3 ± 0.3 | <.001 |
| Mitral deceleration time (msec) | 179 ± 41 | 178 ± 38 | 178 ± 39 | 0.89 |
| Diastolic dysfunction (primary) | 101 (41%) | 338 (26%) | 220 (18%) | <.001 |
| Diastolic dysfunction (secondary) | 36 (14%) | 100 (8%) | 71 (6%) | <.001 |
Data are expressed as mean ± SD or as number (percentage). Primary definition of diastolic dysfunction: lateral E′ < 10 cm/sec. Secondary definition of diastolic dysfunction: left atrial volume index > 34 mL/m2 and either lateral E′ < 10 cm/sec or septal E′ < 8 cm/sec. P values refer to the distribution of results for each variable across all three categories of CVH.
Participants with ideal CVH had higher lateral and septal E′ velocities than those with poor CVH and also had a lower prevalence of LV diastolic dysfunction. The E/E′ ratio was lower among participants with ideal and intermediate CVH. The prevalence of diastolic dysfunction (primary) in the ideal CVH group was 18%; using this value as the base risk, there were 54 “excess” cases of diastolic dysfunction in the intermediate group and 102 excess cases in the poor group. Thus, the risk attributable to not being ideal was 156 out of a total 659 cases (23.6%). The base risk for LVH in the ideal group was 14%; the risk for LVH attributed to not being ideal was 228 out of a total of 618 cases (36.9%).
To determine which specific year 0 components had the strongest association with LVH, we determined the prevalence of LVH at year 25 for each component. As shown in Figure 1, the pattern was largely consistent in that participants with poor levels of CVH metrics had a greater prevalence of LVH. However, the pattern was particularly marked for BMI, fasting glucose, and systolic blood pressure. Among participants with poor BMI, 60.5% had LVH at year 25, compared with only 13.7% of participants with ideal BMI.
Figure 1.

Prevalence of LVH at year 25 by CVH metrics at year 0.
Logistic and Linear Regression Models
Table 5 shows the association between CVH group at year 0 and LV systolic dysfunction, LVH, and diastolic dysfunction at year 25. Participants with ideal and intermediate CVH had similar odds for LV systolic dysfunction (LVEF < 55%) as those with poor CVH. Participants with ideal and intermediate CVH were significantly less likely to have LVH than those with poor CVH. Participants with ideal and intermediate CVH also had substantially lower odds for LV diastolic dysfunction compared with those with poor CVH. The multivariate-adjusted ORs for diastolic dysfunction in participants with ideal and intermediate CVH compared with those with poor CVH were 0.63 (95% CI, 0.46–0.83) and 0.52 (95% CI, 0.37– 0.73), respectively. After additional adjustment for LV mass index, the association between CVH and diastolic dysfunction remained statistically significant for ideal (OR, 0.58; 95% CI, 0.42–0.80) and intermediate CVH (OR, 0.67; 95% CI, 0.57–0.90). With the more restrictive definition of LV diastolic dysfunction, 7.5% (n = 209) of participants had diastolic dysfunction. The magnitude of the association between CVH group and the secondary definition of diastolic dysfunction was similar, although the result was not statistically significant.
Table 5.
Logistic regression models for association of CVH stratum at year 0 with echocardiographic parameters at year 25
| Covariate | Poor CVH (n = 264) |
Intermediate CVH (n = 1,315) |
Ideal CVH (n = 1,224) |
|---|---|---|---|
| LVEF < 50% (n = 92 [3%]) | 1.0 (reference) | 1.01 (0.48–2.15) | 0.72 (0.31–1.67) |
| LVH (n = 618 [22%]) | 1.0 (reference) | 0.55 (0.41–0.75) | 0.35 (0.25–0.49) |
| Diastolic dysfunction (primary; n = 659 [24%]) | 1.0 (reference) | 0.63 (0.46–0.83) | 0.52 (0.37–0.73) |
| Diastolic dysfunction (secondary; n = 207 [7%]) | 1.0 (reference) | 0.66 (0.42–1.03) | 0.69 (0.42–1.12) |
Models adjusted for age, race, sex, and year 25 education. Primary definition of diastolic dysfunction: lateral E′ < 10 cm/sec. Secondary definition of diastolic dysfunction: left atrial volume index > 34 mL/m2 and either lateral E′ < 10 cm/sec or septal E′ < 8 cm/sec.
We observed similar associations when we excluded BMI from the CVH point score (results not shown). Compared with participants with poor CVH, those with ideal and intermediate CVH had multivariate-adjusted ORs for LVH of 0.45 (95% CI, 0.23– 0.86) and 0.48 (95% CI, 0.25–0.91), respectively. Participants with ideal and intermediate CVH had ORs for diastolic dysfunction of 0.45 (95% CI, 0.23–0.85) and 0.52 (95% CI, 0.28–0.99), respectively.
Table 6 shows age-, race-, sex-, and education-adjusted linear regression models for CVH group at year 0 and continuous echocardiographic parameters at year 25. Participants with ideal CVH had a mean LVEDV index that was 3.2 mL/m lower than the mean LVEDV in the poor CVH group (P < .001). The mean LV end-diastolic diameter was lower in those with ideal and intermediate CVH. There was no difference in the mean LVEF, but there was a significant difference in lateral S0 velocity between the ideal and intermediate groups and the poor group. The LV mass index was 5.3 to 8.1 g/m2.7 lower in those with intermediate and ideal CVH, compared with those with poor CVH (P < .001 for both). Participants with ideal CVH had significantly greater lateral and septal E′ velocities compared with those with poor CVH (P < .001 for both). Participants with ideal and intermediate CVH had lower E/E′ ratios, reflecting lower estimates for LV filling pressures compared with those with poor CVH.
Table 6.
Linear regression models for association of CVH stratum at year 0 with echocardiographic parameters at year 25
| Mean difference and SD, compared with poor CVH as reference group | |||
|---|---|---|---|
| Covariate | Poor | Intermediate | Ideal |
| LVEDV | Reference group | −2.5 (−3.7 to −1.3) | −3.2 (−4.5 to −1.9) |
| P < .001 | P < .001 | ||
| LVESV | Reference group | −0.8 (−1.6 to −0.1) | −1.2 (−2.0 to −0.4) |
| P = .03 | P = .003 | ||
| Left atrial volume | Reference group | −0.5 (−1.6 to 0.7) | −0.4 (−1.6 to 0.8) |
| P = .43 | P = .49 | ||
| LVIDd | Reference group | −0.1 (−0.2 to −0.1) | −0.2 (−0.3 to −0.1) |
| P < .001 | P < .001 | ||
| LV mass index | Reference group | −5.6 (−7.2 to −4.0) | −8.0 (−9.7 to −6.3) |
| P < .001 | P < .001 | ||
| Cardiac index | Reference group | −0.08 (−0.2 to 0.3) | −0.2 (−0.3 to −0.03) |
| P = .16 | P = .02 | ||
| Cardiac index | Reference group | −0.03 (−0.14 to 0.08) | −0.12 (−0.23 to 0.001) |
| P = .60 | P = .05 | ||
| LV ejection fraction | Reference group | −0.1 (−1.2 to 0.9) | −0.1 (−1.1 to 1.0) |
| P = .79 | P = .92 | ||
| Lateral systolic S′ velocity | Reference group | 0.3 (0.03 to 0.7) | 0.3 (0.0–0.7) |
| P = .03 | P = .05 | ||
| Lateral E′ velocity | Reference group | 0.3 (−0.1 to 0.7) | 0.6 (0.2 to 1.0) |
| P = .19 | P = .005 | ||
| Septal E′ velocity (cm/sec) | Reference group | 0.3 (−0.1 to 0.6) | 0.5 (0.2 to 0.9) |
| P = .10 | P = .005 | ||
| E/E′ ratio | Reference group | −0.4 (−0.8 to −0.1) | −0.7 (−1.1 to −0.4) |
| P = .01 | P < .001 | ||
Models adjusted for age, race, sex, and year 25 education.
To account for the excluded participants, we conducted a sensitivity analysis in which we included all the participants with adequate measurements of LVEF, diastolic function, and LVH. The results are shown in Table 7 and are similar to that of the primary analyses in Table 5.
Table 7.
Logistic regression models for association of CVH stratum at year 0 with echocardiographic parameters at year 25
| Covariate | N | Poor CVH (n = 264) |
Intermediate CVH (n = 1,315) |
Ideal CVH (n = 1,224) |
|---|---|---|---|---|
| LVEF < 50% (n = 94 [3%]) | 2,976 | 1.0 (reference) | 0.68 (0.36–1.27) | 0.53 (0.27–1.06) |
| LVH (n = 618 [22%]) | 2,879 | 1.0 (reference) | 0.60 (0.45–0.79) | 0.35 (0.26–0.48) |
| Diastolic dysfunction (primary; n = 742 [24%]) | 3,110 | 1.0 (reference) | 0.74 (0.56–0.96) | 0.56 (0.42–0.75) |
| Diastolic dysfunction (secondary; n = 234 [8%]) | 3,110 | 1.0 (reference) | 0.70 (0.47–1.05) | 0.71 (0.46–1.10) |
Models adjusted for age, race, sex, and year 25 education. N = number of participants with that measurement at year 25. Primary definition of diastolic dysfunction: lateral E′ < 10 cm/sec. Secondary definition of diastolic dysfunction: left atrial volume index > 34 mL/m2 and either lateral E′ < 10 cm/sec or septal E′ < 8 cm/sec.
Figure 2A shows the cubic spline regression model and 95% CIs for the association between the continuous CVH point score and LVH. Using a reference point of a CVH score of 7, the multivariate-adjusted ORs for having LVH were significantly greater than 1.0 for all CVH point scores <7. Participants with CVH scores > 7 at year 0 were less likely to have LVH. We observed similar results for the cubic spline model for the association between CVH point score and LV diastolic dysfunction (Figure 2B). Figures 3A and 3B show that overall for each increment of any one greater ideal health factor or behavior, there was a lower risk for LVH and diastolic dysfunction. The gradient of association appeared stronger for health behaviors than for health factors, although this classification may undervalue the continuous associations between LVH or diastolic function and measures such as blood pressure or BMI.
Figure 2.

(A) Cubic spline for association between continuous CVH score and odds of LVH. (B) Cubic spline for association between continuous CVH score and odds of LV diastolic dysfunction.
Figure 3.
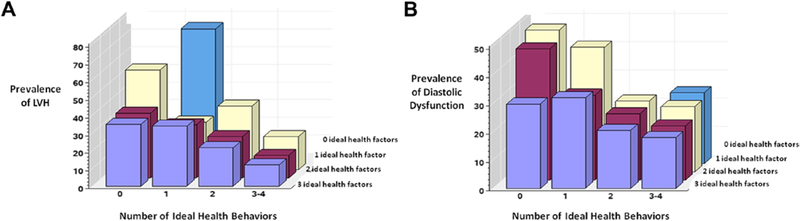
(A) Prevalence of LVH at year 25 by number of ideal health factors and behaviors at year 0. (B) Prevalence of LV diastolic dysfunction at year 25 by number of ideal health factors and behaviors at year 0.
Change in CVH over Time
For every 1-point increase in CVH from year 0 to year 20 and with adjustment for the year 0 CVH score, age, race, sex, and education, we observed 22% reduced odds for LVH at year 25 (OR, 0.78; 95% CI, 0.73–0.83). We also observed 16% reduced odds for diastolic dysfunction with every 1-point increase in CVH from year 0 to year 20 (OR, 0.84; 95% CI, 0.79–0.88).
Discussion
Findings
We observed that ideal and intermediate CVH in young adulthood is associated with more favorable LV structure and function 25 years later, compared with poor CVH. Greater CVH was associated with lower LV mass index and significantly lower odds for LVH and with lower odds for diastolic dysfunction. We did not observe an association between ideal CVH and global LV systolic function as measured by the ejection fraction; however, we did observe a significant association between ideal CVH and the tissue Doppler S′ velocity. The spline analysis showed a generally monotonically decreasing association between CVH point score and LVH or diastolic dysfunction. For every 1-point improvement in CVH over 20 years, we observed a 16% reduction in risk for diastolic dysfunction and a 22% risk reduction for LVH.
Implications
Previous observational studies have reported that ventricular dysfunctionprecedes clinical heart failure in nearly all cases.5 Thus, optimization of health factors and behaviors associated with ventricular structure and function may represent an important target for heart failure prevention. To the best of our knowledge, our study is the first to describe the association between CVH in young adulthood and LV structure, systolic function, and diastolic function later in life. In a previous CARDIA analysis, we observed that adults aged 23 to 35 years with severe diastolic dysfunction had fourfold greater incidence of CVD and all-cause mortality compared with individuals with normal diastolic function.7 In Olmsted County, Minnesota, Redfield et al.5 reported that individuals aged 45 years and older with asymptomatic LV diastolic dysfunction are at three- to eightfold increased risk for all-cause mortality. We did not observe an association between CVH group and global systolic function measured by LVEF. However, we did observe that systolic S′ was abnormal among participants with poor CVH.
We observed that CARDIA participants with ideal and intermediate CVH had LV mass index values 5 to 8 g/m2.7 (10%–16%) lower than participants with poor CVH. An analysis from the Multi-Ethnic Study of Atherosclerosis found that over a median follow-up period of 4 years, a 10% increase in LV mass was associated with 20% increased risk for stroke and 40% increased risk for heart failure.25 Furthermore, the vast majority of heart failure events occurred in individuals who had LVH at baseline. Our study indicates that ideal and even intermediate CVH in young adulthood is associated with substantially reduced risk for structural heart disease in middle age. Furthermore, individuals who improve their CVH over time also have a lower risk for developing LVH and diastolic dysfunction later in life, even when adjusting for the baseline CVH. This indicates that patients with poor lifestyle and health factors in young adulthood may not be destined to have adverse LV remodeling later in life and provides a positive message for clinicians encouraging patients in lifestyle improvement.
Previous studies have reported that the ideal CVH profile described by the AHA is associated with a lower burden of subclinical atherosclerosis and incident CVD.2, 3 In adults aged 45 to 64 years, Folsom et al.2, 3 demonstrated that individuals with all seven CVH metrics at ideal levels (i.e., a CVH point score of 14) had an incident CVD event rate of 3.9 per 1,000 person-years, and participants with zero ideal metrics had an event rate of 37.1 per 1,000 person-years. Our study adds to the growing body of literature indicating that health factors and behaviors in young adulthood have major implications for health and disease later in life and extends these observations to measures of cardiac structure and function that are important precursors of clinical cardiovascular events.
The cross-sectional associations of individual health factors with LV structure and function have been previously described in CARDIA.20, 26 In the present analysis, we sought to examine the spectrum of CVH involving all seven metrics as our primary objective. However, we did assess the association of each individual health factor and behavior with LVH (Figure 1) separately and found a largely consistent pattern across all metrics, although the association was most pronounced for BMI, systolic blood pressure, and blood glucose. Because measures of LV structure scale with body size, we adjusted LV volumes for height. In addition to being an independent risk factor, BMI also contributes to adverse LV remodeling through its effect on other risk factors.27 We conducted additional analyses after removing BMI from the CVH score, and we observed that the associations were similar to the primary analysis.
Our study had several limitations. One limitation is that we included 2,803 participants from the original 5,115 CARDIA participants (55%). Among the original cohort, 3,499 participants were available for analysis at year 25 (68%). Compared with the excluded participants, the study sample contained fewer black participants, fewer smokers, and a greater mean BMI. Given the modest but significant differences between our study sample and the CARDIA participants who did not attend year 25, or who attended year 25 but did not have adequate echocardiographic data, our results may represent somewhat of an underestimate of the association between CVH and echocardiographic measures of LV structure and function. To avoid overestimating the effect of CVH on echocardiographic outcomes, we excluded participants who experienced cardiovascular events during the follow-up period. Participants with interim events, such as myocardial infarctions, that occurred before year 25 would have greater adverse changes in their LV structure and function. This represented a relatively small number of participants and would be expected to bias our findings toward the null. Another limitation is that our definition of diastolic dysfunction was not graded by severity. Although we adjusted for age, race, sex, and socioeconomic status, residual confounding may still have influenced our results. We classified the health factors (blood pressure, glucose, and cholesterol) as categorical variables according to the AHA 2020 classification, and continuous representation of these variables may provide additional information.
Conclusions
We observed that participants with greater levels of CVH in young adulthood have more favorable LV structure and function 25 years later, including lower LV mass and LVEDV. Ideal and intermediate CVH was associated with substantially lower risk for LVH and diastolic dysfunction compared with poor CVH.
Acknowledgments
This report has been reviewed by CARDIA for scientific content and consistency of data interpretation with previous CARDIA publications. The authors thank the participants and the staff of the CARDIA study.
The Coronary Artery Risk Development in Young Adults study was conducted and supported by the National Heart, Lung, and Blood Institute in collaboration with the University of Alabama at Birmingham (grants N01-HC95095 and N01-HC48047), the University of Minnesota (grant N01-HC48048), Northwestern University (grant N01-HC48049), and the Kaiser Foundation Research Institute (grant N01-HC48050). Dr Desai was supported by National Institutes of Health grant T32 HL 69771-8.
Abbreviations:
- AHA
American Heart Association
- BMI
Body mass index
- CARDIA
Coronary Artery Risk Development in Young Adults
- CVD
Cardiovascular disease
- CVH
Cardiovascular health
- IVST
Interventricular septal thickness
- LV
Left ventricular
- LVEDV
Left ventricular end-diastolic volume
- LVEF
Left ventricular ejection fraction
- LVESV
Left ventricular end-systolic volume
- LVH
Left ventricular hypertrophy
- LVIDd
Left ventricular internal diameter in diastole
- LVPWT
Left ventricular posterior wall thickness
- OR
Odds ratio
Contributor Information
Chintan S. Desai, Division of Cardiology, Johns Hopkins Hospital, Baltimore, Maryland.
Hongyan Ning, Department of Preventive Medicine, Northwestern University Feinberg School of Medicine, Chicago, Illinois.
Kiang Liu, Department of Preventive Medicine, Northwestern University Feinberg School of Medicine, Chicago, Illinois.
Jared P. Reis, National Heart, Lung, and Blood Institute, Bethesda, Maryland.
Samuel S. Gidding, Thomas Jefferson Medical Center, Philadelphia, Pennsylvania.
Anderson Armstrong, Division of Cardiology, Johns Hopkins Hospital, Baltimore, Maryland.
Joao A. C. Lima, Division of Cardiology, Johns Hopkins Hospital, Baltimore, Maryland.
Donald M. Lloyd-Jones, Department of Preventive Medicine, Northwestern University Feinberg School of Medicine, Chicago, Illinois.
References
- 1.Lloyd-Jones DM, Hong Y, Labarthe D, Mozaffarian D, Appel LJ, Van Horn L, et al. Defining and setting national goals for cardiovascular health promotion and disease reduction: the American Heart Association’s strategic impact goal through 2020 and beyond. Circulation 2010;121: 586–613. [DOI] [PubMed] [Google Scholar]
- 2.Folsom AR, Yatsuya H, Nettleton JA, Lutsey PL, Cushman M, Rosamond WD. Community prevalence of ideal cardiovascular health, by the American Heart Association definition, and relationship with cardiovascular disease incidence. J Am Coll Cardiol 2011;57: 1690–6. [DOI] [PMC free article] [PubMed] [Google Scholar]
- 3.Laitinen TT, Pahkala K, Magnussen CG, Viikari JS, Oikonen M, Taittonen L, et al. Ideal cardiovascular health in childhood and cardiometabolic outcomes in adulthood: the Cardiovascular Risk in Young Finns Study. Circulation 2012;125:1971–8. [DOI] [PubMed] [Google Scholar]
- 4.Rasmussen-Torvik LJ, Shay CM, Abramson JG, Friedrich CA, Nettleton JA, Prizment AE, et al. Ideal cardiovascular health is inversely associated with incident cancer: the Atherosclerosis Risk in Communities study. Circulation 2013;127:1270–5. [DOI] [PMC free article] [PubMed] [Google Scholar]
- 5.Redfield MM, Jacobsen SJ, Burnett JC Jr., Mahoney DW, Bailey KR, Rodeheffer RJ. Burden of systolic and diastolic ventricular dysfunction in the community: appreciating the scope of the heart failure epidemic. JAMA 2003;289:194–202. [DOI] [PubMed] [Google Scholar]
- 6.Levy D, Garrison RJ, Savage DD, Kannel WB, Castelli WP. Prognostic implications of echocardiographically determined left ventricular mass in the Framingham Heart Study. N Engl J Med 1990;322:1561–6. [DOI] [PubMed] [Google Scholar]
- 7.Desai CS, Colangelo LA, Liu K, Jacobs DR Jr., Cook NL, Lloyd-Jones DM, et al. Prevalence, prospective risk markers, and prognosis associated with the presence of left ventricular diastolic dysfunction in young adults: the Coronary Artery Risk Development in Young Adults study. Am J Epidemiol 2013;177:20–32. [DOI] [PMC free article] [PubMed] [Google Scholar]
- 8.Cutter GR, Burke GL, Dyer AR, Friedman GD, Hilner JE, Hughes GH, et al. Cardiovascular risk factors in young adults. The CARDIA baseline monograph. Control Clin Trials 1991;12:1S-77. [DOI] [PubMed] [Google Scholar]
- 9.Friedman GD, Cutter GR, Donahue RP, Hughes GH, Hulley SB, Jacobs DR Jr, et al. CARDIA: study design, recruitment, and some characteristics of the examined subjects. J Clin Epidemiol 1988;41:1105–16. [DOI] [PubMed] [Google Scholar]
- 10.Warnick GR. Enzymatic methods for quantification of lipoprotein lipids. Methods Enzymol 1986;129:101–23. [DOI] [PubMed] [Google Scholar]
- 11.Wagenknecht LE, Cutter GR, Haley NJ, Sidney S, Manolio TA, Hughes GH, et al. Racial differences in serum cotinine levels among smokers in the Coronary Artery Risk Development in Young Adults study. Am J Public Health 1990;80:1053–6. [DOI] [PMC free article] [PubMed] [Google Scholar]
- 12.Liu K, Slattery M, Jacobs D Jr., Cutter G, McDonald A, Van Horn L, et al. A study of the reliability and comparative validity of the CARDIA dietary history. Ethn Dis 1994;4:15–27. [PubMed] [Google Scholar]
- 13.Parker ED, Schmitz KH, Jacobs DR Jr., Dengel DR, Schreiner PJ. Physical activity in young adults and incident hypertension over 15 years of follow-up: the CARDIA study. Am J Public Health 2007;97:703–9. [DOI] [PMC free article] [PubMed] [Google Scholar]
- 14.Liu K, Daviglus ML, Loria CM, Colangelo LA, Spring B, Moller AC, et al. Healthy lifestyle through young adulthood and the presence of low cardiovascular disease risk profile in middle age: The Coronary Artery Risk Development in Young Adults (CARDIA) study. Circulation 2012;125:996–1004. [DOI] [PMC free article] [PubMed] [Google Scholar]
- 15.The recommended quantity and quality of exercise for developing and maintaining cardiorespiratory and muscular fitness in healthy adults. Position stand of the American College of Sports Medicine. Schweizerische Zeitschrift fur Sportmedizin 1993;41:127–37. [PubMed] [Google Scholar]
- 16.Bhupathiraju SN, Tucker KL. Coronary heart disease prevention: Nutrients, foods, and dietary patterns. Clin Chim Acta 2011;412:1493–514. [DOI] [PMC free article] [PubMed] [Google Scholar]
- 17.Huffman MD, Capewell S, Ning H, Shay CM, Ford ES, Lloyd-Jones DM. Cardiovascular health behavior and health factor changes (1988–2008) and projections to 2020: Results from the National Health and Nutrition Examination Surveys. Circulation 2012;125:2595–602. [DOI] [PMC free article] [PubMed] [Google Scholar]
- 18.Lang RM, Bierig M, Devereux RB, Flachskampf FA, Foster E, Pellikka PA, et al. Recommendations for chamber quantification: a report from the American Society of Echocardiography’s Guidelines and Standards Committee and the Chamber Quantification Writing Group, developed in conjunction with the European Association of Echocardiography, a branch of the European Society of Cardiology. J Am Soc Echocardiogr 2005;18: 1440–63. [DOI] [PubMed] [Google Scholar]
- 19.Gardin JM, Wong ND, Bommer W, Klopfenstein HS, Smith VE, Tabatznik B, et al. Echocardiographic design of a multicenter investigation of free-living elderly subjects: The Cardiovascular Health Study. J Am Soc Echocardiogr 1992;5:63–72. [DOI] [PubMed] [Google Scholar]
- 20.Gardin JM, Wagenknecht LE, Anton-Culver H, Flack J, Gidding S, Kurosaki T, et al. Relationship of cardiovascular risk factors to echocardiographic left ventricular mass in healthy young black and white adult men and women. The CARDIA study. Circulation 1995;92:380–7. [DOI] [PubMed] [Google Scholar]
- 21.Henein M, Lindqvist P, Francis D, Morner S, Waldenstrom A, Kazzam E. Tissue Doppler analysis of age-dependency in diastolic ventricular behaviour and filling: a cross-sectional study of healthy hearts (the Umea General Population Heart Study). Eur Heart J 2002;23:162–71. [DOI] [PubMed] [Google Scholar]
- 22.Solomon SD, Janardhanan R, Verma A, Bourgoun M, Daley WL, Purkayastha D, et al. Effect of angiotensin receptor blockade and antihypertensive drugs on diastolic function in patients with hypertension and diastolic dysfunction: a randomised trial. Lancet 2007;369:2079–87. [DOI] [PubMed] [Google Scholar]
- 23.Nagueh SF, Appleton CP, Gillebert TC, Marino PN, Oh JK, Smiseth OA, et al. Recommendations for the evaluation of left ventricular diastolic function by echocardiography. J Am Soc Echocardiogr 2009;22:107–33. [DOI] [PubMed] [Google Scholar]
- 24.Reis JP, Loria CM, Launer LJ, Sidney S, Liu K, Jacobs DR Jr, et al. Cardiovascular health through young adulthood and cognitive functioning in midlife. Ann Neurol 2013;73:170–9. [DOI] [PMC free article] [PubMed] [Google Scholar]
- 25.Bluemke DA, Kronmal RA, Lima JA, Liu K, Olson J, Burke GL, et al. The relationship of left ventricular mass and geometry to incident cardiovascular events: the MESA (Multi-Ethnic Study of Atherosclerosis) study. J Am Coll Cardiol 2008;52:2148–55. [DOI] [PMC free article] [PubMed] [Google Scholar]
- 26.Xie X, Gidding SS, Gardin JM, Bild DE, Wong ND, Liu K. Left ventricular diastolic function in young adults: the Coronary Artery Risk Development in Young Adults study. J Am Soc Echocardiogr 1995;8:771–9. [DOI] [PubMed] [Google Scholar]
- 27.Gidding SS, Liu K, Colangelo LA, Cook NL, Goff DC, Glasser SP, et al. Longitudinal determinants of left ventricular mass and geometry: the Coronary Artery Risk Development in Young Adults (CARDIA) study. Circ Cardiovasc Imaging 2013;6:769–75. [DOI] [PMC free article] [PubMed] [Google Scholar]