

Abstract
Cortical spreading depression (CSD) is a propagating event of neuronal depolarization, which is considered as the cellular correlate of the migraine aura. It is characterized by a change in the intrinsic optical signal and by a negative DC potential shift. Microglia are the resident macrophages of the CNS and act as sensors for pathological changes. In the present study, we analyzed whether microglial cells might sense CSD by recording membrane currents from microglia in acutely isolated cortical mouse brain slices during an experimentally induced CSD. Coincident with the change in the intrinsic optical signal and the negative DC potential shift we recorded an increase in potassium conductance predominantly mediated by K+ inward rectifier (Kir)2.1, which was blocked by the NMDA receptor antagonist D-AP5. Application of NMDA and an increase in extracellular K+ mimics the CSD-induced Kir activation. Application of D-AP5, but not the purinergic receptor antagonist RB2, blocks the NMDA-induced Kir activation. The K+ channel blocker Ba2+ blocks both the CSD- and the NMDA-triggered increase in Kir channel activity. In addition, we could confirm previous findings that microglia in the adult brain do not express functional NMDA receptors by recording from microglia cultured from adult brain. From these observations we conclude that CSD activates neuronal NMDA receptors, which lead to an increase in extracellular [K+] resulting in the activation of Kir channel activity in microglia.
SIGNIFICANCE STATEMENT Cortical spreading depression (CSD) is a wave of neuronal depolarization spreading through the cortex and is associated with the aura of migraine. Here we show that microglial cells, which are viewed as pathologic sensors of the brain, can sense this wave. The increase in the extracellular potassium concentration associated with that wave leads to the activation of an inward rectifying potassium conductance in microglia. The involvement of neuronal NMDA receptors is crucial because NMDA mimics that response and microglia do not express functional NMDA receptors. Although it is now evident that CSD leads to a signal in microglia, the consequences of this microglial activation during CSD needs to be explored.
Keywords: microglia, NMDA receptor, potassium channels, spreading depression
Introduction
Microglial cells are the immunocompetent cells of the CNS. They are characterized by a distinct ramified morphology with small cell bodies and branched processes which constantly scan the environment and contact surrounding neurons (Nimmerjahn et al., 2005; Kettenmann et al., 2011). In the pathologic brain microglia undergo a rapid transformation acquiring an amoeboid morphology, and can, depending on the state of activation, release cytokines, phagocytose, proliferate, or migrate (Hanisch and Kettenmann, 2007). In excitotoxic pathologies, such as epilepsy, microglia are also activated due to increased neuronal activity (Avignone et al., 2015). Another event involving temporally increased neuronal activity followed by decreased activity is known as cortical spreading depression (CSD), discovered in 1944 (Leão, 1944). It is characterized by a slowly propagating (3–4 mm/min) wave of neuronal and glial depolarization followed by a period of neuronal depression. It is considered to be the cellular counterpart of migraine aura (Lauritzen, 1992). Hallmarks of these depolarizing waves are neuronal swelling, a negative DC potential shift, elevation of extracellular potassium and glutamate leading to disturbed ion homeostasis (Dreier, 2011). Propagation of CSD requires NMDA receptor activation and can be blocked by NMDA receptor antagonists (Marrannes et al., 1988; Lauritzen and Hansen, 1992). Whether microglial cells sense the state of neuronal activity in pathologies like CSD is not known. Microglia express neurotransmitter receptors, such as AMPA and metabotropic glutamate receptors, which might be means to sense excitotoxicity (Kettenmann et al., 2011). Although the expression of functional NMDA receptors has been described for cultured neonatal microglial cells (Kaindl et al., 2012; Murugan et al., 2011), their presence in situ could not be confirmed (Dissing-Olesen et al., 2014; Eyo et al., 2014). In the present study, we tested the influence of CSD on microglial membrane conductance in acute mouse brain slices. Our results indicate that microglia can sense NMDA receptor-dependent potassium elevations during CSD by an increase in potassium inward rectifier activity and we confirm the lack of functional NMDA receptor expression in microglia.
Materials and Methods
Solutions.
For experiments in cell culture, a standard HEPES buffer was used containing the following (in mm): 150 NaCl, 5.4 KCl, 1 MgCl2, 2 CaCl2, 10 HEPES, and 10 glucose adjusted to pH 7.4 with NaOH. As extracellular solution and for preparation of brain slices the following artificial CSF (ACSF) was used (in mm): 134 NaCl, 2.5 KCl, 1.3 MgCl2, 2 CaCl2, 1.25 K2HPO4, 26 NaHCO3, 10 d-glucose, pH 7.4, with osmolarity of 310–320 mOsm/L and gassed with 95% O2/5% CO2. For electrophysiological recordings, the following intracellular solution was used (in mm): 130 NaCl, 2 MgCl2, 0.5 CaCl2, 2 Na-ATP, 5 EGTA, 10 HEPES, and 0.01 sulforhodamine 101 (Sigma-Aldrich) with an osmolarity of 280–290 mOsm/L adjusted to pH 7.3 with KOH. The following substances were added into the HEPES buffer or ACSF for pharmacological approaches (in mm): 1 ATP (Sigma-Aldrich), 1 BaCl2 (Sigma-Aldrich), 0.01 CNQX (Tocris Bioscience), 0.05 D-AP5 (Abcam), 0.1 glibenclamide (Tocris Bioscience), 0.1 NMDA (Tocris Bioscience), 0.1 Nortriptyline (Sigma-Aldrich), 0.02 ML133 (Sigma-Aldrich), 0.1 Reactive Blue 2 (Tocris Bioscience), Tertiapin-Q 0.2 × 10⁻³ (Tocris Bioscience), and 0.01 VU590 (Sigma-Aldrich). Changed magnesium or potassium concentrations were substituted with equimolar NaCl.
Animals.
All mice used for the present study were on a C57BL/6 genetic background of both sexes. For preparation of cultured cells wild-type animals were used whereas mice for electrophysiological recordings contained a Csf1r-EGFP tag (MacGreen) (Sasmono and Williams, 2012). For acute brain-slice preparation, mice were used at an age of P42–P63. Animals were kept according to the German law for animal protection under a 12 h dark/light cycle with food and water supply ad libitum.
Neonatal microglia cell culture.
Neonatal primary microglia cultures were obtained from cerebral cortex and midbrain using P0–P3 mice (Giulian and Baker, 1986). Microglia were seeded with 3–5 × 10⁵ cells on glass coverslips.
Adult microglia cell culture.
Primary adult microglia cultures were prepared as described before using P49–P56 mice (Scheffel et al., 2012). In short, the cerebellum and olfactory bulb were removed and the cerebrum was freed of blood vessels and meninges and stored in HBSS. Subsequently the tissue was chopped down to 1 mm3 pieces and trypsinized in 1% trypsin and 0.05% deoxyribonuclease for 5 min at room temperature. Using a fire-polished pipette the tissue was dissociated and washed twice in HBBS. Cell suspension was plated on a confluent monolayer of neonatal astrocytes in 75 cm2 flasks. Clodronate (200 μg/ml) was used to remove neonatal microglial cells before adding the adult cell suspension. DMEM was used to culture the mixed glial cells and medium was changed in a daily routine. After 7 d, 33% L929-conditioned medium was added and after another 7 d microglial cells were shaken off for experiments. Cell suspension was transferred on coverslips in a single droplet containing 5–10 × 105 cells. Coverslips were used for calcium imaging and patch-clamp recordings 1 d after plating.
Preparation of acute mouse brain slices.
Acute mouse brain slices were prepared as described previously (Boucsein et al., 2003). Briefly, mice were killed via dislocation of the vertebra. The brain was removed and placed in ice-cold ACSF adjusted to a pH of 7.4. Using a microtome, 250- to 350-μm-thick coronal brain slices were made and kept in gassed ACSF at room temperature. Experiments were done within a maximum of 5 h.
Electrophysiological recordings.
The whole-cell patch-clamp technique was used to study membrane currents of microglia in situ and in vitro. Brain slices and coverslips were superfused at 3–6 ml/min with ACSF or HEPES buffer at room temperature. Pipettes were pulled from borosilicate glasses with a resistance of 4–6 MΩ. After establishing the whole-cell recording configuration, only cells with a series resistance <65 MΩ were used. A series of depolarizing and hyperpolarizing 100 ms pulses were applied ranging from −140 to 60 mV with 20 mV increment from a holding potential of −20 mV in voltage-clamp mode. This protocol was repeated every 5 s to allow continuous monitoring of microglial membrane currents and current–voltage relationships. For illustration, the traces were filtered with a 5–8 Hz low-pass Bessel filter. For field potential recordings, glass pipettes with a resistance of ∼1 MΩ were placed at 20–50 μm depth in the slice. All recordings were done with conventional patch-clamp amplifiers (EPC9/EPC10, HEKA).
Calcium imaging.
Primary cultured microglia were incubated with Fluo-4/AM (5 μm Fluo-4/AM, 0.1% DMSO, 0.02% w/v pluronic F-127) in HEPES buffer for 40 min. Before recording, cells were washed 10–15 min in HEPES buffer. Fluorescence signals were recorded at excitation and emission wavelengths of 488 and 510 nm, respectively, using a conventional polychromator (LPS-150, Till Photonics) and a camera (Sensicam, Photonics) attached to the microscope using water emerged 20× objectives (Olympus). During recording, cells were superfused with HEPES (3–4 ml/min) buffer. Images were taken with a frequency of 2 frames/min and an exposure time of 50 ms.
Recording of intrinsic optical signals.
The intrinsic optical signal (IOS) was measured as light transmission via a camera attached to the microscope. Images were taken once per second. For analysis of ΔIOS we averaged the first 30 images of baseline recordings and subtracted them from all other images. We therefore normalized the IOS to illustrate changes in transmitted light in the recorded brain slices.
Induction of cortical spreading depression.
To induce cortical spreading depression in brain slices we placed an injection pipette (4–6 MΩ resistance) into the slice (20–50 μm deep) in layer 2–3 of the cortex and KCl was ejected in 3–5 pulses (100 ms, 40 psi) from micropipette containing 3M KCl. Field and patch electrodes were placed at least 350 μm apart to avoid diffusion artifacts.
Statistical analysis.
We used student's t test to perform statistical analysis to compare the means of two groups. Significance was defined as *p < 0.05, **p < 0.01, ***p < 0.001. Error bars are given as the SEM. For identification of significant outliers, we used Grubb's outlier test.
Results
Microglial membrane currents evoked by cortical spreading depression
We used a classical experimental paradigm to initiate cortical spreading depression in layer 2–3 of the cortex by ejecting five pulses (100 ms) of 3M KCl solution from a micropipette (Peters et al., 2003). Simultaneously we recorded membrane currents from a microglial cell and the local field potential at least 500 μm away from the ejection electrode. The membrane potential of the microglial cell was clamped from −20 mV to a series of depolarizing and hyperpolarizing values ranging from −140 to 60 mV with 20 mV increment and 100 ms duration to obtain current–voltage curves with a frequency of 5 s (Fig. 1A shows stimulation protocol). Simultaneously we recorded the IOS with an 4× objective (Olympus) in a 100 μm2 area around the patch-pipette and field electrode (Fig. 1A, top left). The ejection of potassium from the pipette triggered an IOS propagating with 46.6 ± 5.6 μm/s (n = 7; Fig. 1A, 1–4). When IOS reached the field potential electrode, we recorded a negative DC potential shift. Simultaneously we recorded an inward rectifying increase in membrane conductance in the microglial cell (Fig. 1A, top right). The current activated rapidly and showed a voltage-dependent inactivation increasing with hyperpolarization (Fig. 1B, top). Inward membrane current density increased by 2.5 ± 0.3 pA/pF at −140 mV membrane potential, but only 0.3 ± 0.1 pA/pF at 60 mV (n = 14). The reversal potential was at −11.6 ± 8.6 mV (n = 13; Fig. 1B, bottom). In Figure 1C, ΔIOS images are given to four different time points of the recordings to illustrate the propagation of the spreading depression. Microglial membrane currents and negative DC potential shifts returned to baseline within a few minutes, whereas the IOS increase did not recover that quickly consistent with earlier reports (Peters et al., 2003; Zhou et al., 2013). Changes in the IOS are most likely due to cellular volume changes (Witte et al., 2001) and might need longer to recover compared with shifted ion concentrations leading to DC potential shifts and microglial membrane currents.
Figure 1.

Cortical spreading depression induced by ejection of 3M KCl from a micropipette results in inward rectifying membrane currents in microglial cells. A, The positions of patch pipette, field electrode and potassium ejection pipette are shown on the left. The region where the IOS was recorded is indicated by the square. Microglial membrane currents are shown in the upper part as a response to a series of 100 ms long depolarizing and hyperpolarizing voltage steps ranging from −140 to 60 mV with 20 mV increment from a holding potential of −20 mV. This pattern was continuously applied every 5 s. Stimulation protocol and current responses at baseline (BL) and at the peak (4) are shown on the left side. Simultaneously the DC field potential (black trace) and changes in IOS (gray trace) are shown at the lower right. Dashed lines and numbers indicate the time points corresponding to the images shown in C. The time point of potassium ejection is marked by an arrow. B, Membrane currents induced by cortical spreading depression were obtained by subtracting the currents at the peak of the response (4) from currents recorded before CSD was elicited (BL). The resulting current–voltage relationship is shown below. The reversal potential was at ∼−30 mV. C, The ΔIOS after induction of CSD is shown at different time points (1–4). Scale bars, 200 μm.
Potassium application mimics the CSD-evoked currents
CSD is known to be accompanied by an increase in [K+]o and the inward rectifying membrane currents of neonatal amoeboid microglia were increased by [K+]o elevation (Cheung et al., 2009). We tested the effect of defined elevation in [K+]o (10, 25, and 50 mm) on membrane currents of microglia in the adult cortex. Potassium mimicked the spreading depression induced inward rectifying currents (Fig. 2A). The kinetics of the currents induced by elevation in [K+]o were similar as described above for CSD-induced currents (Fig. 2B; for 50 mm [K+]o). An increase to 10 mm [K+]o augmented inward membrane current density at −140 mV by 1 ± 0.1 pA/pF (n = 5), an increase to 25 mm by 2.3 ± 0.4 pA/pF (n = 15) and an increase to 50 mm by 5.7 ± 1.4 pA/pF (n = 6), whereas spreading depression led to an increase by 2.5 ± 0.3 pA/pF (n = 14) as shown above (Fig. 2C). We therefore assume that an elevation of ∼25 mm potassium occurred during CSD, which is consistent with reported potassium concentrations (∼30 mm) in the literature (Hablitz and Heinemann, 1989; Petzold et al., 2005). Both potassium (data not shown) and spreading depression-induced inward currents were blocked in the presence of 1 mm barium indicating that both currents were due to K+ inward rectifier (Kir) activation. A detailed analysis on the effect of barium on microglial membrane properties and CSD-induced currents in microglia is described in the following. We therefore hypothesize that cortical spreading depression induces an increase in [K+]o, which results in changes of microglial membrane currents.
Figure 2.

Increase in extracellular [K+] elicits similar membrane currents as CSD. A, Similar as described in the legend to Figure 1 we recorded membrane currents at a series of depolarizing and hyperpolarizing membrane potential jumps during an increase of [K+]o from 5 to 10 mm (top trace) and 50 mm (bottom trace). K+-induced currents in microglia. B, Membrane current kinetics induced by an increase of [K+]o to 50 mm were obtained by subtracting currents in the presence of 50 mm [K+] from currents recorded at normal [K+]o. C, Current–voltage relationships of subtracted currents are shown for 10, 25, and 50 mm K+ applications together with the average current response to CSD. Error bars are given as the standard error of the mean.
CSD and CSD-induced microglial membrane currents are NMDA receptor dependent
The NMDA receptor is known to be crucial in the propagation of CSD (Lauritzen et al., 1988; Marrannes et al., 1988; Nellgård and Wieloch, 1992). We therefore investigated the influence of the NMDA receptor antagonist D-AP5 on the spreading depression induced DC potential shift and the microglial membrane currents (Fig. 3A). Spreading depression was induced three times with a washout time of 12 min (n = 7) or 20 min (n = 2), first as a control, and then in the presence of 50 μm D-AP5 and then again after washout. The distance between the ejection pipette and the patch-and-field pipette was at least 350 μm. The microglial inward current density at −140 mV membrane potential was decreased in the presence of D-AP5 from the control value of 3 ± 0.5–0.65 ± 0.2 pA/pF (n = 9, ***p = 0.0007; Fig. 3B, top) whereas the negative DC potential shift was inhibited from −4.4 ± −0.7 to −0.5 ± 0.1 mV (n = 9, ***p = 0.0001; Fig. 3B, bottom). To analyze the recovery after D-AP5 application we normalized the measured amplitudes (DC potential shift and microglial current responses at −140 mV) of the second and third induced CSD to the first one. Microglial membrane currents decreased to 21.7 ± 4.8% and recovered to 40.6 ± 5.6% (n = 9, *p = 0.024), whereas the DC potential shifts decreased to 14 ± 5.2% and recovered to 47.3 ± 10.9% (n = 9, *p = 0.014). We conclude that cortical spreading depression and the resulting potassium currents in microglial cells depend on NMDA receptors activity.
Figure 3.

CSD and induced microglial currents are inhibited by D-AP5. A, Microglial membrane currents (top traces) and DC potential (bottom traces) were recorded as described in the legend to Figure 1, before (left), during (middle), and after (right) a 2 min application of 50 μm D-AP5. Arrows indicate the time points of potassium ejections for triggering CSD. B, Averaged current–voltage relationships of the membrane currents (peak response minus baseline) induced by CSD are shown for each of the three recordings shown in A. Bottom, The change in DC potential shifts are shown for each experiment for all three applications. Error bars are given as the standard error of the mean.
CSD-induced microglial membrane currents are modulated by CNQX
Even though AMPA/kainate receptors play a minor role in spreading depression (Lauritzen and Hansen, 1992; Nellgård and Wieloch, 1992), we investigated whether blockade of AMPA/kainate receptors influence CSD and CSD-induced membrane currents. We recorded membrane currents from microglial cells, measured the DC potential, and induced CSD. The AMPA/kainate receptor antagonist CNQX (10 μm) was applied 2 min prior CSD induction and wash-in was stopped 30 s afterward. We compared DC potential shifts (−5.1 ± 0.4 to −4.4 ± 0.7 mV, n = 10 vs 9, p = 0.39) and microglial inward membrane current densities (1.4 ± 0.3 to −2.5 ± 0.3 pA/pF, n = 10 vs 14, *p = 0.02, at −140 mV) to the control data. Whereas the DC potential shift was not altered, the microglial membrane currents were significantly decreased. We conclude that AMPA/kainate receptors in the acute brain slice are involved in the mechanism leading to CSD-induced potassium currents in microglia.
NMDA mimics the CSD-induced changes in microglial membrane currents
Next we investigated whether NMDA (100 μm) bath application itself results in microglial membrane currents in acute mouse brain slices. We used the whole-cell patch-clamp technique as we described above. In addition we placed a field electrode close to the patched microglial cell (∼50–150 μm) and recorded the IOS in the given field of view (n = 19, magnesium-free ACSF). When clamped at −20 mV NMDA did not lead to a change in membrane currents. At more negative potentials we recorded a similar membrane current increase as observed with elevation of [K+]o or after initiation of CSD induced inward rectifying membrane currents in the patched microglial cells (Fig. 4A, top). The microglial membrane current response was accompanied by a simultaneous negative DC potential shift and an increase in IOS (Fig. 4A, bottom). The kinetics of NMDA-induced current showed a fast activation and inactivation at low membrane potentials similar to the currents recorded during spreading depression and elevation of [K+]o (Fig. 4B, left). The amplitudes of the NMDA-induced currents and the current–voltage relationships were influenced by extracellular magnesium as shown in Figure 4B (right). In magnesium-free ACSF, amplitudes were significantly higher at negative membrane potentials with the largest differences at −140 mV with average inward current densities of 1.8 ± 0.2 pA/pF (n = 49) in magnesium-free ACSF and 0.79 ± 0.16 pA/pF (n = 19, **p = 0.0046) in standard ACSF. The reversal potential of the NMDA-induced current was at −23 ± 3 mV (n = 45) in magnesium-free ACSF. Upon application of D-AP5 (50 μm) the NMDA-induced currents in microglia were completely blocked (n = 15; Fig. 4C). To confirm that all cells were viable we used ATP (1 mm) as a positive control, which always elicited a profound conductance increase as it was described by Boucsein et al. (2003).
Figure 4.

NMDA-induced inward rectifying currents in microglia accompanied by negative DC potential shifts and increased IOS. A, Example recording of microglial membrane currents, as described in the legend of Figure 1 (top trace) during bath application of NMDA (100 μm). Field recording and the change in the IOS are shown below. B, NMDA-induced membrane currents at the different membrane potentials were obtained by subtracting currents at the peak of the NMDA response from currents before NMDA application and are shown on the left. Right, Mean NMDA-induced currents were plotted against the membrane potential in magnesium-free ACSF (black) and standard ACSF (gray). C, Example recording of NMDA application in the presence of D-AP5 (50 μm), which was applied 30 s before, after, and during the NMDA application. ATP was applied at the end as a positive control. Error bars are given as the standard error of the mean.
NMDA and CSD-evoked currents in microglia are partially blocked by barium
We assume that NMDA increases the Kir channel activity in microglia and we therefore tested the impact of Ba2+ (1 mm) as a well known blocker of Kir channels (Hibino et al., 2010). First we analyzed the effect of 1 mm Ba2+ on the membrane properties of microglial cells. The cells were clamped at −20 mV and voltage steps from −170 to 60 mV with 10 mV increments were given for 50 ms each. Resulting current patterns are shown in Figure 5A (left) for control and barium application (average of 9 cells each). Membrane currents were mainly reduced at negative membrane potentials down to 56.6 ± 4.9% at −140 mV. The reversal potential of the subtracted current was close to the potassium equilibrium potential confirming baseline Kir channel activity in adult cortical ramified microglia of acute brain slices (Fig. 5A, right). We investigated whether the NMDA-induced inward rectifying currents shown above are mediated by Kir channels. We therefore applied NMDA in the presence of BaCl2. NMDA did only induce a very small increase of inward membrane currents at potentials negative to −60 mV (0.18 ± 0.06 pA/pF at −140 mV, n = 9). Instead we observed an increase in outward currents at positive potentials (0.6 ± 0.09 pA/pF, n = 9; Fig. 5B, top). The current–voltage curve of this current component shown in Figure 5B (bottom) had a reversal potential of ∼−50 mV. The negative DC potential shift and the increased IOS upon NMDA application was still observed although the amplitude of the negative DC potential shift was reduced by one-half [−3.1 ± 0.2 mV (n = 19) −1.4 ± 0.34 mV 3.1 ± 0.2 (n = 9); ***p = 0.0001]. We conclude that the NMDA-evoked inward rectifying current is mediated by Kir and a non-Kir-mediated outward current is unmasked by Ba2+, which is similar to currents described by Eyo et al (2014). To study the effect of Ba2+ on CSD and CSD-induced currents, we repeated the experiments shown above (Fig. 1) in the presence of 1 mm barium. Again inward rectifying membrane currents were blocked and a small outward current was unmasked in 6 of 13 recordings, shown in Figure 5C, with maximum amplitudes of 0.6 ± 0.2 pA/pF at 60 mV voltage steps. The DC potential however did not change significantly compared with controls (−3.6 ± 0.4 to −4.4 ± 0.7 mV, n = 13 vs 9; p = 0.29).
Figure 5.
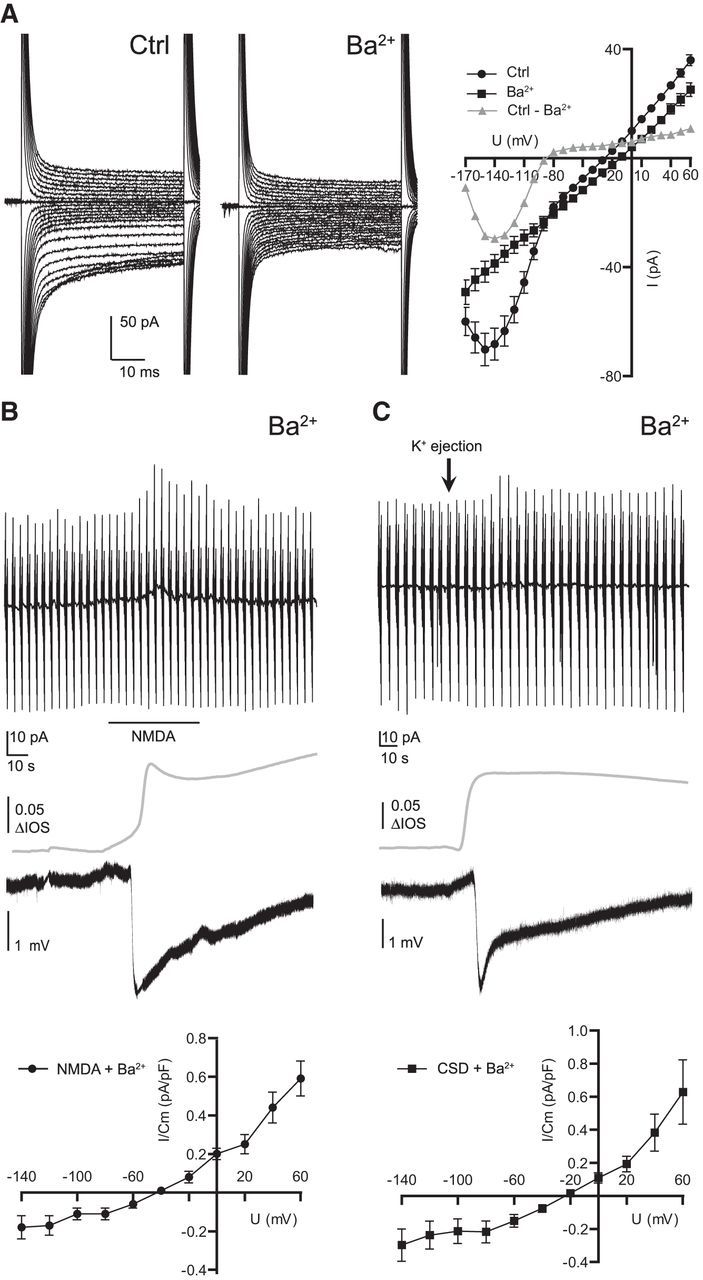
NMDA and CSD-induced currents are partially blocked by barium. Membrane current response, DC potential and IOS were recorded as described in the legend to Figure 1. A, Influence of barium (1 mm) on microglial membrane properties are shown. Microglia were clamped at −20 mV and voltage steps ranging from −170 to 60 mV with 10 mV increment each 50 ms long were applied. Barium blocked inward rectifying membrane currents with a reversal potential close to the potassium equilibrium potential. B, NMDA was applied as indicated by bar in presence of barium (1 mm). For calculation of current–voltage relationships, baseline currents were subtracted from currents at the peak of the response. NMDA-induced currents were plotted against membrane potential in the graph below. Note that NMDA induced a small outward rectifying response in the presence of barium. C, CSD-induced membrane currents in the presence of barium are shown. Again a small outward rectifying component was unmasked with a reversal potential close to −20 mV. Error bars are given as the standard error of the mean.
CSD-induced microglial membrane currents are inhibited by Kir antagonists
Because barium is a rather unspecific K+ channel blocker with known side effects we used more specific Kir antagonists. So far it has been shown that cultured microglia mainly display Kir2.1 currents, which are effectively blocked by ML133 (Lam and Schlichter, 2015). It is however not known which inward rectifiers are expressed in microglia in situ or in vivo. We therefore first confirmed the results by Lam and Schlichter (2015) by applying our batch of ML133 (20 μm) to cultured neonatal microglia. We were able to confirm that ML133 is an effective Kir blocker in vitro inhibiting 48 ± 7% (n = 8; Fig. 6A) of membrane currents at −140 mV membrane potentials. We then applied ML133 (20 μm) while recording membrane currents from microglial cells in slices. We did only observe a 12% inhibition of baseline inward currents at −140 mV (n = 6). Subsequently we tested the effect of ML133 (5 min preincubation) on the CSD-induced currents. The CSD-induced inward currents were 1.1 ± 0.2 pA/pF (n = 6) and thus smaller than control currents, which were 2.5 pA/pF (see above). Thus, the currents were reduced but not completely blocked. We therefore used a mixture of blockers directed against various Kir subtypes [Glibenclamide (100 μm, Kir6 family), ML133 (20 μm, Kir2.1), Nortriptyline (Kir4.1), Tertiapin-Q (200 nm, Kir3.1 and Kir3.4) and VU590 (10 μm, Kir1.1 and 7.1)] in a second set of experiments. In cultured microglial cells the whole mixture of antagonists inhibited 57 ± 8% of membrane currents (n = 8; Fig. 6B). This inhibition was not significantly different compared with ML133 alone (p = 0.41) confirming that Kir2.1 is the most dominant potassium inward rectifier in cultured microglia.
Figure 6.
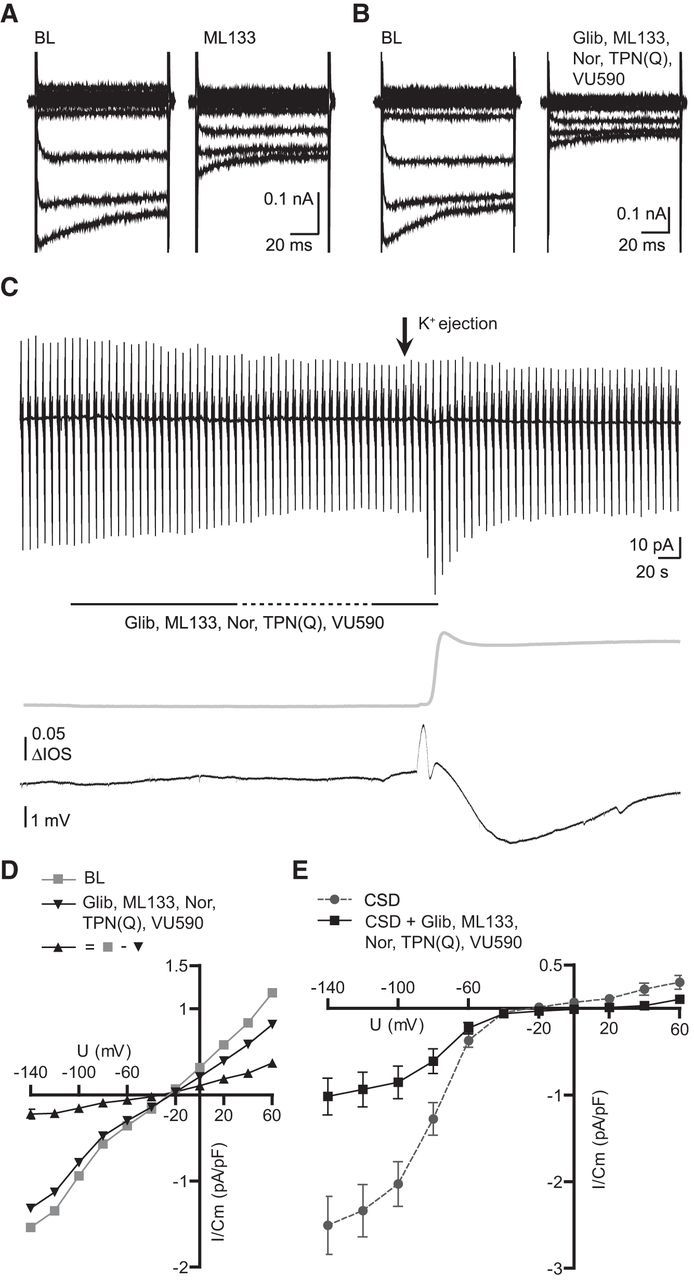
CSD-induced membrane currents are inhibited by a mixture of Kir antagonists. Membrane current response, DC potential and IOS were recorded as described in the legend to Figure 1. Representative recordings are shown for baseline inhibitions of ML133 (20 μm; A) and glibenclamide (100 μm), ML133 (20 μm), nortriptyline (100 μm), tertiapin-Q (200 nm), and VU590 (10 μm; B) in patched neonatal cultured microglia. C, Influence of Kir antagonists on microglial baseline currents and CSD-induced currents. Dashed line indicates a 2 min period of perfusion stop allowing the blockers to incubate. D, Average baseline, block by Kir antagonists, and the subtracted current are shown as current–voltage relationships. Note that the reversal potential is ∼30 mV. E, Average CSD-induced membrane currents are shown for control conditions and antagonist applications as current–voltage relationships displaying an inward current inhibition of ∼1.5 pA/pF at −140 mV membrane potentials (**p = 0.0019). Error bars are given as the standard error of the mean.
We then tested this mixture on microglia in situ (Fig. 6C). Only 14% (5.2 ± 1.5 pA, n = 11; Fig. 6D) of the baseline currents at −140 mV were blocked, which was significantly less compared with a 43% (29.6 ± 7.5 pA, n 11 vs 9; **p = 0.0024) inhibition by barium (Fig. 5A). We then compared the CSD-induced currents in the presence of the Kir antagonists to the control data shown above (Fig. 1). The CSD-induced inward current −140 mV was 1 ± 0.2 pA/pF (n = 14 vs 11, **p = 0.0019; Fig. 6E), thus not significantly different to the value in the presence of ML133 alone. We excluded one recording which was a significant outlier (**p < 0.01, Grubb's outlier test) showing no baseline inhibition by Kir antagonists and a profound CSD-induced inward current of 5.5 pA/pF at a −140 mV membrane potential suggesting heterogeneity of Kir activity of microglia in situ. We conclude that the dominant CSD-induced current component is mediated by Kir2.1, but that there is an additional component, which is sensitive to barium, but not blocked by the currently available antagonists of Kir.
NMDA-induced inward currents are not influenced by the purinergic receptor blocker RB2
It was recently reported that neuronal NMDA receptor activation can trigger the activation of microglial purinergic receptors leading to process motility in the microglial cells, which are inhibited by the purinergic antagonist Reactive Blue 2 (RB2; Dissing-Olesen et al., 2014; Eyo et al., 2014). We therefore tested the effect of RB2 on the NMDA-induced activation of Kir. Microglial were patched and magnesium-free ACSF was used. As shown in Figure 7A, Kir channel activity was still observed in the presence of RB2 (100 μm). The current–voltage relationship was not significantly affected. Neither inward current density at −140 mV membrane potential nor at 60 mV were significantly affected (2.25 ± 0.7 pA/pF for −140 mV, 0.2 ± 0.06 pA/pF for 60 mV, n = 17; Fig. 7B). We conclude that NMDA-induced inward rectifying potassium currents are independent of P2Y receptor related purinergic signaling.
Figure 7.
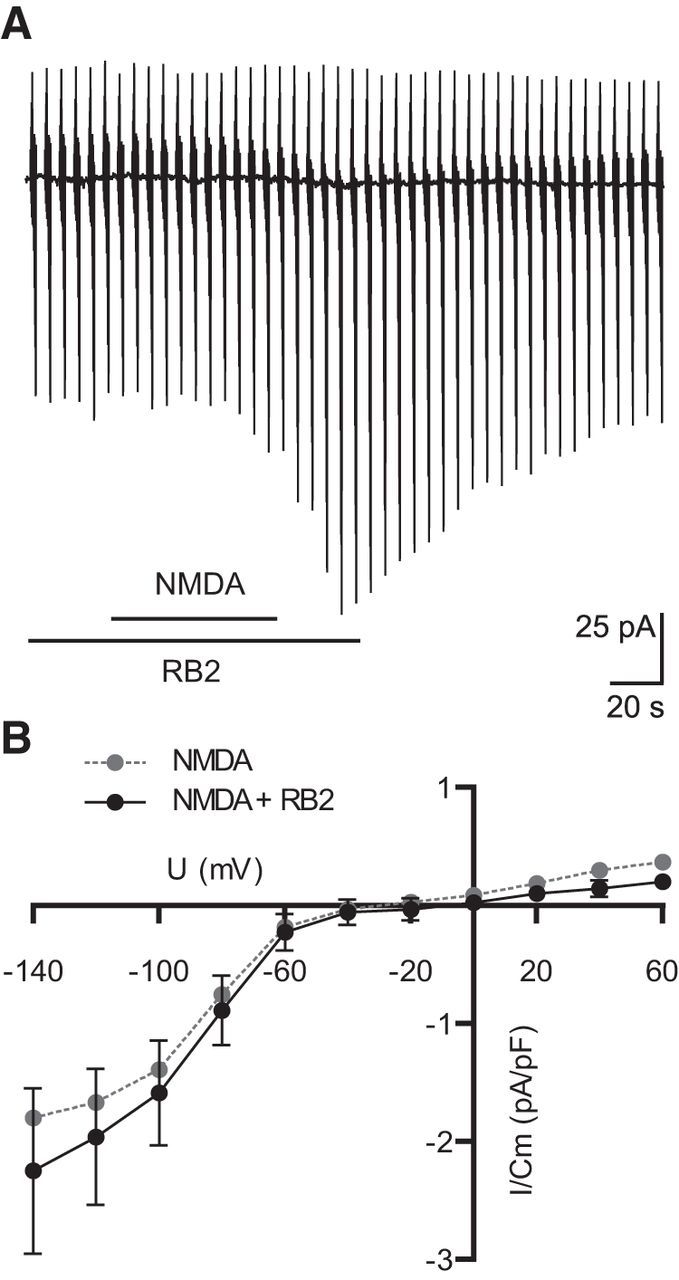
NMDA-induced currents are not influenced by the purinergic receptor blocker RB2. A, Membrane current response during application of NMDA in combination with RB2 (100 μm, 30 s before, during, and after NMDA application). B, Mean current–voltage relationships of the NMDA-induced currents in control solution and in combination with RB2 and controls. All experiments were done in magnesium-free ACSF. Error bars are given as the standard error of the mean.
Adult, cultured microglia do not respond to NMDA exposure
It was reported that neonatal microglial express functional NMDA receptors in vitro (Kaindl et al., 2012). We tested for the presence of functional NMDA receptors in microglial cultured from adult tissue by using the whole-cell patch-clamp technique and calcium imaging. We recorded membrane currents with a similar protocol as used for the in situ microglia and applied NMDA (100 μm) and ATP (1 mm) as a positive control. We never did observe any response to exposure of NMDA (n = 23; Fig. 8A), whereas ATP always triggered an increase in membrane currents as previously described (Walz et al., 1993). We also performed calcium imaging with Fluo-4 loaded adult microglia in vitro with the same wash-in protocol. In total, we analyzed 10 coverslips with a sum of 207 cells (additional 100 cells displayed spontaneous activity and were excluded due to possible false-positive results). We did not record any calcium elevations during NMDA applications or buffer controls (data not shown). Although nearly all cells responded to ATP application (91.3 ± 3.3%, n = 10). Example traces are shown in Fig. 8B. We therefore conclude that the cells were viable and do not respond to NMDA exposure neither by current influx nor by intracellular increase of calcium levels.
Figure 8.

NMDA application does not induce membrane currents or increased intracellular calcium levels in adult, cultured microglia. A, Membrane currents were measured as described in the legend to Figure 1. NMDA did not trigger any responses. B, Example Fluo-4 fluorescence changes are shown from five microglial cells. No calcium increase was detected during NMDA application. ATP was used as a positive control for patch-clamp recordings and calcium imaging.
Discussion
We demonstrate that in acute cortical mouse brain slices CSD induced an increase in the K+ conductance of microglial cells. This increase in K+ conductance can be mimicked by bath application of NMDA and an increase in extracellular [K+] and is blocked by the NMDA receptor antagonist D-AP5. It is well established that the NMDA receptor is crucial for initiation and propagation of CSD (Marrannes et al., 1988; Lauritzen and Hansen, 1992). There is, however, no evidence for the expression of functional NMDA receptors by microglial cells in situ. There are reports on functional NMDA receptor expression in vitro: (Hirayama and Kuriyama, 2001) showed that MK-801 (a well known blocker for NMDA receptors) is cytotoxic to microglial cells in vitro suggesting a presence of NMDA receptors on microglia and (Murugan et al., 2011) found evidence for NMDA subunit expression. Later, (Kaindl et al., 2012) showed responses to NMDA in neonatal microglial cells in vitro by using calcium imaging and patch-clamp. Two independent studies in situ described a neuron–microglial crosstalk involving neuronal NMDA receptors and microglial purinergic receptors without any evidence for functional microglial NMDA receptors on microglia (Dissing-Olesen et al., 2014; Eyo et al., 2014). We could confirm this by demonstrating that microglia isolated from adult mice do not respond with a membrane conductance increase or a calcium elevation upon application of NMDA. We thus assume that neuronal NMDA receptor activation during CSD leads to an increase in extracellular [K+], which results in the activation of inward rectifying currents in microglia. Macroglial NMDA receptors of astrocytes (Lalo et al., 2006) and oligodendrocytes (Káradóttir et al., 2005) might play an additional role. In addition to the involvement of NMDA receptors, we investigated whether AMPA/kainate receptors are involved and found that CSD-induced microglial Kir currents, but not DC potential shifts, are influenced by CNQX, an AMPA/kaiante receptor antagonist. Although it is believed that within the class of ionotropic glutamate receptors only NMDA receptors play a crucial role for CSD (Lauritzen and Hansen, 1992; Nellgård and Wieloch, 1992), there is evidence that AMPA receptors have at least regulatory effects on CSD (Kertész et al., 2004; Holland et al., 2010).
Indeed, we could block the microglial response to CSD and NMDA application by the K+ channel blocker Ba2+ confirming that the microglial response is mediated by the activation of K+ channels. This Ba2+ blockade unmasked a small outward current response with a current–voltage relationship similar to a response to ATP (Boucsein et al., 2003), and thus confirming the observation by Eyo et al. (2014) that bath application of NMDA leads to ATP responses in hippocampal microglia. In their study, they recorded currents only at a membrane potential of −20 mV and could thus not record the activation of the inward rectifier as we observed in our study. It is however interesting that they observed such currents without barium, which might be the result of regional differences between cortical and hippocampal microglia. Moreover, we found that the purinergic receptor blocker RB2 did not block the NMDA-induced Kir current indicating that neuronal NMDA receptor activation leads to two distinct events, namely the CSD-induced Kir current activation reported in this study and the NMDA–ATP crosstalk reported by Dissing-Olesen et al. (2014) and Eyo et al. (2014). We also used specific antagonists for Kir resulting in similar effects on baseline currents and CSD-induced currents. It has been shown by Lam and Schlichter (2015) that Kir2.1 is the dominant inward rectifier K+ channel in vitro which we could confirm using the antagonist ML133. This antagonist had, however, only a small effect on the resting currents in microglia in situ. So far, it is not known which channels are responsible for Kir currents in microglia in situ and in vivo. We therefore used a mixture of all subtype-specific Kir antagonists that are currently available [Glibenclamide (Kir6 family), ML133 (Kir2.1), Nortriptyline (Kir4.1), Tertiapin-Q (Kir3.1 and Kir3.4), and VU590 (Kir1.1 and 7.1)] which was, however, not more effective. Both ML133 and the mixture blocked ∼60% of the CSD-induced current. This indicates that a significant fraction of the current is mediated by Kir2.1, but there is still a (barium-sensitive) current component, which is not sensitive to the so far known Kir antagonists. We also noted that the reversal potential of microglial currents blocked by these antagonists was not at the potassium equilibrium potential as we showed for the barium-sensitive current.
Elevation in extracellular [K+] occurs in physiology and pathology, although only under pathologic conditions extracellular [K+] exceeds 10 mm. Thus an extracellular [K+] increase has been considered as an activation signal for microglia. A GABAB receptors mediated increase in extracellular [K+] triggers macrophage inflammatory protein-1α release in amoeboid microglia of young mouse brain slices of the corpus callosum has been shown by Cheung et al. (2009). Activity of Kir modulates ATP-induced calcium signaling (Franchini et al., 2004) and blockade of Kir reduces ATP-induced chemotaxis and induces microglial proliferation in vitro (Lam and Schlichter, 2015). Thus, the activation of Kir induced by CSD may have an impact on microglial functions.
So far the role of microglia in initiation, propagation and recovery of CSD is poorly understood. There is, however, evidence that CSD has an impact on microglia. Hours after initiation of potassium induced spreading depression microglial cells upregulate markers of activation by showing an increased expression of MHC-II (Gehrmann et al., 1993) and IL-1β (Jander et al., 2001). Spreading depression induces microglial migration and motility and we speculate that this response might influence the electrical activity of the surrounding tissue leading to higher susceptibility to CSD (Grinberg et al., 2011). Recently it was even suggested that microglial cytokine release is necessary for the initiation of spreading depression (Pusic et al., 2014). In conclusion, we show that microglial cells sense the CSD by activation of Kir, which might in turn modulate microglial behavior. The possible significance of microglial cells sensing and responding to potassium elevations in CSD could be relevant in a pathological context. CSD was reported to be associated with stroke (Strong et al., 2002) and traumatic brain injury (Hartings et al., 2009). Additionally it is reported that the pathophysiology of migraine aura and epilepsy share certain features and that migraine aura can trigger epileptic seizures (Nye and Thadani, 2015). Thus, sensing CSD-induced potassium elevations in a pathologic context might be a signal to microglia and could result in functional consequences.
Footnotes
This work was supported by Deutsche Forschungsgemeinschaft (SFB TRR43, EXC 257 NeuroCure) and an MD fellowship of the Boehringer Ingelheim Fonds to Emile Wogram. We thank Vitali Matyash for discussion, Niklas Meyer for experimental help, Regina Piske and Maren Wendt for technical assistance, and Ulrike Pannasch for project ideas.
The authors declare no competing financial interests.
References
- Avignone E, Lepleux M, Angibaud J, Nägerl UV. Altered morphological dynamics of activated microglia after induction of status epilepticus. J Neuroinflammation. 2015;12:202. doi: 10.1186/s12974-015-0421-6. [DOI] [PMC free article] [PubMed] [Google Scholar]
- Boucsein C, Zacharias R, Färber K, Pavlovic S, Hanisch UK, Kettenmann H. Purinergic receptors on microglial cells: functional expression in acute brain slices and modulation of microglial activation in vitro. Eur J Neurosci. 2003;17:2267–2276. doi: 10.1046/j.1460-9568.2003.02663.x. [DOI] [PubMed] [Google Scholar]
- Cheung G, Kann O, Kohsaka S, Făerber K, Kettenmann H. GABAergic activities enhance macrophage inflammatory protein-1alpha release from microglia (brain macrophages) in postnatal mouse brain. J Physiol. 2009;587:753–768. doi: 10.1113/jphysiol.2008.163923. [DOI] [PMC free article] [PubMed] [Google Scholar]
- Dissing-Olesen L, LeDue JM, Rungta RL, Hefendehl JK, Choi HB, MacVicar BA. Activation of neuronal NMDA receptors triggers transient ATP-mediated microglial process outgrowth. J Neurosci. 2014;34:10511–10527. doi: 10.1523/JNEUROSCI.0405-14.2014. [DOI] [PMC free article] [PubMed] [Google Scholar]
- Dreier JP. The role of spreading depression, spreading depolarization and spreading ischemia in neurological disease. Nat Med. 2011;17:439–447. doi: 10.1038/nm.2333. [DOI] [PubMed] [Google Scholar]
- Eyo UB, Peng J, Swiatkowski P, Mukherjee A, Bispo A, Wu LJ. Neuronal hyperactivity recruits microglial processes via neuronal NMDA receptors and microglial P2Y12 receptors after status epilepticus. J Neurosci. 2014;34:10528–10540. doi: 10.1523/JNEUROSCI.0416-14.2014. [DOI] [PMC free article] [PubMed] [Google Scholar]
- Franchini L, Levi G, Visentin S. Inwardly rectifying K+ channels influence Ca2+ entry due to nucleotide receptor activation in microglia. Cell Calcium. 2004;35:449–459. doi: 10.1016/j.ceca.2003.11.001. [DOI] [PubMed] [Google Scholar]
- Gehrmann J, Mies G, Bonnekoh P, Banati R, Iijima T, Kreutzberg GW, Hossmann KA. Microglial reaction in the rat cerebral cortex induced by cortical spreading depression. Brain Pathol. 1993;3:11–17. doi: 10.1111/j.1750-3639.1993.tb00720.x. [DOI] [PubMed] [Google Scholar]
- Giulian D, Baker TJ. Characterization of ameboid microglia isolated from developing mammalian brain. J Neurosci. 1986;6:2163–2178. doi: 10.1523/JNEUROSCI.06-08-02163.1986. [DOI] [PMC free article] [PubMed] [Google Scholar]
- Grinberg YY, Milton JG, Kraig RP. Spreading depression sends microglia on Lévy flights. PloS One. 2011;6:e19294. doi: 10.1371/journal.pone.0019294. [DOI] [PMC free article] [PubMed] [Google Scholar]
- Hablitz JJ, Heinemann U. Alterations in the microenvironment during spreading depression associated with epileptiform activity in the immature neocortex. Brain Res Dev Brain Res. 1989;46:243–252. doi: 10.1016/0165-3806(89)90288-5. [DOI] [PubMed] [Google Scholar]
- Hanisch UK, Kettenmann H. Microglia: active sensor and versatile effector cells in the normal and pathologic brain. Nat Neurosci. 2007;10:1387–1394. doi: 10.1038/nn1997. [DOI] [PubMed] [Google Scholar]
- Hartings JA, Strong AJ, Fabricius M, Manning A, Bhatia R, Dreier JP, Mazzeo AT, Tortella FC, Bullock MR, Co-Operative Study of Brain Injury Depolarizations Spreading depolarizations and late secondary insults after traumatic brain injury. J Neurotrauma. 2009;26:1857–1866. doi: 10.1089/neu.2009.0961. [DOI] [PMC free article] [PubMed] [Google Scholar]
- Hibino H, Inanobe A, Furutani K, Murakami S, Findlay I, Kurachi Y. Inwardly rectifying potassium channels: their structure, function, and physiological roles. Physiol Rev. 2010;90:291–366. doi: 10.1152/physrev.00021.2009. [DOI] [PubMed] [Google Scholar]
- Hirayama M, Kuriyama M. MK-801 is cytotoxic to microglia in vitro and its cytotoxicity is attenuated by glutamate, other excitotoxic agents and atropine: possible presence of glutamate receptor and muscarinic receptor on microglia. Brain Res. 2001;897:204–206. doi: 10.1016/S0006-8993(01)02114-X. [DOI] [PubMed] [Google Scholar]
- Holland PR, Akerman S, Goadsby PJ. Cortical spreading depression-associated cerebral blood flow changes induced by mechanical stimulation are modulated by AMPA and GABA receptors. Cephalalgia. 2010;30:519–527. doi: 10.1111/j.1468-2982.2009.02021.x. [DOI] [PubMed] [Google Scholar]
- Jander S, Schroeter M, Peters O, Witte OW, Stoll G. Cortical spreading depression induces proinflammatory cytokine gene expression in the rat brain. J Cereb Blood Flow Metab. 2001;21:218–225. doi: 10.1097/00004647-200103000-00005. [DOI] [PubMed] [Google Scholar]
- Kaindl AM, Degos V, Peineau S, Gouadon E, Chhor V, Loron G, Le Charpentier T, Josserand J, Ali C, Vivien D, Collingridge GL, Lombet A, Issa L, Rene F, Loeffler JP, Kavelaars A, Verney C, Mantz J, Gressens P. Activation of microglial N-methyl-d-aspartate receptors triggers inflammation and neuronal cell death in the developing and mature brain. Ann Neurol. 2012;72:536–549. doi: 10.1002/ana.23626. [DOI] [PubMed] [Google Scholar]
- Káradóttir R, Cavelier P, Bergersen LH, Attwell D. NMDA receptors are expressed in oligodendrocytes and activated in ischaemia. Nature. 2005;438:1162–1166. doi: 10.1038/nature04302. [DOI] [PMC free article] [PubMed] [Google Scholar]
- Kertész S, Kapus G, Lévay G. Interactions of allosteric modulators of AMPA/kainate receptors on spreading depression in the chicken retina. Brain Res. 2004;1025:123–129. doi: 10.1016/j.brainres.2004.08.010. [DOI] [PubMed] [Google Scholar]
- Kettenmann H, Hanisch UK, Noda M, Verkhratsky A. Physiology of microglia. Physiol Rev. 2011;91:461–553. doi: 10.1152/physrev.00011.2010. [DOI] [PubMed] [Google Scholar]
- Lalo U, Pankratov Y, Kirchhoff F, North RA, Verkhratsky A. NMDA receptors mediate neuron-to-glia signaling in mouse cortical astrocytes. J Neurosci. 2006;26:2673–2683. doi: 10.1523/JNEUROSCI.4689-05.2006. [DOI] [PMC free article] [PubMed] [Google Scholar]
- Lam D, Schlichter LC. Expression and contributions of the Kir2.1 inward-rectifier K(+) channel to proliferation, migration and chemotaxis of microglia in unstimulated and anti-inflammatory states. Front Cell Neurosci. 2015;9:185. doi: 10.3389/fncel.2015.00185. [DOI] [PMC free article] [PubMed] [Google Scholar]
- Lauritzen M. Spreading depression and migraine. Pathol Biol. 1992;40:332–337. [PubMed] [Google Scholar]
- Lauritzen M, Hansen AJ. The effect of glutamate receptor blockade on anoxic depolarization and cortical spreading depression. J Cereb Blood Flow Metab. 1992;12:223–229. doi: 10.1038/jcbfm.1992.32. [DOI] [PubMed] [Google Scholar]
- Lauritzen M, Rice ME, Okada Y, Nicholson C. Quisqualate, kainate and NMDA can initiate spreading depression in the turtle cerebellum. Brain Res. 1988;475:317–327. doi: 10.1016/0006-8993(88)90620-8. [DOI] [PubMed] [Google Scholar]
- Leão AAP. Spreading depression of activity in the cerebral cortex. J Neurophysiol. 1944;7:359–390. doi: 10.1152/jn.1947.10.6.409. [DOI] [PubMed] [Google Scholar]
- Marrannes R, Willems R, De Prins E, Wauquier A. Evidence for a role of the N-methyl-d-aspartate (NMDA) receptor in cortical spreading depression in the rat. Brain Res. 1988;457:226–240. doi: 10.1016/0006-8993(88)90690-7. [DOI] [PubMed] [Google Scholar]
- Murugan M, Sivakumar V, Lu J, Ling EA, Kaur C. Expression of N-methyl D-aspartate receptor subunits in amoeboid microglia mediates production of nitric oxide via NF-κB signaling pathway and oligodendrocyte cell death in hypoxic postnatal rats. Glia. 2011;59:521–539. doi: 10.1002/glia.21121. [DOI] [PubMed] [Google Scholar]
- Nellgård B, Wieloch T. NMDA-receptor blockers but not NBQX, an AMPA-receptor antagonist, inhibit spreading depression in the rat brain. Acta Physiologica Scandinavica. 1992;146:497–503. doi: 10.1111/j.1748-1716.1992.tb09451.x. [DOI] [PubMed] [Google Scholar]
- Nimmerjahn A, Kirchhoff F, Helmchen F. Resting microglial cells are highly dynamic surveillants of brain parenchyma in vivo. Science. 2005;308:1314–1318. doi: 10.1126/science.1110647. [DOI] [PubMed] [Google Scholar]
- Nye BL, Thadani VM. Migraine and epilepsy: review of the literature. Headache. 2015;55:359–380. doi: 10.1111/head.12536. [DOI] [PubMed] [Google Scholar]
- Peters O, Schipke CG, Hashimoto Y, Kettenmann H. Different mechanisms promote astrocyte Ca2+ waves and spreading depression in the mouse neocortex. J Neurosci. 2003;23:9888–9896. doi: 10.1523/JNEUROSCI.23-30-09888.2003. [DOI] [PMC free article] [PubMed] [Google Scholar]
- Petzold GC, Windmüller O, Haack S, Major S, Buchheim K, Megow D, Gabriel S, Lehmann TN, Drenckhahn C, Peters O, Meierkord H, Heinemann U, Dirnagl U, Dreier JP. Increased extracellular K+ concentration reduces the efficacy of N-methyl-d-aspartate receptor antagonists to block spreading depression-like depolarizations and spreading ischemia. Stroke. 2005;36:1270–1277. doi: 10.1161/01.STR.0000166023.51307.e0. [DOI] [PubMed] [Google Scholar]
- Pusic KM, Pusic AD, Kemme J, Kraig RP. Spreading depression requires microglia and is decreased by their M2a polarization from environmental enrichment. Glia. 2014;62:1176–1194. doi: 10.1002/glia.22672. [DOI] [PMC free article] [PubMed] [Google Scholar]
- Sasmono RT, Williams E. Generation and characterization of MacGreen mice, the Cfs1r-EGFP transgenic mice. Methods Mol Biol. 2012;844:157–176. doi: 10.1007/978-1-61779-527-5_11. [DOI] [PubMed] [Google Scholar]
- Scheffel J, Regen T, Van Rossum D, Seifert S, Ribes S, Nau R, Parsa R, Harris RA, Boddeke HW, Chuang HN, Pukrop T, Wessels JT, Jürgens T, Merkler D, Brück W, Schnaars M, Simons M, Kettenmann H, Hanisch UK. Toll-like receptor activation reveals developmental reorganization and unmasks responder subsets of microglia. Glia. 2012;60:1930–1943. doi: 10.1002/glia.22409. [DOI] [PubMed] [Google Scholar]
- Strong AJ, Fabricius M, Boutelle MG, Hibbins SJ, Hopwood SE, Jones R, Parkin MC, Lauritzen M. Spreading and synchronous depressions of cortical activity in acutely injured human brain. Stroke. 2002;33:2738–2743. doi: 10.1161/01.STR.0000043073.69602.09. [DOI] [PubMed] [Google Scholar]
- Walz W, Ilschner S, Ohlemeyer C, Banati R, Kettenmann H. Extracellular ATP activates a cation conductance and a K+ conductance in cultured microglial cells from mouse brain. J Neurosci. 1993;13:4403–4411. doi: 10.1523/JNEUROSCI.13-10-04403.1993. [DOI] [PMC free article] [PubMed] [Google Scholar]
- Witte OW, Niermann H, Holthoff K. Cell swelling and ion redistribution assessed with intrinsic optical signals. Anais da Academia Brasileira de Ciencias. 2001;73:337–350. doi: 10.1590/S0001-37652001000300005. [DOI] [PubMed] [Google Scholar]
- Zhou N, Rungta RL, Malik A, Han H, Wu DC, MacVicar BA. Regenerative glutamate release by presynaptic NMDA receptors contributes to spreading depression. J Cereb Blood Flow Metab. 2013;33:1582–1594. doi: 10.1038/jcbfm.2013.113. [DOI] [PMC free article] [PubMed] [Google Scholar]