

Abstract
The U.S. Southwest is projected to experience increasing aridity due to climate change. We quantify the resulting impacts on ambient dust levels and public health using methods consistent with the Environmental Protection Agency's Climate Change Impacts and Risk Analysis framework. We first demonstrate that U.S. Southwest fine (PM2.5) and coarse (PM2.5‐10) dust levels are strongly sensitive to variability in the 2‐month Standardized Precipitation‐Evapotranspiration Index across southwestern North America. We then estimate potential changes in dust levels through 2099 by applying the observed sensitivities to downscaled meteorological output projected by six climate models following an intermediate (Representative Concentration Pathway 4.5, RCP4.5) and a high (RCP8.5) greenhouse gas concentration scenario. By 2080–2099 under RCP8.5 relative to 1986–2005 in the U.S. Southwest: (1) Fine dust levels could increase by 57%, and fine dust‐attributable all‐cause mortality and hospitalizations could increase by 230% and 360%, respectively; (2) coarse dust levels could increase by 38%, and coarse dust‐attributable cardiovascular mortality and asthma emergency department visits could increase by 210% and 88%, respectively; (3) climate‐driven changes in dust concentrations can account for 34–47% of these health impacts, with the rest due to increases in population and baseline incidence rates; and (4) economic damages of the health impacts could total $47 billion per year additional to the 1986–2005 value of $13 billion per year. Compared to national‐scale climate impacts projected for other U.S. sectors using the Climate Change Impacts and Risk Analysis framework, dust‐related mortality ranks fourth behind extreme temperature‐related mortality, labor productivity decline, and coastal property loss.
Keywords: climate impacts, drought, air quality, mineral dust, particulate matter, health impacts assessment
Key Points
Increasing aridity may cause dust levels in the U.S. Southwest to rise by 40% in 2090 under a high greenhouse gas concentration scenario
Dust‐related mortality could increase by 220% in 2090 under the high scenario
Estimated economic damages from dust‐related mortality make this one of the costliest climate impacts projected for the United States so far
1. Introduction
Human‐caused climate change has the potential to affect future concentrations of ambient air pollutants across the United States through several mechanisms, but the net response of particulate matter (PM) remains poorly quantified (Fann et al., 2016; Nolte et al., 2018). Climate models consistently project that southwestern North America, a region containing extensive wind‐erodible and human‐disturbed drylands and deserts, will transition to an even more arid hydroclimate under continued greenhouse gas (GHG) forcing (Ault et al., 2016; Wehner et al., 2017). Recent studies suggest that such changes may lead to enhanced dust activity in the U.S. Southwest (Achakulwisut et al., 2017; Tong et al., 2017). In a previous study, Achakulwisut et al. (2018) provided one of the first estimates of the climate‐attributable impacts on fine dust (FD) and public health in the U.S. Southwest. Here, we apply and extend methods developed by Achakulwisut et al. to investigate the sensitivity of ambient dust levels in the U.S. Southwest to regional drought conditions and use the observed relationships to assess potential changes in dust levels and associated public health impacts under different climate change and socioeconomic scenarios consistent with the Environmental Protection Agency's (EPA) Climate Change Impacts and Risk Analysis (CIRA) framework (U.S. EPA, 2015, 2017a). The 2017 CIRA report (U.S. EPA, 2017a) was developed to inform the Fourth U.S. National Climate Assessment (U.S. Global Change Research Program, 2018), and our results contribute to ongoing efforts to systematically quantify and monetize climate change‐attributable damages across multiple U.S. sectors (e.g., human health, infrastructure, and water resources) at the national and regional levels.
The Southwest is the hottest and driest region in the United States and is particularly prone to droughts (U.S. Global Change Research Program, 2017). In southwestern states, soil‐derived mineral dust particles are major components of ambient fine PM (aerodynamic diameter ≤ 2.5 μm, PM2.5) and coarse PM (aerodynamic diameter between 2.5 and 10 μm, PM2.5‐10), which both contribute to air pollution and visibility degradation. Ground‐based observations indicate that dust in these states constitutes up to ~50% of monthly mean PM2.5 concentrations and ~75% of monthly mean PM2.5‐10 concentrations, especially in the springtime (Clements et al., 2014; Hand et al., 2017; Malm et al., 2007). Previous studies have found that fluctuations in ambient dust levels across the U.S. Southwest in the past 20–30 years are influenced by high wind events, human land disturbance, and regional hydroclimate conditions, the last of which is partially controlled by large‐scale changes in sea surface temperature and/or atmospheric circulation patterns, including the El Niño–Southern Oscillation and Pacific Decadal Oscillation (Achakulwisut et al., 2017; Brahney et al., 2013; Hand et al., 2016).
Decades of epidemiological studies have established that short‐ and long‐term exposures to PM2.5 are associated with a broad range of adverse cardiovascular and respiratory effects, including lung cancer, chronic obstructive pulmonary disease, myocardial infarction (heart attack), and asthma development and exacerbation (Krewski et al., 2000, 2009; Sacks et al., 2011; U.S. EPA, 2009, 2018c). Recent studies suggest that these risks apply even at very low exposure levels (Di, Q., Wang, Y., et al., 2017; Di, Q., Dai, L., et al., 2017). Compared to PM2.5, evidence regarding the health effects of PM2.5‐10 is less conclusive. Nonetheless, a confluence of existing evidence from epidemiological, toxicological, and controlled human exposure studies is suggestive of a causal relationship between PM2.5‐10 exposure and respiratory and cardiovascular effects, in particular asthma exacerbation and cardiovascular mortality (U.S. EPA, 2018c). While further studies are needed to elucidate the specific toxicity of different PM2.5 and PM2.5‐10 components (Stanek et al., 2011; U.S. EPA, 2018c), recent literature reviews of the health impacts of desert dust worldwide concluded that epidemiological studies generally report positive—though not always statistically significant—relationships between exposure to desert dust particles and morbidity and mortality related to respiratory and cardiovascular disorders (Goudie, 2014; Morman & Plumlee, 2013; Zhang et al., 2016). Zhang et al. (2016) also reviewed pathological studies, reporting that identified mechanisms include induction of oxidative stress and/or inflammatory processes in respiratory, cardiovascular, and immune systems, DNA damage, and deterioration in pulmonary function. Additionally, samples of desert dust collected at various sites across the western United States have been shown to cause respiratory cell damage in in vitro toxicology studies, most likely due to its primary component, silica (Ghio et al., 2014; Veranth et al., 2004).
Because climate change can affect air quality by influencing atmospheric ventilation rates, wet and dry deposition, chemical production and loss rates, natural emissions, and background concentrations, research efforts to understand the implications of human‐caused climate change on regional air quality and health impacts have been intensifying over the past decade (Fann et al., 2016; Jacob & Winner, 2009; Kinney, 2018). The 2017 CIRA report estimates that, irrespective of changes in anthropogenic emissions of ozone precursors, climate‐driven increases in ground‐level ozone concentrations may cause 920–2,500 premature deaths per year in the United States in 2090, costing $26 billion per year in terms of economic damages, under a high GHG concentration scenario (Representative Concentration Pathway 8.5, RCP8.5; U.S. EPA, 2017a). Besides ozone, there is high certainty that climate change will also exacerbate wildfire pollution and aeroallergen levels in the United States (Fann et al., 2016). However, uncertainties remain in the net response of PM to climate change (Fann et al., 2016; Nolte et al., 2018). For example, while it is well established that without substantial reductions in GHG emissions, southwestern North America will experience severe droughts toward the end of this century (Wehner et al., 2017), the implications for ambient dust levels have not been well quantified. This is partly due to the fact that existing 3‐D dynamical dust emission models have trouble capturing the relevant dust mobilization and transport processes, including observed sensitivities to drought conditions (Evan et al., 2014; Wang et al., 2017). Consequently, the relationship between wind‐blown dust and droughts was recently identified as one of several critical research priorities needed to better understand the climate‐sensitivity of PM (Dawson et al., 2014).
In a previous study, Achakulwisut et al. (2018, hereafter “A2018”) demonstrated that monthly mean FD concentrations measured at ground‐based sites across the Southwest largely covary on interannual time scales between 2000 and 2015, and that this regional behavior is significantly associated with fluctuations in the Standardized Precipitation‐Evapotranspiration Index (SPEI) aggregated between 1 to 6 months across southwestern North America. The strongest correlations were observed with the 2‐month SPEI (SPEI02), which is related to soil moisture at shallow depths (Vicente‐Serrano et al., 2010, 2012; Wang et al., 2015; see Figure S1 in the supporting information). This relationship is consistent with results from wind tunnel and field experiments, including those from arid and semiarid regions, demonstrating that the threshold wind speed increases with soil moisture (e.g., Chepil, 1956; Ishizuka, 2005) and that declines in soil moisture can lead to a reduction in protective vegetation cover and soil stability and a slower recovery from disturbance, thereby increasing wind erosion of exposed soil (Field et al., 2010; Munson et al., 2011). Additionally, dust emissions from agricultural operations have been shown to be closely related to soil moisture conditions (Funk et al., 2008).
In this study, we apply and extend the methods developed by A2018 to assess how climate‐driven increases in aridity may impact ambient levels of FD and coarse dust (CD) and to evaluate the public health impacts and associated economic damages using the CIRA framework. Following A2018, we use the 2‐month SPEI as a drought proxy rather than focusing on soil moisture. This is because of the very limited availability of spatially and temporally extensive soil moisture measurements with which to carry out our sensitivity analysis, as well as the lack of downscaled soil moisture projections from global climate models. Conversely, drought indices such as the SPEI can be readily calculated from existing downscaled temperature and precipitation observations and modeled data. The CIRA project's use of consistent socioeconomic and climate change projections allows for comparison of climate‐attributable impacts across space, time, and sectors under multiple emissions scenarios (U.S. EPA, 2017a).
2. Data and Methods
2.1. Historical Sensitivity of Ambient Dust Levels to Drought Conditions
As detailed in A2018, we first use empirical orthogonal function (EOF), correlation, and regression analyses to investigate and quantify the historical sensitivity of FD to drought conditions on interannual time scales. In this study, we extend this analysis to dust particles in the coarse mass fraction. Surface monthly mean FD and CD concentrations are derived from 24‐hr averaged measurements made every third day by the Interagency Monitoring of Protected Visual Environments (IMPROVE) network at 35 sites located in the southwestern United States (defined here as 31–41°N,115–103°W; spanning Arizona, Colorado, New Mexico, and Utah). The locations of the 35 IMPROVE sites in our study domain are shown in Figure 1. The IMPROVE network began operation in 1988 with 20 sites and expanded to 165 sites between 2000 and 2003, with the majority of sites located in remote and rural locations across the United States (Malm et al., 2004). We derive FD concentrations from the iron content of PM2.5 (Achakulwisut et al., 2017; see supporting information for further details), and approximate CD concentrations by assuming that coarse PM is composed of 100% soil‐derived particles. Although long‐term speciated coarse PM measurements are not available, observations made at one site within our study domain (Grand Canyon, AZ) between 2003 and 2004 show that 76% of coarse PM is composed of soil‐derived particles (Malm et al., 2007). Observed variability in coarse mass concentrations should therefore be dominated by CD.
Figure 1.
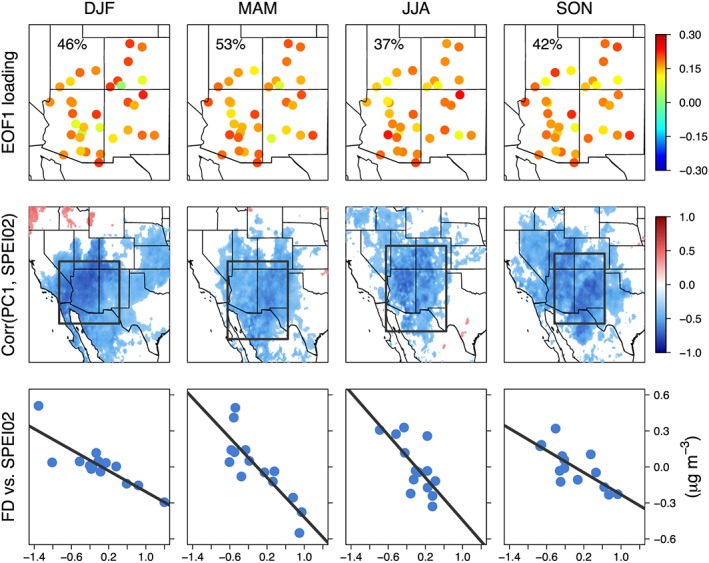
Empirical orthogonal function (EOF), correlation, and regression analysis results for different seasons from 2000 to 2013. (Top row) The first EOF (EOF1) loading of standardized anomalies of detrended and deseasonalized monthly mean fine dust (FD) concentrations measured at 35 Interagency Monitoring of Protected Visual Environments sites in the southwestern United States (31–41°N, 115–103°W). The percentage of total variance explained is displayed inset. (Middle row) The heterogeneous correlation maps between the time series of the principal components of EOF1 (PC1) and SPEI02 anomalies. Only those grid cells with statistically significant correlations (p < 0.05) are shown. (Bottom row) Regional and seasonal mean SPEI02 versus FD anomalies. FD anomalies are averaged across the 35 sites. SPEI02 anomalies are averaged over the domains outlined by the black box in the middle row panels. DJF = December–February; MAM = March–May; JJA = June–August; SON = September–November; SPEI = Standardized Precipitation‐Evapotranspiration Index.
The SPEI is a commonly used drought index that represents the climatic water balance, calculated as precipitation minus evapotranspiration aggregated over different time scales and compared to a reference period of 1950–2010 (Vicente‐Serrano et al., 2010). Classification of drought conditions represented by SPEI is shown in Table S1. The global 0.1° × 0.1° gridded SPEI database provided by the Spanish National Research Council (CSIC) calculates the potential evapotranspiration (PET) from the commonly used Food and Agriculture Organization Penman‐Monteith equation. However, this requires many variables not readily available from climate model projections. Here, we calculate historical (1950–2013) monthly mean SPEI02 based on the Modified‐Hargreaves PET equation, using daily precipitation, maximum, and minimum temperature data from Livneh et al. (2015; regridded to (1/8)° × (1/8)° from (1/16)° × (1/16)°), so that historical and projected SPEI02 are calculated from the same PET equation. The Livneh et al. (2015) gridded data set is derived from ground‐based observations. Droogers and Allen (2002) demonstrated that the Modified‐Hargreaves is a robust alternative to the Penman‐Monteith equation in situations that involve a high level of uncertainty and anticipated inaccuracy in the parameters (wind speed and relative humidity) needed for Penman‐Monteith. We find good agreement between monthly mean SPEI02 averaged over southwestern North America from the CSIC database and our calculated values (Figure S2).
The CIRA “historical reference period” against which changes in projections are typically calculated is 1986–2005. However, given that the IMPROVE network began operating in 1988 and underwent rapid expansion between 2000 and 2002 and that the Livneh et al. (2015) meteorological data are available for 1950–2013, we quantify dust‐SPEI02 relationships between 2000 and 2013 in order to maximize the number of data points. We assume that the sensitivities derived from these years are also valid in the historical and future periods. We first apply EOF analysis to identify the most dominant mode of monthly mean FD interannual variability (“EOF1”) and the areas in which the principal time series of EOF1 (“PC1”) display the strongest sensitivities to SPEI02 for each season (December–February, March–May,June–August, and September–November). We then use simple linear regression to quantify the sensitivity of seasonal mean FD averaged over the U.S. Southwest to seasonal mean SPEI02 anomalies averaged over regions displaying the strongest correlations across southwestern North America (outlined by black boxes in the middle row panels of Figure 1). The 95% confidence intervals of regression coefficients are calculated by bootstrap resampling with 10,000 replicates and the bias‐corrected and accelerated (BCa) confidence interval method (DiCiccio et al., 1996). The same steps are repeated for CD.
2.2. Projections of Changes in Ambient Dust Levels Due to Changes in Aridity
In order to compare our results to other climate‐related impacts reported in the 2017 CIRA report, we select future scenarios and meteorological projections to be consistent with the CIRA framework. Projections of 2006–2099 monthly mean SPEI02 are calculated using statistically downscaled meteorological output from six global climate models participating in the Coupled Model Intercomparison Project Phase 5 (CMIP5; Taylor et al., 2011) and two plausible scenarios of GHG emissions and atmospheric concentrations, RCP4.5 and RCP8.5. RCP8.5 represents a high GHG concentration scenario, in which radiative forcing rises to 8.5 W/m2 by 2100 relative to 1750, and global temperature is projected to increase by 3–5.5 °C by 2100 relative to the 1986–2005 average. Trends in global emissions over the past 15–20 years have been most consistent with RCP8.5 (Hayhoe et al., 2017). RCP4.5 represents a lower GHG concentration scenario in which radiative forcing stabilizes at 4.5 W/m2 shortly after 2100, and global temperature is projected to increase by 1.1–2.6 °C by 2100 (van Vuuren et al., 2011). The six models used are CanESM2 (von Salzen et al., 2013), CCSM4 (Gent et al., 2011), GFDL‐CM3 (Donner et al., 2011), GISS‐E2‐R (Schmidt et al., 2006), HadGEM2‐ES (Collins et al., 2011), and MIROC5 (Watanabe et al., 2010). These models project a range of plausible outcomes based on varying assumptions and parameterizations of the Earth system's response to GHG forcing. Additional information on CMIP5 model selection is provided in the supporting information.
To better capture regional‐scale hydroclimate impacts and extremes, we use downscaled daily precipitation and maximum and minimum temperature of these six models from the Localized Constructed Analogs data set (Pierce et al., 2015), regridded to (1/8)° × (1/8)° from (1/16)° × (1/16)°. Projected changes in SPEI02 relative to the reference period are averaged over selected domains for each dust fraction and season (black boxes in Figures 1 and 2). We then apply the linear sensitivities derived in section 2.1 to estimate changes in FD and CD concentrations averaged across the U.S. Southwest domain by season, before calculating annual mean changes. We focus on 20‐year averaged changes centered around 2030, 2050, 2070, and 2090 relative to 1986–2005. The six downscaled models show varying abilities in capturing the long‐term mean of and interannual variability in seasonal mean SPEI02 values averaged over southwestern North America during the historical reference period (Figure S3). We find that the individual model means fall within ±0.15 of the observed mean, with the multimodel means being slightly biased toward drier conditions (~0.03–0.15 lower than the observed mean), depending on the season (SPEI drought scales are reported with increments of 0.5–1).
Figure 2.
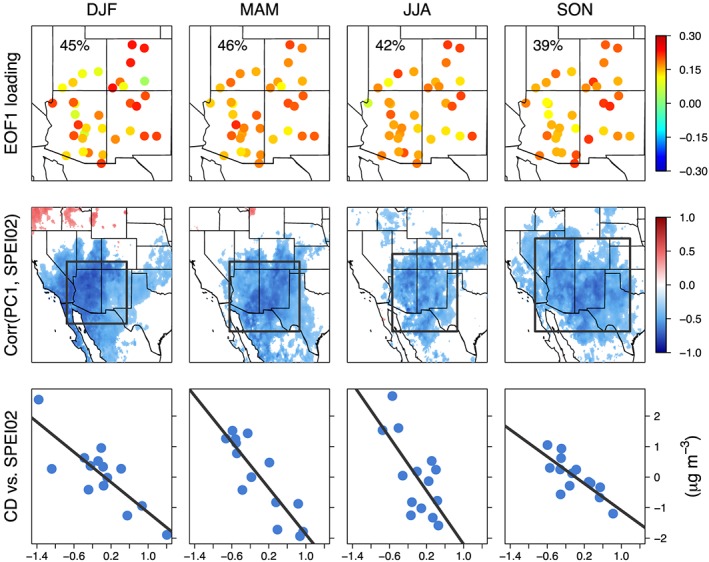
As in Figure 1 but for coarse dust (CD).
In A2018, downscaled projections from the bias‐corrected and spatially disaggregated CMIP5 Climate and Hydrology Projections (BCSD5), provided at monthly and (1/8)° × (1/8)° resolutions, were used (Reclamation, 2014). The Localized Constructed Analogs data set presents a more up‐to‐date product at finer temporal and spatial resolution that relies on an improved bias‐correction technique (Pierce et al., 2015). Since the CIRA framework only considers a subset of models and RCPs due to computational, time, and resource constraints (U.S. EPA, 2017a), the six models considered here are a subset of the 22 included by A2018. Changes in regional mean SPEI02 over southwestern North America projected by the subset of six models capture the lower limits (i.e., smallest decreases in SPEI02) of the full range but fall below the upper limits projected by other models not considered here.
For the analysis conducted in sections 2.1 and 2.2, we use p < 0.05 as the threshold for statistical significance.
2.3. Health Impacts Assessment and Economic Valuation
We use the EPA's Environmental Benefits Mapping and Analysis Program‐Community Edition (BenMAP‐CE; U.S. EPA, 2018b) to quantify the health impacts of projected exposures to FD and CD in the U.S. Southwest. The BenMAP‐CE program requires information on pollutant concentrations, geographic area, population, baseline incidence, epidemiological concentration‐response relationships, and economic valuation relationships. Since further studies are needed to quantify the relative risks associated with FD and CD exposures, we use relatively well constrained relationships drawn from epidemiological studies of total PM2.5 and PM2.5‐10. We apply the following equations to calculate the health impacts attributable to FD or CD exposure within BenMAP‐CE:
| (1) |
| (2a) |
| (2b) |
In equation (1), yi is the sum of excess dust‐attributable health impacts within the exposed population in the study domain for a given health endpoint i during a specific era (20 years centered around 2030, 2050, 2070, or 2090) relative to the historical reference period, k is the total number of 50 × 50‐km grid cells in the study domain, and a represents the population subgroups in each grid cell k. Equations (2a) and (2b) represent the concentration‐response functions (CRFs) with a log‐linear(2a) or logistic (2b) form. In these equations, yika is the excess number of dust‐attributable health impacts for a given health endpoint i within an exposed population subgroup a in a grid cell k, incidenceika is the baseline incidence rate of a given health endpoint i being measured in grid cell k for population subgroup a, βi is the concentration‐response parameter relating a change in a given health impact risk with a change in exposure to dust, dust is the annual mean FD or CD concentration, and Pka is the population subgroup (broken into 5‐year age bins) within a grid cell.
For each health endpoint, we perform three sets of calculations: (1) The historical reference burden is estimated using the 1988–2005 annual mean FD or CD concentration combined with 2010 population and baseline incidence rates (IMPROVE measurements are only available from 1988 onward); (2) the “AQ constant” scenario considers projected changes in population and baseline incidence rates for each era while dust concentrations are held constant at the reference value; and (3) the “RCP” scenarios consider projected changes in dust concentrations, population, and baseline incidence rates all together—that is, FD or CD concentration is calculated as the annual mean increase under each RCP scenario on top of the reference average concentration. The difference between (3) and (1) represents the excess burden relative to the reference estimate due to projected changes in all three variables (dust concentrations, population, and baseline incidence rates). The proportion of this excess burden arising from expected changes in population and baseline incidence rates is given by (2)‐(1), and the proportion due to climate‐driven changes in dust concentrations is given by (3)‐(2). The same projections of population, baseline incidence rate, and valuation parameters are applied to the two RCPs in (3) so that differences between the RCP scenarios are only due to those in climate‐driven meteorological changes and not socioeconomic factors. Since the model spread is much larger than the uncertainty intervals of relative risk estimates (see Figures S4 and S5), we report uncertainty ranges for the health burden and valuation estimates in terms of the lowest and highest values projected by the CMIP5 model ensemble. Additional data inputs to BenMAP‐CE are described below.
2.3.1. Air Quality
To calculate the reference pollutant concentrations, we use the 1988–2005 seasonal mean concentrations of FD and CD measured at each of the 35 monitoring sites. To calculate the projected dust concentrations for each era, RCP scenario, and CMIP5 model, the regional and seasonal mean 20‐year increment of FD or CD concentration is uniformly added to the reference concentration at each monitoring site. The Voronoi Neighborhood Averaging interpolation method (without setting a maximum distance) is used to grid the reference and projected FD and CD concentrations across our study domain (U.S. EPA, 2018a).
2.3.2. Population
For the reference period, we use 2010 population estimates from BenMAP‐CE v.1.4.14, which were derived from the U.S. Census Bureau (U.S. EPA, 2017b). For the 2030, 2050, 2070, and 2090 eras, we use population projections derived for each 5‐year age group at the county level using the EPA's Integrated Climate and Land Use Scenarios v.2 (ICLUSv2) model (Bierwagen et al., 2010; U.S. EPA, 2017b). The ICLUSv2 model disaggregates national population projections from the Median Variant Projection of the United Nations, UN, 2015 World Population Prospects data set (United Nations, 2015), with regional projections parameterized under the Shared Socioeconomic Pathway 2 storyline, which assumes moderate levels of fertility, mortality, and international immigration (O'Neill et al., 2014). The impacts of climate change are not factored into the national‐level projections provided by the UN but are accounted for by the ICLUSv2 model in the development of county‐level population size and demographics (i.e., age, gender, and race) from the national‐level UN projections.
2.3.3. Baseline Incidence Rates
County‐level baseline incidence rates were obtained from BenMAP‐CE v.1.4.14 for 5‐year age groups and were originally derived from CDC WONDER (U.S. EPA, 2018b). We apply 2010 mortality rates for the reference period and match the appropriate mortality rate projections for the 2030 and 2050 eras. As the CDC mortality rates were projected only through 2060, we apply 2060 mortality rates to the 2070 and 2090 era analyses. Baseline morbidity rates are available only for 2014, so these rates are assumed constant across all eras. The reference and projected total incidence and population values for each era are displayed in Table S2.
2.3.4. CRFs
We analyze separate health endpoints for FD and CD, focusing on outcomes with the most robust epidemiological evidence for total PM in the two size fractions. For FD, we consider all‐cause, cardiopulmonary, and lung cancer mortality, using CRFs from Krewski et al. (2009). We also consider two morbidity endpoints, cardiovascular and respiratory hospital admissions, using CRFs from Zanobetti et al. (2009). Within the cardiovascular subgroup, nonfatal acute myocardial infarctions are calculated separately following Peters et al. (2001). Except for the addition of nonfatal myocardial infarction, these CRFs are consistent with those used in A2018. For CD, we apply CRFs derived from two multicity studies conducted in California (Malig et al., 2013; Malig & Ostro, 2009) for two health endpoints: cardiovascular mortality and asthma emergency department (ED) visits. These studies reported significant associations between short‐term PM2.5‐10 exposure and cardiovascular mortality and asthma ED visits, which were most robust for 2‐day lag and showed little evidence of confounding due to PM2.5 or other common air pollutants. The CRFs employ a log‐linear (equation (2a)) or logistic (equation (2b)) relationship between health outcome and pollutant concentrations. Further details are shown in Tables S3 and S4.
2.3.5. Estimating the Economic Value of Health Impacts
We estimate the economic value of projected health impacts based on recommendations in federal guidance for economic analyses (U.S. EPA, 2014) and valuation functions included in the BenMAP‐CE model. Such economic analyses consider the “willingness to pay” of individuals, which accounts for the amounts individuals are willing to pay for small reductions in mortality risk (“Value of Statistical Life (VSL)”) and the changes in VSL over time as real income grows (“income elasticity” of willingness to pay). For mortality endpoints, the EPA's Guidelines for Preparing Economic Analyses recommends a VSL of $7.9 million (2008$) based on 1990 incomes (U.S. EPA, 2014). To create a VSL using 2015$ and based on 2010 incomes, the standard value was adjusted for inflation and income growth based on the approach described in EPA's BenMAP‐CE model and its documentation (U.S. EPA, 2018a, 2018b). The resulting value, $9.7 million for 2010 (2015$), was adjusted to future years by assuming an income (gross domestic product per capita) elasticity of VSL of 0.4. Projections of U.S. population change are described in section 2.3.2, and the Emissions Predictions and Policy Analysis model (version 6; Chen et al., 2015) was run to generate a projection of economic growth. Applying this standard approach yields the following VSL values: $11.0 million in 2030, $12.4 million in 2050, $13.8 million in 2070, and $15.2 million in 2090 (in undiscounted 2015$). As more recent literature favors a higher estimate of income elasticity of VSL (see supporting information), we also perform a sensitivity test using an elasticity of 1.0, reflecting proportional growth in VSL with gross domestic product per capita. Using an elasticity of 1.0 compared with 0.4, our estimated costs associated with the mortality burdens are 16% higher in 2030 and 87% higher in 2090 (Table S7). The sensitivity analysis suggests that our valuation of the mortality endpoints may be conservative.
For morbidity endpoints, we use cost‐of‐illness estimates for each endpoint type available in BenMAP‐CE. For all hospital admissions endpoints, BenMAP‐CE uses estimates of hospital charges and lengths of hospital stays based on discharge statistics provided by the Agency for Healthcare Research and Quality's Healthcare Utilization Project National Inpatient Sample database (2007; U.S. EPA, 2018b). Estimates were adjusted from 2007$ to 2015$ using BenMAP‐CE's default inflation index. For asthma‐related ED visits, we use the mean estimate from Smith et al. (1997) and Stanford et al. (1999), adjusted to 2015$. Estimates for nonfatal myocardial infarction rely on the mean estimate from Russell et al. (1998) and Wittels et al. (1990) and include both the direct medical cost and the future income loss over 5 years associated with the incidence of myocardial infarction (see U.S. EPA, 2018b, for further details). The future income loss associated with myocardial infarction is discounted back to the point of incidence using a 3% discount rate to develop a “lump‐sum” unit value in the year of incidence. Note that our valuation estimates for all the short‐term effects (hospital admissions and ED visits) are not themselves discounted and reflect the economic damages in the year of incidence.
3. Results
3.1. Historical Sensitivity of Ambient Dust Levels to Drought Conditions
We first perform EOF analysis to obtain the dominant patterns of variability in 2000–2013 monthly mean FD concentrations measured at 35 IMPROVE sites across the U.S. Southwest. As in A2018, we find that the most dominant EOF mode (EOF1) displays a coherent regional pattern of interannual variability, capturing 37–53% of the total variance (Figure 1). The principal component time series associated with EOF1 (PC1) are significantly negatively correlated to SPEI02 anomalies across southwestern North America, with the spatial pattern and strength of correlation varying by season. Regions of significant correlation encompass areas of known active dust sources, including the Great Basin, Mohave, Sonoran, and Chihuahuan Deserts, as well as the semiarid Columbia Plateau, Colorado Plateau, and southern Great Plains, which have been disturbed by human activities to varying extents (Brahney et al., 2013; Jewell & Nicoll, 2011; Neff et al., 2008; Reynolds et al., 2007; Rivera Rivera et al., 2010; Tanaka & Chiba, 2006).
Between 2000 and 2013, the 35 IMPROVE sites located in our domain of interest started operating at different times and have varying intervals of missing data. Since a large proportion of the interannual variability in monthly mean FD concentrations for a given season displays regional coherence, we quantify the sensitivity of FD anomalies to SPEI02 using regional and seasonal means. In general, this leads to more robust sensitivities than at subregional or site‐specific spatial scales. FD anomalies are averaged across the U.S. Southwest, and SPEI02 anomalies are averaged across domains in which the strongest correlations between PC1 and SPEI02 are observed for different seasons (all within 28–40°N and 117–103°W, outlined by black boxes in Figure 1, middle row panels). As shown in Table 1, we find that a unit decrease in SPEI02 is significantly associated with increases of 0.22–0.44 μg/m3 in FD concentrations, depending on the season. These linear regression fits capture 48–72% of the total variance in seasonal and regional mean FD anomalies.
Table 1.
Sensitivity of Seasonal Mean FD and CD to SPEI02 Anomalies
| Dust fraction | Season | Linear regression fit | 95% CI of slope | R 2 |
|---|---|---|---|---|
| Fine dust | DJF | ΔFD = −0.22 × ΔSPEI02 + 0.01 | −0.11, −0.34 | 0.72 |
| MAM | ΔFD = −0.41 × ΔSPEI02 − 0.01 | −0.28, −0.58 | 0.71 | |
| JJA | ΔFD = −0.44 × ΔSPEI02 | −0.16, −0.67 | 0.48 | |
| SON | ΔFD = −0.23 × ΔSPEI02 | −0.13, −0.32 | 0.56 | |
| Coarse dust | DJF | ΔCD = −1.23 × ΔSPEI02 + 0.08 | −0.41, −1.66 | 0.68 |
| MAM | ΔCD = −1.89 × ΔSPEI02 + 0.02 | −1.36, −2.35 | 0.77 | |
| JJA | ΔCD = −2.19 × ΔSPEI02 − 0.01 | −0.76, −3.56 | 0.46 | |
| SON | ΔCD = −1.10 × ΔSPEI02 + 0.01 | −0.55, −1.50 | 0.60 |
Note. FD and CD anomalies (units of micrograms per cubic meter) are averaged over the Southwest domain; SPEI02 anomalies (unitless) are averaged over different domains within 25–41°N and 117–98°W for each season (see Figures 1 and 2). The 95% confidence interval (CI) of the slope value is calculated by bootstrap resampling. CD = coarse dust; FD = fine dust; DJF = December–February; MAM = March–May; JJA = June–August; SON = September–November; SPEI = Standardized Precipitation‐Evapotranspiration Index.
Results for the EOF‐correlation‐regression analysis for CD are very similar to those for FD (Figure 2). The most dominant EOF modes of monthly mean CD concentrations also exhibit in‐phase covariability across the U.S. Southwest, capturing 39–46% of the total variance depending on the season. This result indicates that ambient concentrations of dust particles in the coarse fraction are also influenced by large‐scale controlling factors and/or source emissions. The PC1 time series are significantly and extensively correlated to SPEI02 across southwestern North America, especially within 29–41°N and 117–98°. A unit decrease in SPEI02 is significantly associated with increases of 1.10–2.19 μg/m3 in CD concentrations, depending on the season (Table 1). These linear regression fits capture 46–77% of the total variance in seasonal and regional mean CD anomalies.
3.2. Projected Changes in Ambient Dust Levels Due to Changes in Aridity
We project regional mean changes in FD and CD concentrations due to changes in SPEI02 between 2006 and 2099 relative to 1986–2005, using the equations shown in Table 1. Figure 3 shows the 20‐year averaged annual mean changes in FD and CD concentrations centered around 2030, 2050, 2070, and 2090 under RCP4.5 and RCP8.5 for the six CMIP5 models considered in this study (full time series are displayed in Figures S6 and S7). For context, observed 1988–2005 annual mean FD and CD concentrations averaged across the U.S. Southwest are 0.72 and 5.26 μg/m3, respectively (CD is approximated from total coarse mass concentration). The multimodel mean increases in FD and CD concentrations for each era and RCP scenario combination are all statistically significant. Under RCP8.5, regional mean FD concentration is projected to increase by 30% (0.22 μg/m3) in 2050 and by 57% (0.41 μg/m3) in 2090, relative to the reference period. Regional mean CD concentration is projected to increase by 22% (1.14 μg/m3) in 2050 and by 38% (1.98 μg/m3) in 2090. In terms of individual model projections, GFDL‐CM3 yields the highest increases in dust concentrations for both RCP scenarios across all eras, whereas GISS‐E2‐R yields the lowest increases, except for three instances in which CanESM2 projects the lowest increases (RCP8.5 2070 for FD and RCP8.5 2070–2090 for CD).
Figure 3.
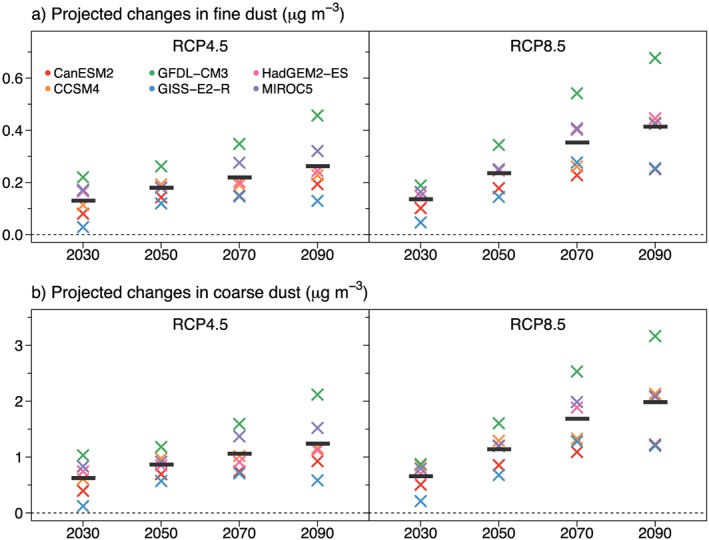
Projected changes in annual mean (a) fine dust and (b) coarse dust averaged over the U.S. southwest under RCP4.5 and RCP8.5 scenarios due to changes in the drought index, SPEI02. Changes are calculated as 20‐year averages centered around 2030, 2050, 2070, and 2090 relative to 1986–2005. Different colored symbols denote results from the six different CMIP5 models, and the thick horizontal black lines show the multimodel means. The multimodel mean values are all statistically significant, as determined by a Student's t test (p < 0.05). RCP = Representative Concentration Pathway; CMIP5 = Coupled Model Intercomparison Project Phase 5.
Projected changes in dust concentrations under the two RCP scenarios start to diverge around midcentury, following the projected decreases in SPEI02 (Figure S8). Between 2006 and 2050, the multimodel mean SPEI02 values generally decrease under both RCP scenarios. However, this decreasing trend plateaus around midcentury at a value of −0.7 (“mild drought”) under RCP4.5 but continues to decrease under RCP8.5, reaching a value of around −1.1 (“moderately dry”) toward the end of this century. Projected increases in both FD and CD concentrations are approximately 30% larger in 2050 and 60% larger in 2090 under RCP8.5 compared to RCP4.5.
3.3. Health Impacts of Projected Changes in Dust Concentrations
Table 2 shows the health burdens attributable to FD and CD exposures for each endpoint in the reference period and the excess burdens estimated at each 20‐year era due to changes in population and baseline incidence rates (AQ constant) or to the combined changes in population, baseline incidence rates, and dust concentrations under each RCP scenario. Figures 4 and 5 show the total annual number of incident cases attributable to FD and CD exposures, respectively, at each 20‐year era under the AQ constant or RCP scenarios. The uncertainty ranges displayed reflect the lowest and highest estimates from the CMIP5 ensemble for a given RCP and era, reflecting variability across climate models rather than the uncertainty within any one model. In the following discussion, we focus on four health endpoints: (1) FD‐attributableall‐cause mortality for adults aged 30 years and older; (2) FD‐attributable hospital admissions related to cardiovascular, acute myocardial infarction, and respiratory disorders for adults aged 65 years and older; (3) CD‐attributable cardiovascular mortality for all ages; and (4) CD‐attributable asthma ED visits for all ages. All reported values represent 20‐year averages rounded to two significant figures.
Table 2.
Annual Mortality and Morbidity Attributable to Fine and Coarse Dust Exposures
| Pollutant | Health endpoint | Age (years) | Reference burden (per year) | Future scenario | 20‐year averaged excess burden relative to reference (per year) | |||
|---|---|---|---|---|---|---|---|---|
| 2030 | 2050 | 2070 | 2090 | |||||
| Fine dust | Hospitalization, cardiovascular less myocardial infarctions | 65–99 | 130 | AQ constant | 110 | 210 | 270 | 310 |
| RCP4.5 | 140 (120,160) | 260 (250,290) | 350 (320,390) | 410 (360,490) | ||||
| RCP8.5 | 140 (120,150) | 280 (250,310) | 390 (350,460) | 470 (410,570) | ||||
| Hospitalization, nonfatal acute myocardial infarction | 65–99 | 340 | AQ constant | 280 | 530 | 660 | 770 | |
| RCP4.5 | 351 (300,400) | 670 (620,730) | 860 (790,970) | 1000 (900,1200) | ||||
| RCP8.5 | 354 (310,380) | 710 (640,790) | 980 (870,1100) | 1200 (1000,1500) | ||||
| Hospitalization, respiratory | 65–99 | 130 | AQ constant | 110 | 210 | 270 | 320 | |
| RCP4.5 | 140 (120,160) | 260 (250,290) | 350 (320,400) | 420 (370,500) | ||||
| RCP8.5 | 140 (120,150) | 280 (250,310) | 400 (350,460) | 480 (420,590) | ||||
| Mortality, all‐cause | 30–99 | 840 | AQ constant | 290 | 680 | 920 | 1100 | |
| RCP4.5 | 420 (320,510) | 930 (850,1100) | 1300 (1200,1500) | 1600 (1300,2000) | ||||
| RCP8.5 | 430 (340,480) | 1000 (880,1200) | 1500 (1300,1800) | 1900 (1600,2400) | ||||
| Mortality, cardiopulmonary | 30–99 | 750 | AQ constant | 180 | 580 | 820 | 1000 | |
| RCP4.5 | 290 (210,370) | 800 (730,900) | 1200 (1000,1300) | 1400 (1200,1800) | ||||
| RCP8.5 | 290 (220,340) | 870 (750,1000) | 1400 (1200,1600) | 1700 (1400,2100) | ||||
| Mortality, lung cancer | 30–99 | 100 | AQ constant | 21 | 34 | 43 | 58 | |
| RCP4.5 | 35 (24,44) | 55 (48,64) | 70 (62,87) | 94 (76,120) | ||||
| RCP8.5 | 35 (26,41) | 61 (50,74) | 87 (72,110) | 120 (93,150) | ||||
| Coarse dust | Emergency department visits, asthma | 0–99 | 1700 | AQ constant | 230 | 470 | 710 | 810 |
| RCP4.5 | 400 (260,510) | 740 (650,830) | 1100 (950,1300) | 1300 (1000,1600) | ||||
| RCP8.5 | 410 (290,470) | 820 (680,970) | 1300 (1100,1600) | 1500 (1200,1900) | ||||
| Mortality, cardiovasculara | 0–99 | 460 | AQ constant | 120 | 370 | 520 | 640 | |
| RCP4.5 | 170 (130,210) | 480 (440,520) | 680 (630,760) | 850 (740,1000) | ||||
| RCP8.5 | 180 (140,200) | 510 (460,570) | 770 (690,900) | 970 (840,1200) | ||||
Note. The historical reference burdens are estimated using 2010 population and baseline incidence rates combined with 1988–2005 dust concentrations. Values shown for future scenarios at 20‐year intervals are the excess burden relative to the reference value. “AQ constant” projections are due to the effects of changing population and baseline incidence rates. Representative Concentration Pathway (RCP) projections are due to the combined effects of changing dust concentrations, population, and baseline incidence rates. For each health endpoint and 20‐year era, the total number of incident cases is equal to the sum of the reference burden and the excess burden projected for each future scenario. Values in parentheses represent the range of variability in the Coupled Model Intercomparison Project Phase 5 (CMIP5) model ensemble for a given RCP scenario. Values are rounded to two significant figures.
Cardiovascular mortality endpoint approximated from cardiopulmonary incidence.
Figure 4.
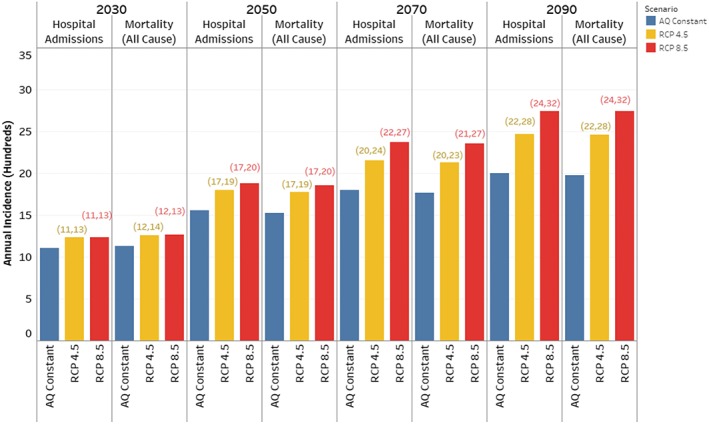
Total annual incidence (sum of reference and excess burdens) attributable to fine dust exposure. The “AQ constant” scenarios (blue) are calculated using 1988–2005 fine dust concentrations combined with projected population and baseline incidence rates. The Representative Concentration Pathway (RCP) scenarios (RCP4.5 = yellow; RCP8.5 = red) consider the combined influence of projected increases in population, baseline incidence rates, and fine dust concentrations estimated from the ensemble mean of six Coupled Model Intercomparison Project Phase 5 (CMIP5) models for each RCP scenario. The health endpoints shown here are the sum of hospital admissions (for adults aged ≥65 years) related to cardiovascular, acute myocardial infarction, and respiratory subgroups, and all‐cause mortality (for adults ≥30 years). The parentheses display the lowest and highest estimates based on the CMIP5 range.
Figure 5.
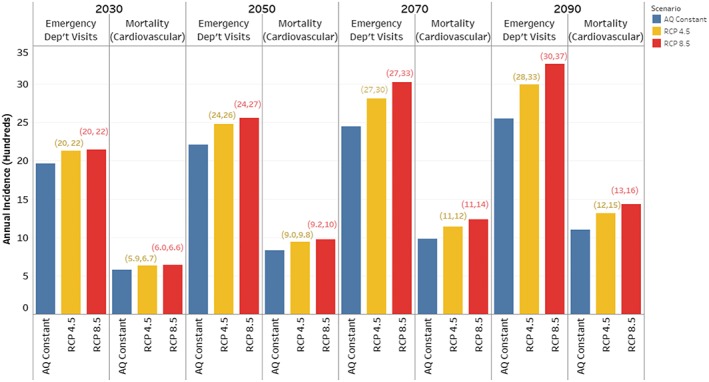
As in Figure 4 but for coarse dust. The health endpoints shown here are asthma emergency department visits and cardiovascular mortality for all ages.
In 2090 under RCP8.5 relative to the reference period, we estimate that annual FD‐attributable mortality could increase by 230% (1,900 deaths per year) and hospital admissions could increase by 360% (2,200 admissions per year). The majority of FD‐attributable premature mortality stems from cardiopulmonary‐related deaths and has the highest incidence rates for adults aged 75 years and older (Table S5). Even though hospitalization rates are held constant at 2014 values, the percentage increase in FD‐attributable hospitalizations is greater than those in premature mortality because the elderly population size is expected to become much larger. The U.S. Southwest population is projected to increase by 170% for adults aged ≥30 years and by 310% for adults aged ≥65 years (Table S2). Annual CD‐attributable cardiovascular mortality could increase by 210% (970 deaths per year) and asthma ED visits could increase by 88% (1,500 visits per year). Climate‐driven changes in FD and CD concentrations alone can account for 34–47% of these increases (1,100 deaths and 1,400 hospital admissions and ED visits per year for FD and CD‐related impacts combined), with the remaining fractions due to changes in population and baseline incidence rates. The highest incidence rates of CD‐attributable cardiovascular mortalities and asthma ED visits are found in adults aged above 75 years and children aged 0–17 years, respectively, reflecting the differentiated vulnerability of different age groups to these health endpoints (Table S5). Summing up the health impacts of FD and CD together, dust‐attributable premature mortality could increase by 220% and hospital admissions/visits could increase by 160% toward the end of this century, due to combined increases in population, baseline incidence rates, and dust levels.
In all future eras, the projected dust‐attributable mortality and morbidity are larger under RCP8.5 than RCP4.5, with the differences between the two RCP scenarios growing over time. The total excess dust‐related mortality and morbidity burdens are ~20% higher (400 deaths per year and 540 hospital admissions and ED visits per year) in 2090 under RCP8.5 relative to RCP4.5. If the expected increases in population and baseline incidence rates are accounted for (i.e., comparing the excess burdens due to climate‐driven changes in dust concentrations alone), this percentage difference becomes ~60%. Given that drought‐driven increases in dust concentrations are projected to grow over the 21st century, we find that between 2050 and 2090 under RCP8.5, the excess burdens relative to the reference period of FD‐attributable mortality and hospitalization grow by 90% (900 deaths per year) and 69% (880 admissions per year), respectively, and CD‐attributable mortality and ED visits grow by 90% (460 deaths per year) and 83% (680 visits per year), respectively.
Comparing the magnitudes of the excess burdens of FD‐attributable cardiopulmonary mortality attributable to the CD‐attributable cardiovascular mortality (which is approximated using cardiopulmonary incidence rates), the FD‐attributable burdens are larger under all future scenarios and eras despite being quantified for a smaller population subset (30 years or older versus all age groups). The main reason for this is the higher relative risk value associated with PM2.5‐related cardiopulmonary mortality (1.13 per 10 μg/m3) compared to PM2.5‐10‐related cardiovascular mortality (1.01 per 10 μg/m3).
3.4. Economic Damages of Dust‐Attributable Mortality and Morbidity
The total annual economic damages associated with FD‐attributable health outcomes (all‐cause mortality and cardiovascular, acute myocardial infarction, and respiratory hospital admissions) and with CD‐attributable health outcomes (cardiovascular mortality and asthma ED visits) are displayed in Figure 6 (see Table S6 for a breakdown of the excess damages associated with each health endpoint). The annual value of total damages for the reference period is estimated to be $13 billion per year (2015$). Under RCP8.5, additional damages of $22 billion per year and $47 billion per year are estimated in 2050 and 2090, respectively. Climate‐driven changes in FD and CD concentrations alone account for 27% of these excess values in 2050 and for 36% in 2090, with the rest due to changes in population and baseline incidence rates. The additional total damages under RCP8.5 exceed those under RCP4.5 for all eras, with the differences growing over time. The total excess damages are ~16% higher ($6.4 billion per year) in 2090 under RCP8.5 relative to RCP4.5. If the expected increases in population and baseline incidence rates are accounted for (i.e., comparing the excess damages due to climate‐driven changes in dust concentrations alone), this percentage difference becomes ~60%. Nearly all (>99%) of total damages estimated for the reference period and future scenarios arise from FD‐ and CD‐attributable mortality, with the majority (around two thirds) due to FD.
Figure 6.
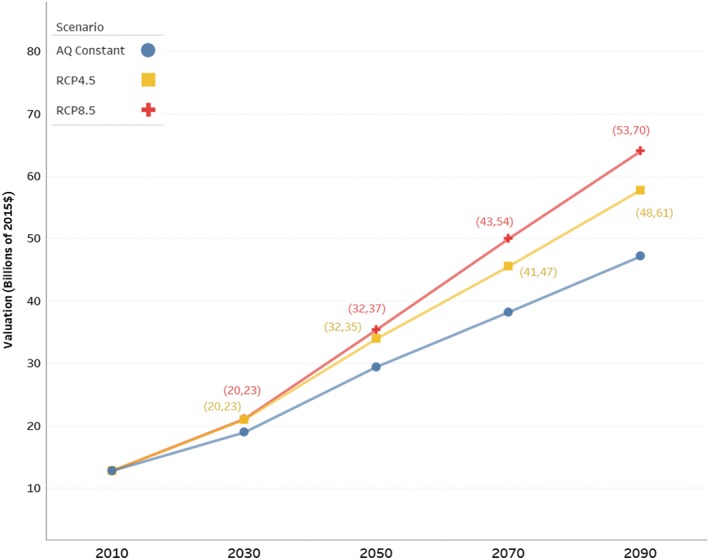
Total annual economic damages of health impacts related to fine and coarse dust exposures. Damages are summed across the following mortality and morbidity endpoints: fine‐dust‐attributable all‐cause mortality and cardiovascular, acute myocardial infarction, and respiratory hospital admissions; and coarse dust‐attributable cardiovascular mortality and asthma emergency department visits. The parentheses display the lowest and highest estimates based on the Coupled Model Intercomparison Project Phase 5 range. See Figure 4 for description of AQ constant and Representative Concentration Pathway (RCP) scenarios.
4. Discussion
We estimate that in the historical reference period (1986–2005), FD and CD exposures are associated with 1,300 premature deaths per year in the U.S. Southwest, which are associated with economic damages valued at $13 billion per year (2015$). Under RCP8.5, this burden could increase by 120% (1,500 deaths per year) in 2050 and by 220% (2,900 deaths per year) in 2090 due to projected changes in population, baseline incidence rates, and dust concentrations, resulting in additional economic damages of $22 billion per year in 2050 and $47 billion per year in 2090. Climate‐driven increases in dust concentrations alone account for ~30% of these excess impacts in 2050 and for ~40% in 2090. A lower GHG concentration scenario (RCP4.5) could lead to 110 and 400 fewer premature deaths per year in 2050 and 2090, respectively, avoiding economic damages of $1.6 billion per year in 2050 and $6.4 billion per year in 2090. Children are particularly vulnerable to dust‐related asthma exacerbation while the elderly are particularly vulnerable to dust‐related premature mortality.
An advantage of this study is that the results are directly comparable to other national‐ and regional‐scale estimates of public health and economic damages from climate impacts calculated using the CIRA framework. The 2017 CIRA report estimates that in 2090 under RCP8.5, ozone‐related mortality could grow by 110 deaths per year in the Southwest and by 1,700 deaths per year in the United States for all ages (note that the CIRA “Southwest” domain includes California and Nevada in addition to the four states considered in this study; U.S. EPA, 2017a). Mortality attributable to extreme temperature exposure could grow by 2,000 deaths per year in the Southwest for all ages. Our estimated dust‐related mortality burden in 2090 is 26 times larger than that for ozone in the Southwest, 1.7 times larger than that for ozone nationally, and 1.5 times larger than that for extreme temperature in the Southwest. In terms of additional economic damages (in undiscounted 2015$), our dust‐attributable estimate is ~19 times larger than that for ozone and comparable to that for extreme temperature. Additionally, dust‐related asthma ED visits could add another 1,500 visits per year to the national projection of 10,000 excess visits per year due to pollen exposure in 2090 estimated by Neumann et al. (2018). Compared to the annual economic damages of climate impacts projected for various U.S. sectors included in the 2017 CIRA report (Table 28.2) in 2090 under RCP8.5, our dust‐related value of $47 billion per year for four states in the Southwest ranks fourth behind those due to extreme temperature mortality, labor productivity decline, and loss of coastal property at the national scale. (However, note that the CIRA extreme temperature mortality analysis only included 49 major cities, accounting for around one third of the U.S. population.)
This study is an application and extension of the methods presented in A2018 to quantify the impacts of climate‐driven drought conditions on ambient dust levels in the U.S. Southwest. We briefly summarize the differences between the two studies. In A2018, the multimodel mean change in annual mean FD concentration is projected to be 0.35 ± 0.07 μg/m3 (34% increase) under RCP8.5 for 2076–2095 relative to 1996–2015. The projected change in annual mean FD concentration in this study is 0.41 ± 0.16 μg/m3 (57% increase) under RCP8.5 for 2080–2099 relative to 1986–2005. The small difference between these two studies, within the bounds of uncertainty, can be attributed to changes in the baseline period, the number of CMIP5 models considered, and the use of an updated downscaled meteorological projection. The biggest difference in the methodologies of the two studies lies in the health impacts assessment. Previously, A2018 performed the analysis at the regional level and used national‐level projections of mortality incidence rates from the global integrated assessment model International Futures. Here, we improve upon this approach by conducting the assessment at a finer spatial scale (grid cell level) using BenMAP‐CE, with county‐level population and baseline incidence rate estimates. Considering the combined influence of changes in FD concentrations, population, and baseline incidence rates, A2018 estimated by 2095, all‐cause mortality could grow by 750 deaths per year (130%) and hospital admissions related to cardiovascular (less myocardial infarctions) and respiratory illnesses could grow by 860 admissions per year (300%). In this study, the roughly equivalent end‐of‐century projections are 1,900 excess all‐cause deaths per year (230%) and 950 excess admissions per year (360%). The absolute and percentage increases in excess all‐cause mortality estimated here are larger than those in A2018 due to larger increases in both FD concentrations and total mortality incidence. The excess hospitalization estimates in the two studies are comparable. Unlike in A2018, in which future cardiovascular and respiratory morbidity rates were assumed to linearly scale with mortality incidence rates, here we assume no change in morbidity rates over time.
In this study, we choose to consider only the future effects of aridity on ambient dust concentrations, given the strength of evidence in its role in influencing long‐term variations in dust concentrations and the robustness of its response to GHG forcing. However, it remains inconclusive how the hydroclimate of southwestern North America will be influenced by potential changes in the El Niño‐Southern Oscillation and Pacific Decadal Oscillation in response to climate change (Cai et al., 2015; Wang & Li, 2017). In previous work, we did not identify surface wind speed or vegetation as dominant controlling factors of regional‐scale dust activity, perhaps because of the time scales considered or the inability of reanalysis data to resolve local complex terrain and wind dynamics (Achakulwisut et al., 2017). However, other studies have found more significant correlations (Hand et al., 2016; Pu & Ginoux, 2017). We have also not accounted for changes in other potentially important controlling factors such as land use changes (e.g., those associated with increased development or agricultural activities) or the trans‐Pacific transport of Asian dust. Future changes in other controlling factors of dust activity such as the ones listed here may dampen or exacerbate our projections. Future efforts to minimize exposure by climate adaptation or regulatory programs, including dust‐forecasting systems or programs to reduce fugitive dust emissions from agricultural activities, could also reduce some of the projected increases in dust concentrations and/or health impacts.
There will also likely be other health impacts of dust exposure not included in this study. For example, higher ambient dust concentrations could lead to increased exposures of known soil‐borne contaminants in the U.S. Southwest such as heavy metals from mining operations and the Valley Fever‐causing Coccidioides spp. fungi (Centers for Disease Control and Prevention, 2013; Csavina et al., 2012; Gorris et al., 2018). Exposure to desert dust has also been linked to morbidity related to the reproductive and nervous systems (Zhang et al., 2016). Additionally, our reliance on annual mean concentrations and concentration response functions derived from chronic exposure to total PM may not fully capture the health impacts from dust storms (Crooks et al., 2016), though whether the frequency and intensity of such events will increase in the future remains under investigation.
There are also several limitations in our approach. First, due to limited data availability, we use PM2.5‐Iron measurements as a FD proxy and approximate CD concentrations from total coarse PM measurements, which can include other nondust components. Second, we estimate the long‐term health impacts of FD and coarse mass exposures using epidemiological relationships derived for total fine or coarse PM and for the range of present‐day concentrations. Future epidemiological studies targeting soil‐derived particles can help to better constrain the health impacts of ambient dust exposure in the U.S. Southwest. Third, BenMAP‐CE provides projections in mortality incidence rates up to 2060 only and no projections are available for morbidity rates. A few studies suggest that future rates in the next 5–15 years of cardiovascular‐related hospital visits may decrease, while those for respiratory outcomes may increase (Khakban et al., 2017; Rawson et al., 2012). Fourth, in estimating economic damages, we assume that the premature mortality attributable to the FD and CD fractions are additive because there is technically no overlap in the diameter range of the two PM fractions. However, in practice, this issue is still up for debate owing to uncertainties in separating the health impacts attributable to fine and coarse PM in epidemiological studies. Finally, we assume that the dust‐drought relationships derived in the historical reference period will remain constant in the future and use annual mean dust concentrations as a surrogate for daily mean concentrations in assessing some short‐term morbidity impacts (hospital admissions and ED visits). However, these relationships do not account for potential future shifts in the intensity, duration, and frequency of extreme dust events.
The ranges of uncertainties displayed in our health burden and valuation estimates reflect those in the downscaled meteorological outputs of six CMIP5 models. We compare the relative size of uncertainties in three input variables to equations (2a) and (2b)—calculated as percentage differences relative to the central estimate of each variable: relative risk, linear sensitivity of regional mean FD or coarse mass concentrations to SPEI02, and the spread in the CMIP5 model projections of changes in FD or coarse mass concentrations under each RCP scenario (Figures S4 and S5). The relative risk estimates have the narrowest confidence intervals, whereas uncertainties in the other two variables are much larger and comparable. Within the baseline and projected FD and coarse mass concentrations, the health burdens calculated from equation (2a) or (2b) would scale approximately linearly with changes in each of these three variables. We are unable to quantify uncertainties in other input variables including baseline incidence rates and population estimates.
5. Conclusions
Our findings suggest that airborne levels of soil‐derived components of PM may increase in the U.S. Southwest due to increasing aridity, especially under RCP8.5. Future model studies should strive to capture the observed sensitivity of ambient dust concentrations to regional drought conditions. Compared to other U.S. sectors, the estimated economic damages from dust‐related mortality rank fourth behind national‐scale climate impacts on extreme temperature mortality, labor productivity decline, and coastal property loss and should be further studied and potentially considered in future estimates of health damages from climate change in the United States. This climate impact on air quality may also apply to other populated arid regions around the world.
Conflict of Interest
The authors declare no conflicts of interest relevant to this study.
Supporting information
Supporting Information S1
Data Set S1
Data Set S2
Data Set S3
Data Set S4
Data Set S5
Data Set S6
Data Set S7
Data Set S8
Data Set S9
Data Set S10
Data Set S11
Data Set S12
Acknowledgments
This research was funded by the U.S. Environmental Protection Agency (EPA) under contract EP‐D‐14‐031 and the Assistance Agreement 83587501. The views expressed in this document are those of the authors and do not necessarily reflect those of their affiliated institutions, including the EPA. We thank all of the data providers of the data sets used in this study. Aerosol data were provided by the Interagency Monitoring of Protected Visual Environments (IMPROVE; available online at http://vista.cira.colostate.edu/improve). IMPROVE is a collaborative association of state, tribal, and federal agencies and international partners. The U.S. EPA is the primary funding source, with contracting and research support from the National Park Service. The Air Quality Group at the University of California, Davis, is the central analytical laboratory, with ion analysis provided by Research Triangle Institute and carbon analysis provided by Desert Research Institute. The data and analysis codes used are listed in the references and/or provided as supporting information.
Achakulwisut, P. , Anenberg, S. C. , Neumann, J. E. , Penn, S. L. , Weiss, N. , Crimmins, A. , et al. (2019). Effects of increasing aridity on ambient dust and public health in the U.S. southwest under climate change. GeoHealth, 3, 127–144. 10.1029/2019GH000187
References
- Achakulwisut, P. , Mickley, L. J. , & Anenberg, S. C. (2018). Drought‐sensitivity of fine dust in the US Southwest: Implications for air quality and public health under future climate change. Environmental Research Letters, 13(5). 10.1088/1748-9326/aabf20 [DOI] [Google Scholar]
- Achakulwisut, P. , Shen, L. , & Mickley, L. J. (2017). What controls springtime fine dust variability in the western United States? Investigating the 2002–2015 increase in fine dust in the U.S. Southwest. Journal of Geophysical Research: Atmospheres, 122, 12,449–12,467. 10.1002/2017JD027208 [DOI] [Google Scholar]
- Ault, T. R. , Mankin, J. S. , Cook, B. I. , & Smerdon, J. E. (2016). Relative impacts of mitigation, temperature, and precipitation on 21st‐century megadrought risk in the American Southwest. Science Advances, 2(10), e1600873 10.1126/sciadv.1600873 [DOI] [PMC free article] [PubMed] [Google Scholar]
- Bierwagen, B. G. , Theobald, D. M. , Pyke, C. R. , Choate, A. , Groth, P. , Thomas, J. V. , & Morefield, P. (2010). National housing and impervious surface scenarios for integrated climate impact assessments. Proceedings of the National Academy of Sciences, 107(49), 20,887–20,892. 10.1073/pnas.1002096107 [DOI] [PMC free article] [PubMed] [Google Scholar]
- Brahney, J. , Ballantyne, A. P. , Sievers, C. , & Neff, J. C. (2013). Increasing Ca2+ deposition in the western US: The role of mineral aerosols. Aeolian Research, 10, 77–87. 10.1016/j.aeolia.2013.04.003 [DOI] [Google Scholar]
- Cai, W. , Santoso, A. , Wang, G. , Yeh, S. W. , An, S. I. , Cobb, K. M. , Collins, M. , Guilyardi, E. , Jin, F. F. , Kug, J. S. , Lengaigne, M. , McPhaden, M. J. , Takahashi, K. , Timmermann, A. , Vecchi, G. , Watanabe, M. , & Wu, L. (2015). ENSO and greenhouse warming. Nature Climate Change, 5(9), 849–859. 10.1038/nclimate2743 [DOI] [Google Scholar]
- Centers for Disease Control and Prevention (2013). Increase in reported coccidioidomycosis‐United States, 1998 to 2011. Pediatric Infectious Disease Journal, 32(11), 1237–1239. 10.1097/INF.0b013e31829e7a5c [DOI] [PMC free article] [PubMed] [Google Scholar]
- Chen,Y. H. , Paltsev, S. , Reilly, J. , Morris, J. , & Babiker, M. (2015). The MIT EPPA6 Model: Economic growth, energy use, and food consumption (Report No. 278) Cambridge, MA: MIT Joint Program on the Science and Policy of Global Change; https://globalchange.mit.edu/sites/default/files/MITJPSPGC_Rpt278.pdf [Google Scholar]
- Chepil, W. S. (1956). Influence of moisture on erodibility of soil by Wind1. Soil Science Society of America Journal, 20(2), 288–292. 10.2136/sssaj1956.03615995002000020033x [DOI] [Google Scholar]
- Clements, A. L. , Fraser, M. P. , Upadhyay, N. , Herckes, P. , Sundblom, M. , Lantz, J. , & Solomon, P. A. (2014). Chemical characterization of coarse particulate matter in the Desert Southwest‐Pinal County Arizona, USA. Atmospheric Pollution Research, 5(1), 52–61. 10.5094/APR.2014.007 [DOI] [Google Scholar]
- Collins, W. J. , Bellouin, N. , Doutriaux‐Boucher, M. , Gedney, N. , Halloran, P. , Hinton, T. , Hughes, J. , Jones, C. D. , Joshi, M. , Liddicoat, S. , Martin, G. , O&apos;Connor, F. , Rae, J. , Senior, C. , Sitch, S. , Totterdell, I. , Wiltshire, A. , & Woodward, S. (2011). Development and evaluation of an Earth‐System model—HadGEM2. Geoscientific Model Development, 4(4), 1051–1075. 10.5194/gmd-4-1051-2011 [DOI] [Google Scholar]
- Crooks, J. L. , Cascio, W. E. , Percy, M. S. , Reyes, J. , Neas, L. M. , & Hilborn, E. D. (2016). The association between dust storms and daily non‐accidental mortality in the United States, 1993–2005. Environmental Health Perspectives, 124(11), 1735–1743. 10.1289/EHP216 [DOI] [PMC free article] [PubMed] [Google Scholar]
- Csavina, J. , Field, J. , Taylor, M. P. , Gao, S. , Landazuri, A. , Betterton, E. A. , & Saez, A. E. (2012). A review on the importance of metals and metalloids in atmospheric dust and aerosol from mining operations. The Science of the Total Environment, 433, 58–73. 10.1016/j.scitotenv.2012.06.013 [DOI] [PMC free article] [PubMed] [Google Scholar]
- Dawson, J. P. , Bloomer, B. J. , Winner, D. A. , & Weaver, C. P. (2014). Understanding the meteorological drivers of U.S. particulate matter concentrations in a changing climate. Bulletin of the American Meteorological Society, 95(4), 521–532. 10.1175/BAMS-D-12-00181.1 [DOI] [Google Scholar]
- Di, Q. , Dai, L. , & Wang, Y. (2017). Association of short‐term exposure to air pollution with mortality in older adults. JAMA, 318(24), 2446–2456. 10.1001/jama.2017.17923 [DOI] [PMC free article] [PubMed] [Google Scholar]
- Di, Q. , Wang, Y. , Zanobetti, A. , Wang, Y. , Koutrakis, P. , Choirat, C. , et al. (2017). Air pollution and mortality in the Medicare population. New England Journal of Medicine, 376(26), 2513–2522. 10.1056/NEJMoa1702747 [DOI] [PMC free article] [PubMed] [Google Scholar]
- DiCiccio, T. J. , Efron, B. , Hall, P. , Martin, M. A. , Canty, A. J. , Davison, A. C. , Hinkley, D. V. , Gleser, L. J. , Lee, S. M. S. , Young, G. A. , DiCiccio, T. J. , & Efron, B. (1996). Bootstrap confidence intervals. Statistical Science, 11(3), 189–228. 10.1214/ss/1032280214 [DOI] [Google Scholar]
- Donner, L. J. , Wyman, B. L. , Hemler, R. S. , Horowitz, L. W. , Ming, Y. , Zhao, M. , Golaz, J. C. , Ginoux, P. , Lin, S. J. , Schwarzkopf, M. D. , Austin, J. , Alaka, G. , Cooke, W. F. , Delworth, T. L. , Freidenreich, S. M. , Gordon, C. T. , Griffies, S. M. , Held, I. M. , Hurlin, W. J. , Klein, S. A. , Knutson, T. R. , Langenhorst, A. R. , Lee, H. C. , Lin, Y. , Magi, B. I. , Malyshev, S. L. , Milly, P. C. D. , Naik, V. , Nath, M. J. , Pincus, R. , Ploshay, J. J. , Ramaswamy, V. , Seman, C. J. , Shevliakova, E. , Sirutis, J. J. , Stern, W. F. , Stouffer, R. J. , Wilson, R. J. , Winton, M. , Wittenberg, A. T. , & Zeng, F. (2011). The dynamical core, physical parameterizations, and basic simulation characteristics of the atmospheric component AM3 of the GFDL global coupled model CM3. Journal of Climate, 24(13), 3484–3519. 10.1175/2011JCLI3955.1 [DOI] [Google Scholar]
- Droogers, P. , & Allen, R. G. (2002). Estimating reference evapotranspiration under. Irrigation and Drainage Systems, 16(1), 33–45. 10.1023/A:1015508322413 [DOI] [Google Scholar]
- Evan, A. T. , Flamant, C. , Fiedler, S. , & Doherty, O. (2014). An analysis of aeolian dust in climate models. Geophysical Research Letters, 41, 5996–6001. 10.1002/2014GL060545 [DOI] [Google Scholar]
- Fann, N. , Brennan, T. , Dolwick, P. , Gamble, J. L. , Ilacque, V. , Kolb, L. , Nolte, C. G. , Spero, T. L. , & Ziska, L. (2016). Ch. 3: Air Quality Impacts In The impacts of climate change on human health in the United States: A scientific assessment (pp. 69–98). Washington, DC: U.S. Global Change Research Program; 10.10.7930/J0GQ6VP6 [DOI] [Google Scholar]
- Field, J. P. , Belnap, J. , Breshears, D. D. , Neff, J. C. , Okin, G. S. , Whicker, J. J. , Painter, T. H. , Ravi, S. , Reheis, M. C. , & Reynolds, R. L. (2010). The ecology of dust. Frontiers in Ecology and the Environment, 8(8), 423–430. 10.1890/090050 [DOI] [Google Scholar]
- Funk, R. , Reuter, H. I. , Hoffmann, C. , Engel, W. , & Öttl, D. (2008). Effect of moisture on fine dust emission from tillage operations on agricultural soils. Earth Surface Processes and Landforms, 33(12), 1851–1863. 10.1002/esp.1737 [DOI] [Google Scholar]
- Gent, P. R. , Danabasoglu, G. , Donner, L. J. , Holland, M. M. , Hunke, E. C. , Jayne, S. R. , Lawrence, D. M. , Neale, R. B. , Rasch, P. J. , Vertenstein, M. , Worley, P. H. , Yang, Z. L. , & Zhang, M. (2011). The Community Climate System Model Version 4. Journal of Climate, 24(19), 4973–4991. 10.1175/2011JCLI4083.1 [DOI] [Google Scholar]
- Ghio, A. J. , Kummarapurugu, S. T. , Tong, H. , Soukup, J. M. , Dailey, L. A. , Boykin, E. , Ian Gilmour, M. , Ingram, P. , Roggli, V. L. , Goldstein, H. L. , & Reynolds, R. L. (2014). Biological effects of desert dust in respiratory epithelial cells and a murine model. Inhalation Toxicology, 26(5), 299–309. 10.3109/08958378.2014.888109 [DOI] [PubMed] [Google Scholar]
- Gorris, M. E. , Cat, L. A. , Zender, C. S. , Treseder, K. K. , & Randerson, J. T. (2018). Coccidioidomycosis dynamics in relation to climate in the southwestern United States. GeoHealth, 2(1), 6–24. 10.1002/2017GH000095 [DOI] [PMC free article] [PubMed] [Google Scholar]
- Goudie, A. S. (2014). Desert dust and human health disorders. Environment International, 63, 101–113. 10.1016/j.envint.2013.10.011 [DOI] [PubMed] [Google Scholar]
- Hand, J. L. , Gill, T. E. , & Schichtel, B. A. (2017). Spatial and seasonal variability in fine mineral dust and coarse aerosol mass at remote sites across the United States. Journal of Geophysical Research: Atmospheres, 122, 3080–3097. 10.1002/2016JD026290 [DOI] [Google Scholar]
- Hand, J. L. , White, W. H. , Gebhart, K. A. , Hyslop, N. P. , Gill, T. E. , & Schichtel, B. A. (2016). Earlier onset of the spring fine dust season in the southwestern United States. Geophysical Research Letters, 43, 4001–4009. 10.1002/2016GL068519 [DOI] [Google Scholar]
- Hayhoe, K. , Edmonds, J. , Kopp, R. E. , LeGrande, A. N. , Sanderson, B. M. , Wehner, M. F. , & Wuebbles, D. J. (2017). Climate models, scenarios, and projections In Wuebbles D. J., Fahey D. W., Hibbard K. A., Dokken D. J., Stewart B. C., & Maycock T. K. (Eds.), Climate science special report: Fourth national climate assessment, volume I (pp. 133–160). Washington, DC: U.S. Global Change Research Program; 10.7930/J0WH2N54 [DOI] [Google Scholar]
- Ishizuka, M. (2005). An observational study of soil moisture effects on wind erosion at a gobi site in the Taklimakan Desert. Journal of Geophysical Research, 110, D18S03 10.1029/2004JD004709 [DOI] [Google Scholar]
- Jacob, D. J. , & Winner, D. A. (2009). Effect of climate change on air quality. Atmospheric Environment, 43(1), 51–63. 10.1016/j.atmosenv.2008.09.051 [DOI] [Google Scholar]
- Jewell, P. W. , & Nicoll, K. (2011). Wind regimes and aeolian transport in the Great Basin, U.S.A. Geomorphology, 129(1‐2), 1–13. 10.1016/j.geomorph.2011.01.005 [DOI] [Google Scholar]
- Khakban, A. , Sin, D. D. , FitzGerald, J. M. , McManus, B. M. , Ng, R. , Hollander, Z. , & Sadatsafavi, M. (2017). The projected epidemic of COPD hospitalizations over the next 15 years: A population based perspective. American Journal of Respiratory and Critical Care Medicine, 195(3), 287–291. 10.1164/rccm.201606-1162PP [DOI] [PubMed] [Google Scholar]
- Kinney, P. L. (2018). Interactions of climate change, air pollution, and human health. Current Environmental Health Reports, 5(1), 179–186. 10.1007/s40572-018-0188-x [DOI] [PubMed] [Google Scholar]
- Krewski, D. , Burnett, R. T. , Goldberg, M. S. , Hoover, K. , Siemiatycki, J. , Jerrett, M. , & Hoover, B. K. (2000). Reanalysis of the Harvard six cities study and the American cancer society study of particulate air pollution and mortality: Special report. Boston: Health Effects Institute. [Google Scholar]
- Krewski, D. , Jerrett, M. , Burnett, R. T. , Ma, R. , Hughes, E. , Shi, Y. , et al. (2009). Extended follow‐up and spatial analysis of the American Cancer Society study linking particulate air pollution and mortality. Research Report (Health Effects Institute), (140), 5–36. [PubMed] [Google Scholar]
- Livneh, B. , Bohn, T. J. , Pierce, D. W. , Muñoz‐Arriola, F. , Nijssen, B. , Vose, R. , et al. (2015). A spatially comprehensive, meteorological data set for Mexico, the U.S., and southern Canada (NCEI Accession 0129374). Version 1.1. 10.7289/V5X34VF6 [DOI] [PMC free article] [PubMed]
- Malig, B. J. , Green, S. , Basu, R. , & Broadwin, R. (2013). Coarse particles and respiratory emergency department visits in California. American Journal of Epidemiology, 178(1), 58–69. 10.1093/aje/kws451 [DOI] [PubMed] [Google Scholar]
- Malig, B. J. , & Ostro, B. D. (2009). Coarse particles and mortality: Evidence from a multi‐city study in California. Occupational and Environmental Medicine, 66(12), 832–839. 10.1136/oem.2008.045393 [DOI] [PubMed] [Google Scholar]
- Malm, W. C. , Pitchford, M. L. , McDade, C. , & Ashbaugh, L. L. (2007). Coarse particle speciation at selected locations in the rural continental United States. Atmospheric Environment, 41(10), 2225–2239. 10.1016/j.atmosenv.2006.10.077 [DOI] [Google Scholar]
- Malm, W. C. , Schichtel, B. A. , Pitchford, M. L. , Ashbaugh, L. L. , & Eldred, R. A. (2004). Spatial and monthly trends in speciated fine particle concentration in the United States. Journal of Geophysical Research, 109, D06208 10.1029/2003JD003739 [DOI] [Google Scholar]
- Morman, S. A. , & Plumlee, G. S. (2013). Dust and human health: Chapter 15 In Knippertz P. & Stuut J.‐B. W. (Eds.), Mineral dust: A key player in the Earth system (pp. 385–409). Dordrecht, The Netherlands: Springer; 10.1007/978-94-017-8978-3_15 [DOI] [Google Scholar]
- Munson, S. M. , Belnap, J. , & Okin, G. S. (2011). Responses of wind erosion to climate‐induced vegetation changes on the Colorado Plateau. Proceedings of the National Academy of Sciences, 108(10), 3854–3859. 10.1073/pnas.1014947108 [DOI] [PMC free article] [PubMed] [Google Scholar]
- Neff, J. C. , Ballantyne, A. P. , Farmer, G. L. , Mahowald, N. M. , Conroy, J. L. , Landry, C. C. , Overpeck, J. T. , Painter, T. H. , Lawrence, C. R. , & Reynolds, R. L. (2008). Increasing eolian dust deposition in the western United States linked to human activity. Nature Geoscience, 1(3), 189–195. 10.1038/ngeo133 [DOI] [Google Scholar]
- Neumann, J. E. , Anenberg, S. C. , Weinberger, K. R. , Amend, M. , Gulati, S. , Crimmins, A. , Roman, H. , Fann, N. , & Kinney, P. L. (2018). Estimates of present and future asthma emergency department visits associated with exposure to oak, birch, and grass pollen in the United States. GeoHealth, 3(1), 11–27. 10.1029/2018GH000153 [DOI] [PMC free article] [PubMed] [Google Scholar]
- Nolte, C. G. , Dolwick, P. D. , Fann, N. , Horowitz, L. W. , Naik, V. , Pinder, R. W. , et al. (2018). Chapter 13: Air quality In Reidmiller D. R., Avery C. W., Easterling D. R., Kunkel K. E., Lewis K. L. M., Maycock T. K., & Stewart B. C. (Eds.), Impacts, risks, and adaptation in the United States: Fourth national climate assessment, volume II (pp. 512–538). Washington, DC: U.S. Global Change Research Program; 10.7930/NCA4.2018.CH13 [DOI] [Google Scholar]
- O'Neill, B. C. , Kriegler, E. , Riahi, K. , Ebi, K. L. , Hallegatte, S. , Carter, T. R. , Mathur, R. , & van Vuuren, D. P. (2014). A new scenario framework for climate change research: The concept of shared socioeconomic pathways. Climatic Change, 122(3), 387–400. 10.1007/s10584-013-0905-2 [DOI] [Google Scholar]
- Peters, A. , Dockery, D. W. , Muller, J. E. , & Mittleman, M. A. (2001). Increased particulate air pollution and the triggering of myocardial infarction. Circulation, 103(23), 2810–2815. 10.1161/01.CIR.103.23.2810 [DOI] [PubMed] [Google Scholar]
- Pierce, D. W. , Cayan, D. R. , Maurer, E. P. , Abatzoglou, J. T. , & Hegewisch, K. C. (2015). Improved bias correction techniques for hydrological simulations of climate change. Journal of Hydrometeorology, 16(6), 2421–2442. 10.1175/JHM-D-14-0236.1 [DOI] [Google Scholar]
- Pu, B. , & Ginoux, P. (2017). Projection of American dustiness in the late 21st century due to climate change. Scientific Reports, 7(1), 5553 10.1038/s41598-017-05431-9 [DOI] [PMC free article] [PubMed] [Google Scholar]
- Rawson, N. S. B. , Chu, R. , Ismaila, A. S. , & Terres, J. A. R. (2012). The aging Canadian population and hospitalizations for acute myocardial infarction: Projection to 2020. BMC Cardiovascular Disorders, 12(1). 10.1186/1471-2261-12-25 [DOI] [PMC free article] [PubMed] [Google Scholar]
- Reclamation (2014). Downscaled CMIP3 and CMIP5 climate and hydrology projections: Release of hydrologyprojections, Comparison with preceding information, and summary of user needs Denver, CO: U.S. Department of the Interior, Bureau of Reclamation, Technical Services Center. [Google Scholar]
- Reynolds, R. L. , Yount, J. C. , Reheis, M. , Goldstein, H. , Chavez, P. , Fulton, R. , Whitney, J. , Fuller, C. , & Forester, R. M. (2007). Dust emission from wet and dry playas in the Mojave Desert, USA. Earth Surface Processes and Landforms, 32(12), 1811–1827. 10.1002/esp.1515 [DOI] [Google Scholar]
- Rivera Rivera, N. I. , Gill, T. E. , Bleiweiss, M. P. , & Hand, J. L. (2010). Source characteristics of hazardous Chihuahuan Desert dust outbreaks. Atmospheric Environment, 44(20), 2457–2468. 10.1016/j.atmosenv.2010.03.019 [DOI] [Google Scholar]
- Russell, M. W. , Huse, D. M. , Drowns, S. , Hamel, E. C. , & Hartz, S. C. (1998). Direct medical costs of coronary artery disease in the United States. The American Journal of Cardiology, 81(9), 1110–1115. 10.1016/S0002-9149(98)00136-2 [DOI] [PubMed] [Google Scholar]
- Sacks, J. D. , Stanek, L. W. , Luben, T. J. , Johns, D. O. , Buckley, B. J. , Brown, J. S. , & Ross, M. (2011). Particulate matter‐induced health effects: Who is susceptible? Environmental Health Perspectives, 119(4), 446–454. 10.1289/ehp.1002255 [DOI] [PMC free article] [PubMed] [Google Scholar]
- Schmidt, G. A. , Ruedy, R. , Hansen, J. E. , Aleinov, I. , Bell, N. , Bauer, M. , Bauer, S. , Cairns, B. , Canuto, V. , Cheng, Y. , del Genio, A. , Faluvegi, G. , Friend, A. D. , Hall, T. M. , Hu, Y. , Kelley, M. , Kiang, N. Y. , Koch, D. , Lacis, A. A. , Lerner, J. , Lo, K. K. , Miller, R. L. , Nazarenko, L. , Oinas, V. , Perlwitz, J. , Perlwitz, J. , Rind, D. , Romanou, A. , Russell, G. L. , Sato, M. , Shindell, D. T. , Stone, P. H. , Sun, S. , Tausnev, N. , Thresher, D. , & Yao, M. S. (2006). Present‐day atmospheric simulations using GISS ModelE: Comparison to in situ, satellite, and reanalysis data. Journal of Climate, 19(2), 153–192. 10.1175/JCLI3612.1 [DOI] [Google Scholar]
- Smith, D. H. , Malone, D. C. , Lawson, K. A. , Okamoto, L. J. , Battista, C. , & Saunders, W. B. (1997). A national estimate of the economic costs of asthma. American Journal of Respiratory and Critical Care Medicine, 156(3), 787–793. 10.1164/ajrccm.156.3.9611072 [DOI] [PubMed] [Google Scholar]
- Stanek, L. W. , Sacks, J. D. , Dutton, S. J. , & Dubois, J. J. B. (2011). Attributing health effects to apportioned components and sources of particulate matter: An evaluation of collective results. Atmospheric Environment, 45(32), 5655–5663. 10.1016/j.atmosenv.2011.07.023 [DOI] [Google Scholar]
- Stanford, R. , McLaughlin, T. , & Okamoto, L. J. (1999). The cost of asthma in the emergency department and hospital. American Journal of Respiratory and Critical Care Medicine, 160(1), 211–215. 10.1164/ajrccm.160.1.9811040 [DOI] [PubMed] [Google Scholar]
- Tanaka, T. Y. , & Chiba, M. (2006). A numerical study of the contributions of dust source regions to the global dust budget. Global and Planetary Change, 52(1‐4), 88–104. 10.1016/j.gloplacha.2006.02.002 [DOI] [Google Scholar]
- Taylor, K. E. , Stouffer, R. J. , & Meehl, G. A. (2011). An overview of CMIP5 and the experiment design. Bulletin of the American Meteorological Society, 93(4), 485–498. 10.1175/BAMS-D-11-00094.1 [DOI] [Google Scholar]
- Tong, D. Q. , Wang, J. X. L. , Gill, T. E. , Lei, H. , & Wang, B. (2017). Intensified dust storm activity and Valley fever infection in the southwestern United States. Geophysical Research Letters, 44, 4304–4312. 10.1002/2017GL073524 [DOI] [PMC free article] [PubMed] [Google Scholar]
- U.S. Environmental Protection Agency (2009). Integrated Science Assessment (ISA) for particulate matter. Washington, DC: U.S. EPA. [PubMed] [Google Scholar]
- U.S. Environmental Protection Agency (2014). Guidelines for preparing economic analyses. Washington, DC: U.S. EPA. [Google Scholar]
- U.S. Environmental Protection Agency (2015). Climate change in the United States: Benefits of global action. Washington, DC: U.S. EPA. [Google Scholar]
- U.S. Environmental Protection Agency (2017a). Multi‐model framework for quantitative sectoral impacts analysis: A technical report for the fourth national climate assessment. Washington, DC: U.S. EPA. [Google Scholar]
- U.S. Environmental Protection Agency (2017b). Updates to the demographic and spatial allocation models to produce Integrated Climate and Land Use Scenarios (ICLUS) version 2. Washington, DC: U.S. EPA. [Google Scholar]
- U.S. Environmental Protection Agency (2018a). Environmental Benefits Mapping and Analysis Program: Community Edition (BenMAP‐CE) user manual and appendices. Washington, DC: U.S. EPA. [Google Scholar]
- U.S. Environmental Protection Agency (2018b). Environmental Benefits Mapping and Analysis Program: Community Edition (BenMAP‐CE) v 1.4.14. Washington, DC: U.S. EPA. [Google Scholar]
- U.S. Environmental Protection Agency (2018c). Integrated Science Assessment (ISA) for particulate matter (external review draft). Washington, DC: U.S. EPA. [Google Scholar]
- United Nations (2015). World population prospects: The 2015 revision. New York: United Nations Department of Economic and Social Affairs. [Google Scholar]
- U.S. Global Change Research Program (2017). In Wuebbles D. J., Fahey D. W., Hibbard K. A., Dokken D. J., Stewart B. C., & Maycock T. K. (Eds.), Climate science special report: Fourth national climate assessment, volume I. Washington, DC: U.S. Global Change Research Program; 10.7930/J0J964J6 [DOI] [Google Scholar]
- U.S. Global Change Research Program (2018). In Reidmiller D. R., Avery C. W., Easterling D. R., Kunkel K. W., Lewis K. L. M., Maycock T. K., & Stewart B. C. (Eds.), Impacts, risks, and adaptation in the United States: Fourth national climate assessment, volume II. Washington, DC: U.S. Global Change Research Program; 10.7930/NCA4.2018 [DOI] [Google Scholar]
- van Vuuren, D. P. , Stehfest, E. , den Elzen, M. G. J. , Kram, T. , van Vliet, J. , Deetman, S. , Isaac, M. , Klein Goldewijk, K. , Hof, A. , Mendoza Beltran, A. , Oostenrijk, R. , & van Ruijven, B. (2011). RCP2.6: Exploring the possibility to keep global mean temperature increase below 2 °C. Climatic Change, 109(1‐2), 95–116. 10.1007/s10584-011-0152-3 [DOI] [Google Scholar]
- Veranth, J. M. , Reilly, C. A. , Veranth, M. M. , Moss, T. A. , Langelier, C. R. , Lanza, D. L. , & Yost, G. S. (2004). Inflammatory cytokines and cell death in BEAS‐2B lung cells treated with soil dust, lipopolysaccharide, and surface‐modified particles. Toxicological Sciences, 82(1), 88–96. 10.1093/toxsci/kfh248 [DOI] [PMC free article] [PubMed] [Google Scholar]
- Vicente‐Serrano, S. M. , Beguería, S. , & López‐Moreno, J. I. (2010). A multiscalar drought index sensitive to global warming: The standardized precipitation evapotranspiration index. Journal of Climate, 23(7), 1696–1718. 10.1175/2009JCLI2909.1 [DOI] [Google Scholar]
- Vicente‐Serrano, S. M. , Beguería, S. , Lorenzo‐Lacruz, J. , Camarero, J. J. , López‐Moreno, J. I. , Azorin‐Molina, C. , Revuelto, J. , Morán‐Tejeda, E. , & Sanchez‐Lorenzo, A. (2012). Performance of drought indices for ecological, agricultural, and hydrological applications. Earth Interactions, 16(10), 1–27. 10.1175/2012EI000434.1 [DOI] [Google Scholar]
- von Salzen, K. , Scinocca, J. F. , McFarlane, N. A. , Li, J. , Cole, J. N. S. , Plummer, D. , Verseghy, D. , Reader, M. C. , Ma, X. , Lazare, M. , & Solheim, L. (2013). The Canadian Fourth Generation Atmospheric Global Climate Model (CanAM4). Part I: Representation of physical processes. Atmosphere‐Ocean, 51(1), 104–125. 10.1080/07055900.2012.755610 [DOI] [Google Scholar]
- Wang, H. , Rogers, J. C. , & Munroe, D. K. (2015). Commonly used drought indices as indicators of soil moisture in China. Journal of Hydrometeorology, 16(3), 1397–1408. 10.1175/JHM-D-14-0076.1 [DOI] [Google Scholar]
- Wang, J. , & Li, C. (2017). Low‐frequency variability and possible changes in the North Pacific simulated by CMIP5 models. Journal of the Meteorological Society of Japan. Ser. II, 95(3), 199–211. 10.2151/jmsj.2017-011 [DOI] [Google Scholar]
- Wang, Y. , Xie, Y. , Dong, W. , Ming, Y. , Wang, J. , & Shen, L. (2017). Adverse effects of increasing drought on air quality via natural processes. Atmospheric Chemistry and Physics, 17(20), 12,827–12,843. 10.5194/acp-17-12827-2017 [DOI] [Google Scholar]
- Watanabe, M. , Suzuki, T. , O'ishi, R. , Komuro, Y. , Watanabe, S. , Emori, S. , Takemura, T. , Chikira, M. , Ogura, T. , Sekiguchi, M. , Takata, K. , Yamazaki, D. , Yokohata, T. , Nozawa, T. , Hasumi, H. , Tatebe, H. , & Kimoto, M. (2010). Improved climate simulation by MIROC5: Mean states, variability, and climate sensitivity. Journal of Climate, 23(23), 6312–6335. 10.1175/2010JCLI3679.1 [DOI] [Google Scholar]
- Wehner, M. F. , Arnold, J. R. , Knutson, T. , Kunkel, K. E. , & LeGrande, A. N. (2017). Droughts, floods, and wildfires In Wuebbles D. J., Fahey D. W., Hibbard K. A., Dokken D. J., Stewart B. C., & Maycock T. K. (Eds.), Climate science special report: Fourth national climate assessment, volume I, (pp. 231–256). Washington, DC: U.S. Global Change Research Program; 10.7930/J0CJ8BNN [DOI] [Google Scholar]
- Wittels, E. H. , Hay, J. W. , & Gotto, A. M. (1990). Medical costs of coronary artery disease in the United States. The American Journal of Cardiology, 65(7), 432–440. 10.1016/0002-9149(90)90806-C [DOI] [PubMed] [Google Scholar]
- Zanobetti, A. , Franklin, M. , Koutrakis, P. , & Schwartz, J. (2009). Fine particulate air pollution and its components in association with cause‐specific emergency admissions. Environmental Health: A Global Access Science Source, 8(1). 10.1186/1476-069X-8-58 [DOI] [PMC free article] [PubMed] [Google Scholar]
- Zhang, X. , Zhao, L. , Tong, D. , Wu, G. , Dan, M. , & Teng, B. (2016). A systematic review of global desert dust and associated human health effects. Atmosphere, 7(12). 10.3390/atmos7120158 [DOI] [Google Scholar]
Associated Data
This section collects any data citations, data availability statements, or supplementary materials included in this article.
Supplementary Materials
Supporting Information S1
Data Set S1
Data Set S2
Data Set S3
Data Set S4
Data Set S5
Data Set S6
Data Set S7
Data Set S8
Data Set S9
Data Set S10
Data Set S11
Data Set S12