

Abstract
Background.
Total knee arthroplasty is a commonly performed procedure and an important contributor to national healthcare spending. Reducing the incidence of readmission could have important consequences for patient well-being as well as relevant financial implications. Whether regional anesthesia techniques are associated with decreased readmission rates and costs among privately insured patients remains unknown.
Methods.
Using administrative claims data, we identified 138,362 privately insured patients aged 18-64 who underwent total knee arthroplasty between 2002 through 2013. We then examined whether the use of a nerve block was associated with decreases in readmission rates and related costs during the 90 days following discharge. Our analyses were adjusted for potential confounding variables including medical comorbidities and previous use of opioids and other medications.
Results.
After adjusting for patient demographics, comorbidities, and preoperative medication use, the adjusted 90-day readmission rate was 1.8% (95% CI 1.1–2.4) among patients who did not receive a block compared to 1.7% (95% CI 1.1–2.4) among patients who did (Odds Ratio 0.99, 95% CI 0.91–1.09; p = 0.85). The adjusted readmission-related postoperative cost for patients who did not receive a block was $561 (95% CI 502–619) and $574 (95% CI 508–639) for patients who did (difference $13, 95%CI −75 to 102, p=0.74). This lack of statistically significant differences held for subgroup and sensitivity analyses.
Conclusions.
Nerve blocks were not associated with improved measures of longer-term post-operative resource use in this younger, privately insured study population.
INTRODUCTION
Total knee arthroplasty (TKA) is a cost-effective treatment that has been demonstrated to provide pain relief and a better quality of life for patients with severe knee osteoarthritis.1,2 It is a widely performed procedure among the growing elderly population and is increasing in patients under 65, who are projected to undergo the majority of TKA in the United States in the next decade.3 Altogether, the number of TKA procedures is projected to rise to almost 3.5 million in 2030.4,5 Reducing readmission rates following TKA could have important implications for patient well-being and could reduce costs to society associated with TKA. Reducing readmission rates could also have financial implications for healthcare providers. In particular there has been increasing interest among policymakers and insurers in payment approaches that bundle payments for TKA and subsequent care, and in approaches that tie TKA payments to quality measures based on postoperative outcomes.6,7 In both cases, providers could benefit from lower readmission rates. Examples include the ProvenCare reimbursement program8,9 and the implementation of the Merit-based Incentive Payment System (MIPS) and the Comprehensive Care for Joint Replacement (CJR) model by the Centers for Medicare and Medicaid Services.10
Multiple studies have suggested that regional anesthesia—especially within a multimodal analgesic regimen—is associated with an improvement in postoperative quality measures measured during the inpatient admission including pains scores, length of stay, costs, mortality, opioid use, and joint function.11–14 While these benefits suggest that regional anesthesia has the potential to improve outcomes in the longer-term postoperative period relevant to many of these new payment mechanisms, few studies have actually evaluated this hypothesis. Given the ever-evolving system of payment with growing emphasis on value to the patient, understanding whether regional anesthesia is associated with improvements in longer-term outcomes has important implications for practicing anesthesiologists, their surgical colleagues, healthcare administrators, policymakers, and patients themselves.
To investigate this issue, we used administrative health care claims data from Marketscan® to compare readmission rates and readmission-related costs between privately insured patients who did and did not receive regional anesthesia for total knee arthroplasty. Specifically, we tested the hypothesis that the use of regional anesthesia (peripheral or neuraxial block) was associated with reduced readmission rates and related costs within 90 days of discharge.
METHODS
Data
Our study used administrative health claims from Marketscan® (Truven Health Analytics, Ann Arbor, MI) from 2001 to 2013. The Marketscan® database provides data on utilization and spending for the care of people enrolled in private insurance plans through a participating employer, health plan, or government organization; in general, persons in the Marketscan® database are employed by large organizations. The database has grown from 6 million beneficiaries to comprise over 35 million beneficiaries today. Compared to the United States population more generally, the Marketscan® population is slightly more female, more likely to be from the southern areas of the United States, and less likely to be drawn from the western areas of the United States.15 The Marketscan® data are frequently used in analyses of health care utilization and spending.16,17
The Marketscan® data provide information that is directly abstracted from health care claims submitted by health care providers (e.g., physicians and hospitals). The claims data give detailed information from specific encounters including diagnosis codes (International Classification of Diseases, 9th Revision), procedure codes (Current Procedural Terminology [CPT]), and date the service was provided. Pharmacy claims provide the fill date, quantity supplied, and number of days supplied in addition to the National Drug Code, which can be linked to Red Book data (Truven Health Analytics, Ann Arbor, MI) to obtain the generic name and dose of the prescribed drug. Because this study used previously de-identified data, the protocol was determined to be exempt from review by the institutional review board at Stanford University.
Sample
We used the CPT code 27447 to identify 145,866 patients undergoing primary TKA between January 1, 2002, and October 2, 2013 and who were continuously enrolled in a fee-for-service or Preferred Provider Organization (PPO) health plan with prescription drug coverage for at least 1 year prior to and 90 days after the date of their procedure. We explicitly excluded patients who were enrolled in a health plan that used a capitated payment structure, such as a Health Maintenance Organization (HMO) for any period during this time period, because assessing the costs for any given episode of care is not possible when capitated payments are used. We then excluded patients who were <18 or > 64 years old at the time of their procedure (n = 4,022). In addition, because patients with cancer are at an increased risk of readmission18, we excluded patients with a history of cancer (n = 3,482). In the final sample of 138,362 patients, 24,415 (18%) had more than 1 TKA during the study period (see Appendix Figure 1 for a flow diagram showing the sample construction). For these patients, our analyses were restricted to information related to their first TKA.
Outcome Variables
Our study consisted of two primary outcomes: 90-day readmission and costs within 90 days of discharge. We limited our analysis to readmissions for 8 diagnoses—acute myocardial infarction, pneumonia, sepsis/septicemia/shock, surgical site bleeding, pulmonary embolism, death, mechanical complication, periprosthetic joint infection/wound infection—considered by the CMS to be quality measures for TKA (see Appendix Table 1 for relevant ICD-9 diagnosis codes).19 As part of our sensitivity analyses, however, we considered readmission for any cause. To measure costs, we used the total costs—amounts paid by the insurer and the patient— associated with these readmissions.
Exposure
Our independent variable of interest was whether the patient received a regional anesthesia procedure (peripheral and/or neuraxial block) for their surgery. We identified the use of a block by examining if a claim with one of the following CPT codes was submitted along with the claim for the initial TKA: 64447/64448 (femoral nerve block, single-injection or catheter, respectively), 64449 (lumbar plexus catheter), 64450 (other peripheral nerve block), 62318 (spinal block), and 62319 (epidural block).20
Additional Variables
Our analysis included a robust set of variables to adjust for potential confounders. These variables were chosen based on literature identifying them as risk factors for readmission after TKA.21 We included age, sex, and year of surgery from the claims data along with comorbidities that are frequently used for risk adjustment (Table 1). Patients were considered to have a history of the given comorbidity if they accumulated at least two claims with relevant ICD-9 codes in the 365 days prior to the day of their surgery.22 We also included whether the patients had any claims for the following classes of prescription drugs in the year prior to surgery: benzodiazepines, antidepressants, and antipsychotics (list of specific medication can be found in Appendix Table 2). Lastly, we included opioid use in the year prior to surgery by assigning patients into one of three groups: 1) opioid naïve, 2) intermittent use, and 3) chronic use. This was defined as having filled 0 prescriptions, < 10 prescriptions or <120 days’ supply, and >10 prescriptions or >120 days’ supply, respectively, in the year prior to surgery. The criteria for differentiating between intermittent and chronic use were based on previous work.20,23
Table 1.
Univariable Associations Between Nerve Blockade Status and Baseline Variables
| No Nerve Block (n = 75,501) |
Block (n = 62,861) |
P-value | Hedge’s g | |
|---|---|---|---|---|
| Average age (y) | 57.6 (57.5-57.6) | 57.5 (57.5-57.5) | 0.04 | 0.01 |
| Male (%) | 38.5 (38.2-38.9) | 39.6 (39.2-40.0) | <0.001 | 0.02 |
| Medical comorbidities (%) | ||||
| Congestive heart failure | 0.8 (0.7-0.8) | 0.6 (0.6-0.7) | 0.005 | 0.02 |
| Cardiac arrhythmias | 2.2 (2.1-2.3) | 2.3 (2.2-2.4) | 0.44 | <0.01 |
| Valvular disease | 0.4 (0.4-0.5) | 0.5 (0.4-0.5) | 0.45 | <0.01 |
| Pulmonary circulation disorders | 0.3 (0.3-0.4) | 0.4 (0.3-0.4) | 0.15 | 0.01 |
| Peripheral vascular disorders | 0.3 (0.3-0.4) | 0.4 (0.3-0.4) | 0.27 | 0.01 |
| Hypertension, uncomplicated | 22.0 (21.7-22.3) | 21.7 (21.4-22.1) | 0.17 | 0.01 |
| Hypertension, complicated | 0.8 (0.7-0.8) | 0.6 (0.5-0.6) | <0.001 | 0.02 |
| Paralysis | 0.05 (0.03-0.06) | 0.03 (0.02-0.05) | 0.19 | 0.01 |
| Other neurological disorders | 0.8 (0.7-0.9) | 0.7 (0.6-0.8) | 0.03 | 0.01 |
| Chronic obstructive pulmonary disease | 3.0 (2.9-3.1) | 2.8 (2.7-2.9) | 0.02 | 0.01 |
| Diabetes, uncomplicated | 13.0 (12.8-13.3) | 12.5 (12.2-12.7) | 0.004 | 0.02 |
| Diabetes, complicated | 1.2 (1.1-1.3) | 1.2 (1.1-1.3) | 0.96 | <0.01 |
| Hypothyroidism | 3.8 (3.7-3.9) | 4.4 (4.2-4.5) | <0.001 | 0.03 |
| Chronic kidney disease | 0.7 (0.6-0.7) | 0.7 (0.7-0.8) | 0.25 | 0.01 |
| Liver disease | 0.5 (0.4-0.5) | 0.5 (0.4-0.5) | 0.46 | <0.01 |
| Peptic ulcer disease | 0.08 (0.06-0.1) | 0.07 (0.05-0.09) | 0.51 | <0.01 |
| HIV/AIDS | 0.04 (0.02-0.05) | 0.05 (0.03-0.06) | 0.41 | <0.01 |
| Rheumatoid arthritis | 3.6 (3.4-3.7) | 3.6 (3.4-3.7) | 0.92 | <0.01 |
| Coagulopathy | 0.4 (0.4-0.5) | 0.4 (0.3-0.4) | 0.23 | 0.01 |
| Obesity | 1.4 (1.3-1.5) | 1.6 (1.5-1.7) | <0.001 | 0.02 |
| Weight loss | 0.08 (0.06-0.10) | 0.09 (0.07-0.1) | 0.48 | <0.01 |
| Fluid and electrolyte disorders | 0.7 (0.6-0.7) | 0.7 (0.6-0.7) | 0.63 | <0.01 |
| Blood loss anemia | 0.09 (0.07-0.1) | 0.09 (0.06-0.11) | 0.80 | <0.01 |
| Deficiency anemia | 0.9 (0.9-1.0) | 1.0 (0.9-1.0) | 0.37 | <0.01 |
| Alcohol abuse | 0.2 (0.2-0.3) | 0.3 (0.3-0.4) | <0.001 | 0.02 |
| Drug abuse | 0.2 (0.2-0.2) | 0.3 (0.2-0.3) | 0.04 | 0.01 |
| Psychosis | 0.2 (0.2-0.2) | 0.1 (0.1-0.2) | 0.001 | 0.02 |
| Depression | 5.1 (5.0-5.3) | 5.4 (5.2-5.6) | 0.03 | 0.01 |
| Preoperative opioid use (%) | ||||
| Opioid-naïve | 50.1 (49.8-50.5) | 49.3 (48.9-49.7) | 0.002 | 0.02 |
| Intermittent opioid use | 39.9 (39.5-40.2) | 40.6 (40.2-41.0) | 0.006 | 0.01 |
| Chronic opioid use | 10.0 (9.8-10.2) | 10.1 (9.9-10.3) | 0.56 | <0.01 |
| Preoperative drug use (%) | ||||
| Benzodiazepines | 18.4 (18.2-18.7) | 18.9 (18.6-19.2) | <0.05 | 0.01 |
| Antidepressants | 28.9 (28.6-29.2) | 29.4 (29.0-29.7) | <0.05 | 0.01 |
| Antipsychotics | 2.8 (2.7-3.0) | 2.8 (2.7-2.9) | 0.67 | <0.01 |
| Readmission Rate (%) | 1.9 (1.8-2.0) | 1.9 (1.8-2.0) | 0.80 | <0.01 |
| Inpatient Spending, all patients ($) | 557 (506-608) | 578 (521-634) | 0.59 | <0.01 |
| Inpatient Spending, readmitted patients only ($) | 29397 (27167-31627) | 30782 (28330-33234) | 0.41 | 0.03 |
Table 1 presents summary statistics for our sample stratified by whether the patient received a nerve block for their procedure. Ninety-five percent confidence intervals are shown in parentheses. “P-value” refers to the statistical significance of differences between the 2 groups, assessed by t test for age and by χ2 test or the remaining variables. “Opioid-naïve” refers to patients who did not fill a prescription for an opioid in the year before their procedure, whereas “chronic opioid use” refers to patients who filled at least 10 prescriptions or more than 120 days’ supply for an opioid in the year before their procedure. “Intermittent opioid use” consists of patients who filled at least 1 prescription for an opioid but who did not meet the criteria for chronic opioid use. “Inpatient spending” refers to spending on readmissions within 90 days of discharge. Inpatient spending is reported for both all patients (including patients who were not readmitted, for which inpatient spending is zero), and for readmitted patients only.
Analyses
In our descriptive analyses, we used a two-sided t-test for continuous variables and a chi-square test for discrete variables to assess differences in characteristics between patients who received a block and those who did not. Because of the large number of patients in our sample, it is possible to find differences in patient characteristics that are statistically significant, but which may be small in magnitude. Therefore, we used Hedge’s g to calculate the standardized difference between the two groups of patients. Specifically, Hedge’s g is the actual difference between the means of two groups divided by the pooled standard deviation.24 Hedge’s g is typically used to measure the magnitude of differences between two groups, with values <0.2 typically representing small differences, values of 0.2-.5 represent moderate differences, and values larger than 0.5 representing large differences.25
We used a multivariable logistic regression to estimate the association between regional anesthesia and 90-day readmission following TKA. The dependent variable was whether the patient had a readmission for one of the eight specific diagnoses (see “outcomes”) within 90 days post-discharge, and the independent variable of interest was whether the patient received a block for surgery. For our second analysis, we used a multivariable linear regression to estimate the association between regional anesthesia and readmission-related costs within 90 days post-discharge. All the analyses included adjustments for the potential confounders described under “Additional Variables” and listed in Table 1. We performed our analyses using Stata 14.0 (College Station, TX). The Hosmer-Lemeshow test was used with deciles to assess the goodness of fit for our logistic regression models. All our analyses used robust standard errors.
As our study had two primary outcomes, we established a significance threshold of p<=0.025 to adjust for multiple comparisons testing. A priori, we considered a $500 change in costs or a 0.5 percentage point increase in readmission rates to represent clinically significant/policy relevant changes. As this was a retrospective analysis, our sample consisted of all 138,362 patients meeting the inclusion and exclusion criteria discussed above, with 75,501 patients receiving no block and 62,861 patients receiving a block. Given these sample sizes, we determined that our sample would be adequately powered (power=0.8) to detect a 0.2 percentage point difference in admission rates or a $1 difference in costs, both of which are far under the previously defined thresholds of clinical/policy significance.
Subanalyses
In addition to the two baseline analyses described above, we performed two subgroup analyses. First, we conducted a subgroup analysis on patients aged 50 or higher since TKAs tend to be performed among an older population. Second, we investigated whether the effect of a block would be greater among patients at higher risk for readmission. We identified these patients by estimating a logistic regression model in which the dependent variable was whether the patient was readmitted within 90 days post-discharge and the independent variables were the patient characteristics listed in Table 1 (which do not include the regional anesthesia indicator). Using the results of this regression, we calculated each patient’s predicted probability for readmission following surgery. We then performed the logistic and linear regression analyses described above (“Statistical analyses”) on the subset of patients whose predicted probability for readmission was in the upper quartile.
Sensitivity Analyses
We explored the robustness of our results via several sensitivity analyses. First, in the baseline analyses above, we restricted our measures of readmissions and costs to readmission for 8 specific diagnoses that are used as TKA quality measures, since most proposed pay reforms would tie payment to costs and readmissions that are related to the knee arthroplasty itself. However, as a sensitivity analysis, we also examined the relationship between nerve block and readmissions and inpatient costs for any diagnosis within 90 days of discharge.
Second, the baseline analyses combined patients who received a peripheral or neuraxial block into 1 group. To examine whether our results might differ by the type of block, we divided block patients into 2 groups: those who received a peripheral nerve block (e.g., femoral nerve block, lumbar plexus block, other peripheral nerve block) and those who received a neuraxial block (e.g., spinal or epidural). We then separately estimated the association between each type of block and our primary outcomes. In performing this analysis, we compared outcomes between patients who received the given type of block against patients who received no block at all.
Additionally, our use of billing codes to identify the utilization of a nerve block is a potential source of bias. These codes are used to generate claims for a block so their presence is in all probability highly specific; it is unlikely that a patient did not receive the block if the code is present. However, the presence of these codes may not be highly sensitive because anesthesia providers may not bill separately for a block if it was only intended to provide anesthesia for the procedure itself on top of general anesthesia and not for postoperative analgesia. It is even possible that rather than submitting a separate claim for the block, the anesthesia provider simply billed for the additional time used to place the block under the claim submitted for providing anesthesia for the TKA itself. Consequently, some patients who actually received blocks may not have an associated billing code and would be counted as part of the “no block” group in error, potentially biasing our results toward finding no association.
We addressed this potential bias in two ways. While TKA can be performed under neuraxial block alone, that is very rarely the case with peripheral nerve blocks; there are exceptional cases where TKA was performed under lumbar plexus and sciatic blocks.26 Therefore, our first approach was to examine the robustness of our results by considering neuraxial and peripheral nerve blocks separately because the latter should be unaffected by this bias. This was performed using the regression model previously described (“Analyses”), except that instead of one independent variable for whether the patient received a block, we incorporated six independent variables, one for each type of block (femoral single shot, femoral catheter, lumbar plexus, spinal, epidural, and other block). Since the peripheral nerve blocks are less likely to be prone to misclassification error; the goal of this analysis was to determine if there was any significant association between the use of these blocks and our outcomes.
For our second approach, we identified patients who did not receive a block by use of billing codes, but who were highly likely to have received a block based on observable characteristics such as demographics, medical comorbidities, and preoperative prescription drug use. We then examined the robustness of our results to a falsification analysis where this set of patients was counted as having received a block. If misclassification were a serious issue, it would most likely occur among this set of patients. Similar results to our baseline analysis would provide reassurance that the misclassification of blocks was not a serious issue.
To conduct the falsification analysis, we estimated a multivariable logistic regression in which the dependent variable was an indicator for whether the patient received a block. The independent variables were the demographic factors, medical comorbidities, and preoperative prescription drug use described above (Table 1). The results from this regression were used to estimate the predicted probability of receiving a block for each patient who had no documented block but were likely to have received one according to the percentage of patients with similar characteristics who actually received a block. We then repeated our baseline analyses with the addition of patients who did not have codes indicating that they received a block, but whose predicted probability of receiving a block was ≥75%, along with those who had codes indicating that they did receive a block. To the extent that our results from the falsification analysis are similar to the results from our baseline analysis, this would provide reassurance that misclassification was not greatly biasing our results.
RESULTS
Our sample consisted of 138,362 patients with 62,861 (45%) receiving a nerve block for their procedure. Among patients who received a block, 33,749 (54%) received a single-injection femoral nerve block, 23,265 (37%) received a continuous femoral nerve block through a catheter, 284 (0.5%) received a lumbar plexus block, and 2,347 (4%) received another type of peripheral nerve block. 159 patients (0.3%) received a spinal block, and 5,276 patients (8%) received an epidural. The percentages sum to more than 100% because some patients received more than 1 type of block. 68,865 patients were classified as opioid-naïve of whom 31,003 (45%) received a block. Similarly, 25,517 of 55,612 (46%) intermittent users and 6,341 of 13,885 (46%) chronic opioid users received a block.
Between patients who did and did not receive a nerve block, there were no statistically significant differences in terms of age, degree of chronic opioid use, or use of antipsychotics in the year before surgery. Patients receiving a block were more likely to have used antidepressants and benzodiazepines and more likely to have used opioids intermittently in the year before surgery. Patients who did not receive a block were more likely to be opioid naïve (Table 1). Among the comorbidities we examined, the prevalence of congestive heart failure, complicated hypertension, neurologic disorders, chronic obstructive pulmonary disease, uncomplicated diabetes, and psychosis was lower among patients who received a block; whereas the prevalence of hypothyroidism, obesity, alcohol & drug abuse, and depression was higher in the block group. Patients who received a block were also more likely to be younger and male. However, although statistically significant, these differences were small in magnitude (Hedge’s g <0.05 for all characteristics) (Table 1).
The unadjusted 90-day readmission rate was 1.9% for both groups of patients (95%CI 1.8-2.0 for both groups of patients, P = 0.81). After adjusting for patient demographics, comorbidities, and preoperative medication use, there was no statistically significant difference in 90-day readmission rates between patients who did not receive a block (1.8%, 95% CI 1.1-2.4) and those who did receive a block (1.7%, 95% CI 1.1-2.4; OR 0.99, 95% CI 0.91-1.09, P = 0.85, P=0.67 for Hosmer-Lemeshow test of fit) (Figure 1). The unadjusted readmission-related postoperative cost for patients who did not receive a block was $557 (95% CI 499-615) and $577 (95% CI 513-642) for patients who did (p = 0.59). Similarly, there was no statistically significant difference in adjusted costs (Figure 2): $561 (95%CI 502-619) for patients who did not receive a block compared to $574 for patients who did (95%CI 508-639; difference $13, 95%CI −75 to 102, p=0.74, R2=0.003).
FIGURE 1. Association Between 90-day Readmission Rate and Nerve Block Utilization for Patients Undergoing Total Knee Arthroplasty.
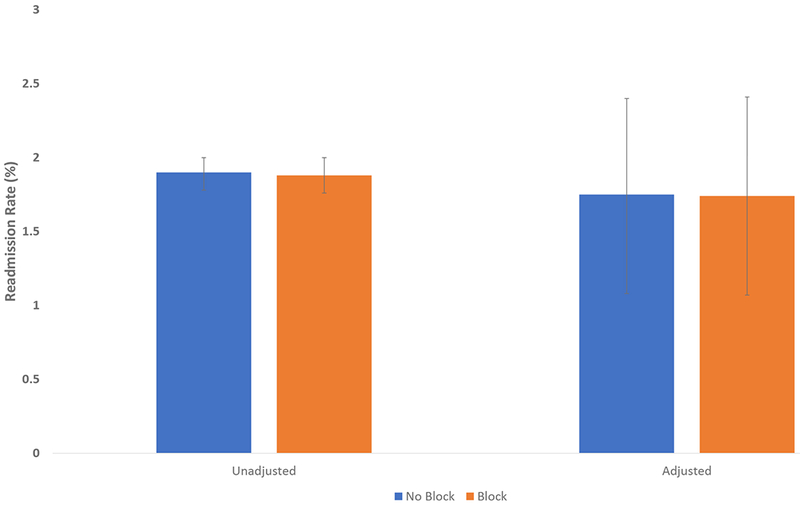
Figure 1 presents unadjusted and adjusted readmission rates within 90 days of discharge for total knee arthroplasty patients who received a nerve block and for patients who did not receive a block. The adjusted readmission rates are adjusted for the patient characteristics shown in Table 1. Error bars show 95% confidence intervals, which were calculated using robust standard errors.
FIGURE 2. Association Between 90-day Readmission-related Costs and Nerve Block Utilization for Patients Undergoing Total Knee Arthroplasty.
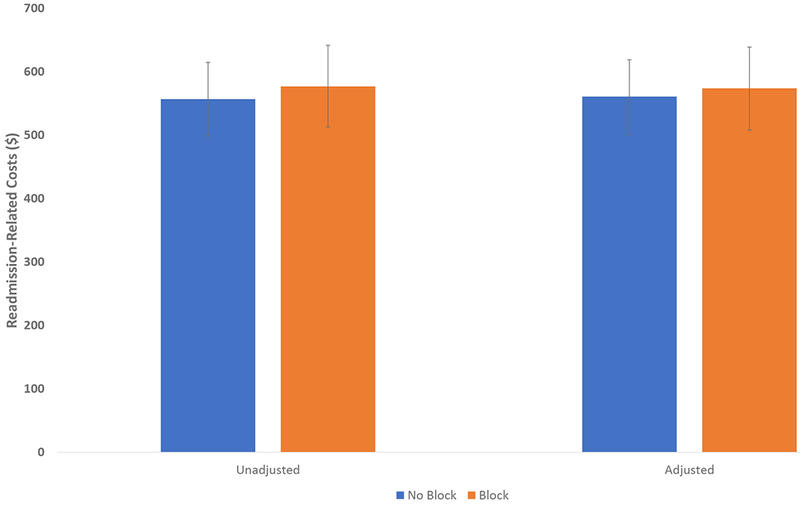
Figure 2 presents unadjusted and adjusted readmission-related costs within 90 days of discharge for total knee arthroplasty patients who received a nerve block and for patients who did not receive a block. The adjusted costs are adjusted for the patient characteristics shown in Table 1. Error bars show 95% confidence intervals, which were calculated using robust standard errors.
We examined the robustness of our results across several subgroup and sensitivity analyses. First, among patients who were 50 years of age or older, the use of a nerve block was not associated with a statistically significant difference in readmission rates (OR 0.98, 95%CI 0.90-1.09, P=0.77, P=0.85 for Hosmer-Lemeshow test of fit), or readmission-related cost (difference -$4, 95%CI -$97 to $88, p=0.91). Second, we examined whether the effect of a nerve block would be particularly pronounced among patients at higher risk for readmission. However, even when we restricted our sample to patients at high risk for admission, we found no association between the use of a nerve block and 90-day readmission rate (OR 1.01, 95% CI 0.87-1.17, p= 0.91, p=0.19 for Hosmer-Lemeshow test of fit) or cost (difference $19, 95% CI −240 to 280, p = 0.87, R2=0.004). Third, we examined whether there were differences across types of nerve blocks (Table 2), and we generally found no statistically significant association between any individual type of block and readmission rate or cost. Of note, the apparent positive association between epidurals and readmission rates (OR 1.2, 95%CI 1.0-1.5, p=0.026) is not significant taking into account our significance threshold of p=0.025, which is adjusted for multiple comparisons testing. Finally, our baseline analysis considered readmissions and related costs for 8 specific diagnoses that are used as TKA quality measures; when we considered readmissions for any reason, the use of nerve blocks was associated with an increased risk of readmission (OR 1.05, 95%CI 1.02-1.08, p=0.003), but no difference in overall costs ($92, 95%CI −930 to 6168, p=0.148).
Table 2.
90-day readmission rate and total cost broken down by type of block
| 90-day Readmission Rate (%) | Total Cost ($) | |||
|---|---|---|---|---|
| Type of Block | Odds Ratio (95% CI) | P-value | Difference in cost (95% CI) | P-value |
| femoral, single shot (n=33,749) | 1.0 (0.6-1.6) | 0.83 | 19 (−92 to 130) | 0.70 |
| femoral, catheter (n=23,265) | 1.0 (0.8-1.1) | 0.40 | −18 (−152 to 115) | 0.76 |
| lumbar plexus (n=284) | 0.2 (0.02-1.7) | 0.09 | −340 (−783 to 101) | 0.08 |
| other (n=2,347) | 0.9 (0.7-1.3) | 0.66 | 74 (−299 to 447) | 0.66 |
| spinal (n=159) | 1.3 (0.4-4.1) | 0.60 | 2306 (−3695 to 8307) | 0.39 |
| epidural (n=5,276) | 1.2 (1.0-1.5) | 0.03 | 135 (−138 to 409) | 0.27 |
Table 2 shows the results of a logistic regression analysis examining the association between type of block and 90 day readmission rate and a linear regression examining the association between type of block and total costs within 90 days of discharge. In both cases, the reported effect (Odds Ratio for readmission or difference in costs) is the difference between patients who received the given type of block compared to patients who received no block at all. 95% confidence intervals shown in parentheses were calculated using robust standard errors. For the logistic regression, the P-value for the Hosmer-Lemeshow test of goodness of fit was 0.63. For the linear regression, the R2 was 0.006.
To account for potential misclassification, we performed a falsification analysis in which we defined block patients to be (1) those with appropriate claim for a block; and (2) those without a claim but whom we predicted would have been extremely likely (>75% probability) to have received a block. Overall, the readmission rate (OR 1.03, 95% CI 0.93-1.15, P = 0.45, P=0.71 for Hosmer-Lemeshow test for goodness of fit) and cost (Difference $12, 95% CI −95 to 119, P = 0.80, R2=0.003) from this analysis largely match the results from our baseline analysis.
DISCUSSION
In the present study, we used healthcare utilization data to examine whether the use of peripheral or neuraxial block was associated with a decrease in two measures of postoperative resource utilization. Overall, we found no significant association between the use of nerve block and 90-day readmission rate or readmission-related costs in this younger, privately insured study population. These results persist even after subanalyses of high-risk patients and specific types of blocks. We did find an apparent positive association between epidurals and readmission rates, which could reflect readmissions secondary to complications from epidural blocks (e.g., hematoma or dural puncture), but this finding was not statistically significant taking into account our adjustments for multiple comparisons testing. Consistent with other recent study findings,20,27 the present study does not provide supportive evidence for long-lasting positive effects of perioperative regional anesthesia on occurrence of readmissions and associated costs despite published literature suggesting such potential in a variety of surgical procedures.28–30 However, it is worth noting that some of these previous studies compared general anesthesia versus the use of neuraxial techniques, while our study largely compares the use of general anesthesia with a peripheral nerve block to general anesthesia alone.
These results build on the work by previous investigators who have reported robust findings on numerous short-term benefits of perioperative regional anesthesia including reduction in opioid use, earlier ambulation, and decreased length of hospital stay.11–14 Our study differs from an earlier study finding that regional anesthesia was associated with a lower risk of readmission31 in several ways. First, the mentioned study focused on Medicare patients, while our study evaluated the use of regional anesthesia among privately insured patients who were generally younger and possibly healthier than the elderly patients covered under Medicare fee-for-service. Second, the previous study focused solely on femoral nerve blocks; we considered other regional anesthesia techniques such as neuraxial and other peripheral nerve blocks. Finally, the previous study only evaluated the association between regional anesthesia and readmission rates. In this study, we explicitly consider the relationship between regional anesthesia and longer-term postoperative costs, since these costs may play a large role in determining TKA payment under MIPS.
The underlying causes for our findings are an area for further research and would be beneficial to determine best clinical practices and better health policy. One explanation is that pain after TKA is controlled mainly by the femoral and the sciatic nerves. Today, most nerve block techniques targeting perioperative pain management for TKA patients focus only on the femoral nerve or selective branches, leaving pain transmitted by other nerves unblocked.32 This may explain why a single-injection peripheral nerve block cannot reasonably be expected to affect long-term outcomes measures. Another explanation is that current practice does not take full advantage of the potential benefits of nerve blocks. For example, one study has shown that patients with chronic neuropathic postsurgical pain after TKA report higher pain scores on postoperative day 5, long after nerve blocks have been removed or resolved.33 Another study has shown that there is no statistically significant long-term difference in self-reported functional outcome between patients who had a continuous FNB 4 days postoperatively compared to 1 day postoperatively,34 but objective measures of function were not assessed. Yet, the optimal duration of block effect for TKA patients remains unknown. Finally, while nerve blocks may prove beneficial at the individual level, ultimately, longer-term resource use may be the function of health-system level policies and procedures.
Our study should be viewed in light of its limitations. First, it is possible that residual confounders could have biased our results. For example, if sicker patients—who may be at higher risk for readmission—are more likely to receive a block, then this would bias our study towards finding no effect. However, we note that the distribution of many observable health indicators (e.g., medical comorbidities) was fairly evenly distributed across our block and non-block patients. Second, our results could have been biased by the use of billing codes to identify the presence of a nerve block. We addressed this issue by performing 2 sensitivity analyses as detailed above and our results were robust to these. We also noted that the percentage of patients receiving a block in our study (45.5%) was roughly similar to or higher than the percentages found in other studies using alternative methods of measuring block use such as clinical and electronic medical record data.35,36 This finding suggests that billing data were largely able to capture the use of blocks. Third, our use of billing data and diagnosis codes to identify patient comorbidities may not be fully sensitive, particularly since we imposed a requirement that a patient have at least two separate diagnoses for a given comorbidity. Therefore, it is possible that we mis-identified some patients as not having a given comorbidity (e.g., alcohol abuse) even if in fact that comorbidity was present. The inability to fully identify patient comorbidities could affect our results to the extent that the sensitivity of billing codes is also associated with whether a patient received a block (e.g., if billing codes are less sensitive for patients who received blocks). Fourth, our study largely compares the use of peripheral nerve blocks in addition to a general anesthetic to a general anesthetic alone, and while we did observe the use of neuraxial anesthesia, we do not know if it was used alone or in conjunction with a general anesthetic.
Finally, while the present study evaluates the potential effects of a single intervention, it does not consider the overall system of care, which may arguably be responsible for more meaningful outcomes in the long term. Even though we can identify the presence or absence of a regional anesthesia procedure, we do not know if the block functions within the context of a multimodal analgesic regimen or even if the block is consistently applied across the TKA patient population within the affected facility; we speculate that consistent adherence to a clinical pathway may be more likely to produce reliable benefits compared to sporadic block usage.37 Further, we do not know whether or not the utilization of regional anesthesia at a particular facility reflects differences in the underlying approach to change management. For example, the ability to implement changes in clinical practice based on new evidence may be representative of a culture that is conducive to continuous improvement in many areas.38 Such environments may more willing to attempt new models of care that may have greater measurable benefit in terms of cost than simply a block alone.39 Finally, our study was limited to privately insured patients <65 years old who received TKA and may not apply to patients ≥65, who typically receive health insurance from Medicare, or patients on other government-funded plans. Older patients represent the majority of patients who undergo TKA and may be particularly susceptible to adverse events. Understanding whether regional anesthesia may reduce the risk of readmission and other long-term outcomes in this population is an important area for further study.
In summary, our results suggest that perioperative regional anesthesia technique is not associated with a reduction readmission rate after TKA or associated readmission-related costs. However, these findings need to be taken in the context of this study’s limitations and should not discount the known benefits of regional anesthesia for TKA patients during the immediate perioperative period.
Supplementary Material
KEY POINTS.
Question:
Are regional anesthesia techniques associated with decreased readmission rates and costs during the 90-day post-operative period for privately insured total knee arthroplasty patients?
Findings:
Our findings suggest that perioperative regional anesthesia technique is not associated with a reduced readmission rate after TKA or readmission-related cost in this population.
Meaning:
These findings suggest specific areas of further research, need to be taken in the context of this study’s limitations, and should not discount the known benefits of regional anesthesia for TKA patients during the immediate perioperative period.
Acknowledgements:
Dr. Sun acknowledges funding from the National Institute on Drug Abuse (K08DA042314).
Funding: Dr. Sun was supported by the National Institute on Drug Abuse (K08DA042314).
Footnotes
Prior Presentations: This work was presented on October 22, 2017 at the Medical Student Anesthesia Research Fellowship (MSARF) symposium at the annual American Society of Anesthesiologists meeting in Boston, MA.
Conflicts of Interest: None to report. Dr. Sun has a consulting relationship with Egalet, Inc. and the Mission Lisa Foundation, both of which are unrelated to this work.
REFERENCES
- 1.Hawker GA, Badley EM, Croxford R, Coyte PC, Glazier RH, Guan J, Harvey BJ, Williams JI, Wright JG: A population-based nested case-control study of the costs of hip and knee replacement surgery. Med Care 2009; 47: 732–41 [DOI] [PubMed] [Google Scholar]
- 2.Ethgen O, Bruyere O, Richy F, Dardennes C, Reginster JY: Health-related quality of life in total hip and total knee arthroplasty. A qualitative and systematic review of the literature. J Bone Joint Surg Am 2004; 86-A: 963–74 [DOI] [PubMed] [Google Scholar]
- 3.Kurtz SM, Lau E, Ong K, Zhao K, Kelly M, Bozic KJ: Future young patient demand for primary and revision joint replacement: national projections from 2010 to 2030. Clin Orthop Relat Res 2009; 467: 2606–12 [DOI] [PMC free article] [PubMed] [Google Scholar]
- 4.Kurtz S, Ong K, Lau E, Mowat F, Halpern M: Projections of primary and revision hip and knee arthroplasty in the United States from 2005 to 2030. J Bone Joint Surg Am 2007; 89: 780–5 [DOI] [PubMed] [Google Scholar]
- 5.Cram P, Lu X, Kates SL, Singh JA, Li Y, Wolf BR: Total knee arthroplasty volume, utilization, and outcomes among Medicare beneficiaries, 1991–2010. JAMA 2012; 308: 1227–36 [DOI] [PMC free article] [PubMed] [Google Scholar]
- 6.Blunt J: Humana Launches Value-Based Orthopedic Specialty Care Model in Ohio. 2016Accessed at https://press.humana.com/press-release/regional-news/humana-launches-value-based-orthopedic-specialty-care-model-ohio on August 23, 2018.
- 7.Vroom M, Salmen A: Illinois Bone & Joint Institute and Cigna Collaborate to Improve Quality and Cost for Knee and Hip Replacements. 2015Accessed at https://www.cigna.com/newsroom/news-releases/2015/illinois-bone-amp-joint-institute-and-cigna-collaborate-to-improve-quality-and-cost-for-knee-and-hip-replacements on August 23, 2018.
- 8.Surgeons AAoHaK: MACRA Resource Center. American Association of Hip and Knee Surgeons at http://www.aahks.org/performance-measures-and-quality-improvement/macra/ on June 21, 2017 2017.
- 9.Ferlazzo M: Geisinger’s renowned ProvenCare® program launches three new orthopaedic offerings: Total Hip, Total Knee and Hip Fracture, 2014
- 10.Services USCfMM: Comprehensive Care for Joint Replacement Model. 2017Accessed at U.S. Centers for Medicare & Medicaid Services at https://innovation.cms.gov/initiatives/cjr on June 17 2017.
- 11.Pugely AJ, Martin CT, Gao Y, Mendoza-Lattes S, Callaghan JJ: Differences in short-term complications between spinal and general anesthesia for primary total knee arthroplasty. J Bone Joint Surg Am 2013; 95: 193–9 [DOI] [PubMed] [Google Scholar]
- 12.Stundner O, Chiu YL, Sun X, Mazumdar M, Fleischut P, Poultsides L, Gerner P, Fritsch G, Memtsoudis SG: Comparative perioperative outcomes associated with neuraxial versus general anesthesia for simultaneous bilateral total knee arthroplasty. Reg Anesth Pain Med 2012; 37: 638–44 [DOI] [PMC free article] [PubMed] [Google Scholar]
- 13.Hu S, Zhang ZY, Hua YQ, Li J, Cai ZD: A comparison of regional and general anaesthesia for total replacement of the hip or knee: a meta-analysis. J Bone Joint Surg Br 2009; 91: 935–42 [DOI] [PubMed] [Google Scholar]
- 14.Terkawi AS, Mavridis D, Sessler DI, Nunemaker MS, Doais KS, Terkawi RS, Terkawi YS, Petropoulou M, Nemergut EC: Pain Management Modalities after Total Knee Arthroplasty: A Network Meta-analysis of 170 Randomized Controlled Trials. Anesthesiology 2017; 126: 923–937 [DOI] [PubMed] [Google Scholar]
- 15.Aizcorbe A, Liebman E, Pack S, Cutler DM, Chernew ME, Rosen AB: Measuring health care costs of individuals with employer-sponsored health insurance in the U.S.: A comparison of survey and claims data. Stat J IAOS 2012; 28: 43–51 [DOI] [PMC free article] [PubMed] [Google Scholar]
- 16.Baker L, Bundorf MK, Royalty A: Private insurers’ payments for routine physician office visits vary substantially across the United States. Health Aff (Millwood) 2013; 32: 1583–90 [DOI] [PubMed] [Google Scholar]
- 17.Chernew ME, Sabik LM, Chandra A, Gibson TB, Newhouse JP: Geographic correlation between large-firm commercial spending and Medicare spending. Am J Manag Care 2010; 16: 131–8 [PMC free article] [PubMed] [Google Scholar]
- 18.Pugely AJ, Callaghan JJ, Martin CT, Cram P, Gao Y: Incidence of and risk factors for 30-day readmission following elective primary total joint arthroplasty: analysis from the ACS-NSQIP. J Arthroplasty 2013; 28: 1499–504 [DOI] [PubMed] [Google Scholar]
- 19.Dorsey K GJ, Suter LG, Kwon JY, Parzynski CS, DeBuhr J, Bernheim S, Krumholz HM: 2016. Procedure-specific measure updates and specifications report. Hospital-level risk-standardized complication measure. Elective primary total hip arthroplasty (THA) and/or total knee arthroplasty (TKA), version 5.0. 2016. [Google Scholar]
- 20.Sun EC, Bateman BT, Memtsoudis SG, Neuman MD, Mariano ER, Baker LC: Lack of Association Between the Use of Nerve Blockade and the Risk of Postoperative Chronic Opioid Use Among Patients Undergoing Total Knee Arthroplasty: Evidence From the Marketscan Database. Anesth Analg 2017; 125: 999–1007 [DOI] [PubMed] [Google Scholar]
- 21.Ricciardi BF, Oi KK, Daines SB, Lee YY, Joseph AD, Westrich GH: Patient and Perioperative Variables Affecting 30-Day Readmission for Surgical Complications After Hip and Knee Arthroplasties: A Matched Cohort Study. J Arthroplasty 2017; 32: 1074–1079 [DOI] [PubMed] [Google Scholar]
- 22.Quan H, Sundararajan V, Halfon P, Fong A, Burnand B, Luthi JC, Saunders LD, Beck CA, Feasby TE, Ghali WA: Coding algorithms for defining comorbidities in ICD-9-CM and ICD-10 administrative data. Med Care 2005; 43: 1130–9 [DOI] [PubMed] [Google Scholar]
- 23.Raebel MA, Newcomer SR, Reifler LM, Boudreau D, Elliott TE, DeBar L, Ahmed A, Pawloski PA, Fisher D, Donahoo WT, Bayliss EA: Chronic use of opioid medications before and after bariatric surgery. JAMA 2013; 310: 1369–76 [DOI] [PubMed] [Google Scholar]
- 24.Hedges LV: Distribution Theory for Glass’s Estimator of Effect size and Related Estimators. Journal of Educational and Behavioral Statistics 1981; 6: 107–128 [Google Scholar]
- 25.Sawilowsky SS: New Effect Size Rules of Thumb. Journal of Modern Applied Statistical Methods 2009; 8: Article 26 [Google Scholar]
- 26.Williams BA, Ibinson JW, Mangione MP, Modrak RT, Tonarelli EJ, Rakesh H, Kmatz AM, Cohen PZ: Research priorities regarding multimodal peripheral nerve blocks for postoperative analgesia and anesthesia based on hospital quality data extracted from over 1,300 cases (2011–2014). Pain Med 2015; 16: 7–12 [DOI] [PubMed] [Google Scholar]
- 27.Mueller KG, Memtsoudis SG, Mariano ER, Baker LC, Mackey S, Sun EC: Lack of Association Between the Use of Nerve Blockade and the Risk of Persistent Opioid Use Among Patients Undergoing Shoulder Arthroplasty: Evidence From the Marketscan Database. Anesth Analg 2017; 125: 1014–1020 [DOI] [PubMed] [Google Scholar]
- 28.Tung YC, Hsu YH, Chang GM: The Effect of Anesthetic Type on Outcomes of Hip Fracture Surgery: A Nationwide Population-Based Study. Medicine (Baltimore) 2016; 95: e3296. [DOI] [PMC free article] [PubMed] [Google Scholar]
- 29.Ding DY, Mahure SA, Mollon B, Shamah SD, Zuckerman JD, Kwon YW: Comparison of general versus isolated regional anesthesia in total shoulder arthroplasty: A retrospective propensity-matched cohort analysis. J Orthop 2017; 14: 417–424 [DOI] [PMC free article] [PubMed] [Google Scholar]
- 30.Hall-Burton DM, Hudson ME, Grudziak JS, Cunningham S, Boretsky K, Boretsky KR: Regional Anesthesia Is Cost-Effective in Preventing Unanticipated Hospital Admission in Pediatric Patients Having Anterior Cruciate Ligament Reconstruction. Reg Anesth Pain Med 2016; 41: 527–31 [DOI] [PubMed] [Google Scholar]
- 31.Lovald ST, Ong KL, Lau EC, Joshi GP, Kurtz SM, Malkani AL: Readmission and Complications for Catheter and Injection Femoral Nerve Block Administration After Total Knee Arthroplasty in the Medicare Population. J Arthroplasty 2015; 30: 2076–81 [DOI] [PubMed] [Google Scholar]
- 32.Webb CA, Mariano ER: Best multimodal analgesic protocol for total knee arthroplasty. Pain Manag 2015; 5: 185–96 [DOI] [PubMed] [Google Scholar]
- 33.Lavand’homme PM, Grosu I, France MN, Thienpont E: Pain trajectories identify patients at risk of persistent pain after knee arthroplasty: an observational study. Clin Orthop Relat Res 2014; 472: 1409–15 [DOI] [PMC free article] [PubMed] [Google Scholar]
- 34.Ilfeld BM, Shuster JJ, Theriaque DW, Mariano ER, Girard PJ, Loland VJ, Meyer S, Donovan JF, Pugh GA, Le LT, Sessler DI, Ball ST: Long-term pain, stiffness, and functional disability after total knee arthroplasty with and without an extended ambulatory continuous femoral nerve block: a prospective, 1-year follow-up of a multicenter, randomized, triple-masked, placebo-controlled trial. Reg Anesth Pain Med 2011; 36: 116–20 [DOI] [PMC free article] [PubMed] [Google Scholar]
- 35.Cozowicz C, Poeran J, Zubizarreta N, Mazumdar M, Memtsoudis SG: Trends in the Use of Regional Anesthesia: Neuraxial and Peripheral Nerve Blocks. Reg Anesth Pain Med 2016; 41: 43–9 [DOI] [PubMed] [Google Scholar]
- 36.Fleischut PM, Eskreis-Winkler JM, Gaber-Baylis LK, Giambrone GP, Faggiani SL, Dutton RP, Memtsoudis SG: Variability in anesthetic care for total knee arthroplasty: an analysis from the anesthesia quality institute. Am J Med Qual 2015; 30: 172–9 [DOI] [PMC free article] [PubMed] [Google Scholar]
- 37.Steckelberg RC, Funck N, Kim TE, Walters TL, Lochbaum GM, Memtsoudis SG, Giori NJ, Indelli PF, Graham LJ, Mariano ER: Adherence to a Multimodal Analgesic Clinical Pathway: A Within-Group Comparison of Staged Bilateral Knee Arthroplasty Patients. Reg Anesth Pain Med 2017; 42: 368–371 [DOI] [PubMed] [Google Scholar]
- 38.Mudumbai SC, Walters TL, Howard SK, Kim TE, Lochbaum GM, Memtsoudis SG, Kain ZN, Kou A, King R, Mariano ER: The Perioperative Surgical Home model facilitates change implementation in anesthetic technique within a clinical pathway for total knee arthroplasty. Healthc (Amst) 2016; 4: 334–339 [DOI] [PubMed] [Google Scholar]
- 39.Tse BK, Walters TL, Howard SK, Kim TE, Memtsoudis SG, Sun EC, Kou A, Graham L, King R, Mariano ER: A matched case-control comparison of hospital costs and outcomes for knee replacement patients admitted postoperatively to acute care versus rehabilitation. J Anesth 2017; 31: 785–788 [DOI] [PubMed] [Google Scholar]
Associated Data
This section collects any data citations, data availability statements, or supplementary materials included in this article.