Abstract
The development of biocompatible polymer nano-composites that enhance mechanical properties while maintaining thermoplastic processability is a longstanding goal in sustainable materials. When the matrix is semi-crystalline, the nanoparticles may induce significant changes to crystallization kinetics and morphology due to their ability to act as nucleating agents. To fully model this behavior in a process line, an understanding of the relationship between crystallinity and modulus is required. Here, we introduce a scalable model system consisting of surface-compatibilized cellulose nanocrystals (CNC) dispersed into poly(ε-caprolactone) (PCL) and study the effects of nanoparticle concentration on isothermal crystallization kinetics. The dispersion is accomplished by exchange of the Na+ of sulfated cellulose nanocrystals by tetra-butyl ammonium cations (Bu4N+) followed by melt mixing via twin-screw extrusion. Crystallization kinetics are measured through the recently developed rheo-Raman instrument which extracts the relationship between the growth of the transient mechanical modulus and that of crystallinity. With extrusion and increasing CNC content, we find the expected enhancement of crystallization rate, but we moreover find a significant change in the relative kinetics of increase in modulus versus crystallinity. We analyze this via generalized effective medium theory which allows computation of a critical percolation threshold ξc and discuss the results in terms of a change in nucleation density and a change in the anisotropy of crystallization.
Keywords: Crystallization, Raman, Cellulose nanocrystals
1. Introduction
The development of biocompatible polymer nanocomposites from renewable sources is under active investigation because the added nanoparticles offer the possibility of reinforcement of mechanical properties of the matrix polymer. Less studied is the possible modification of crystallization kinetics that can occur with nanoparticles. Successful implementation of such novel materials then requires that in addition to optimization of properties, the concomitant modifications to the behavior in processing operations be understood and, if possible, be exploited.
Cellulose nanocrystals (CNCs) are an important class of renewable filler for polymer nanocomposites [1–11] because their length to diameter ratio (∼20) results in low particle entanglement, which aids in processing, while still possessing a high Young’s modulus (130 GPa-250 GPa) [12]; this represents an advantage over other larger-sized cellulosic fillers [13]. Further utility of CNCs stems from their higher tensile moduli, low density, low energy consumption for production, high specific properties, modest abrasivity, biodegradability, and relatively reactive surface properties [14–16]. For the semi-crystalline matrix, we use polycaprolactone (PCL) as it is a biocompatible and biodegradable polymer used in numerous applications including tissue engineering, drug delivery and additive manufacturing [17–19].
A ubiquitous issue in polymer nanocomposites is the dispersion of the nanoparticle in the polymer [1]. For CNCs, the hydrophilic nature of the polysaccharides causes irreversible agglomeration in nonpolar polymer matrices due to the formation of hydrogen bonds between the nanoparticles. Further issues that hinder their use as reinforcing agents are high moisture absorption and poor wettability [13,14]. Functionalization of the nanoparticle surface is necessary to avoid aggregation in nonpolar matrices; for example, CNCs have been modified by surface coating or grafting [20]. Recently, Fox et al. demonstrated that replacement of Na+ with imidazolium or phosphonium cations can be used to modify CNC surface energy. The CNCs were melt mixed into polystyrene and the surface modification was shown to result in improved dispersion and improved resistance to moisture uptake [21].
Nanoparticles with sufficient dispersion in a polymer matrix have been shown to enhance the crystallization rate of semi-crystalline polymers by acting as nucleating agents due to their high surface area [22,23]. In some cases, this is advantageous because nanoparticles can induce specific crystalline forms that increase fracture toughness and optical clarity [24–26]. Faster crystallization can decrease the manufacturing time, for example in injection molding applications where the material must be sufficiently solidified prior to ejection from the mold. Prior work on PCL/clay nanocomposites investigated by differential scanning calorimetry (DSC) and rheological measurements showed that the crystallization behavior and crystalline morphology are strongly affected by the presence of the clay particulates [27]. In a separate study, Siqueira et al. [13] studied different PCL/CNC nanocomposites with several surface modifiers (PCL/nanowhiskers and PCL/microfibrilated cellulose) via DSC; the results showed that the differences in specific surface area and surface chemistry of nanoparticles affected the crystallization behavior of the polymer.
A critical aspect is how the increase of the modulus correlates with the growth of crystallinity. Numerous models have been developed in the past to try to relate the evolution of these two parameters [28–31] and often they depend on separate measurements of modulus and crystallinity. However, these experiments considered only single component thermoplastics, and did not consider how the relationships might be changed by nanofillers. Furthermore, the experimental endeavor suffers from uncertainties because of the difficulty in maintaining identical thermal histories, geometries and surface properties between the rheological measurement and that of the crystallinity [32–35]. Recently, Kotula and coworkers developed a hybrid instrument – a rheo-Raman microscope - that simultaneously measures the kinetics of crystallinity via Raman spectroscopy and measures the kinetics of moduli growth through mechanical rheometry [36]. This work is meant to highlight the applicability of the rheo-Raman microscope to characterize structural and conformational changes directly related to the rheological response of the material. For PCL, the data was best fit by a generalized effective medium (GEM) model with two parameters, which is described in more detail later. An important parameter of the model is the critical percolation threshold ξc, which describes the normalized crystallinity when the system becomes mechanically percolating. In neat PCL, it was found that ξc ≅ 0.35 over a range of temperatures.
When nanoparticles are highly anisotropic, such as for nano-fibers, the polymer crystallization process can grow directly off the nano-fiber. For the case of multi-wall carbon nanotubes that induce nucleation in isotactic polypropylene, it was found that the nucleating CNT induces a crystalline layer around directly around the nanotube, and the anisotropy of the crystalline layer directly mirrors that of the CNT [37,38]. Anisotropic polymer crystallization has also been induced by single wall carbon nanotubes in solution solvent based crystallization of polyethylene and Nylon [39]. Thus anisotropic nano-fillers can change the crystallization kinetics in two fashions: first it increases the overall nucleation density, and hence nucleation rate of the polymer. Second, it can cause highly-anisotropic crystalline domains to form, rather than spherulites. The implications of these two effects on the rheology-crystallization kinetics will be explored in this work.
In this work, we examine how CNCs affect the crystallization kinetics of PCL and how they impact the relationship between the growth of modulus and crystallinity. First, to prepare the dispersions of CNC in PCL, we use a modified form of the ion exchange approach of Fox et al. [21]. We assess the dispersion through optical microscopy, transmission electron microscopy (TEM) and rheology. We then employ the rheo-Raman microscope to perform simultaneous measurements of crystallinity and modulus following an isothermal temperature quench [36]. Consistent with existing literature, we find that the nanocrystalline material enhances the crystallization rate, indicating that the CNCs act as nucleating agents. The simultaneous measurements then allow us to directly plot the rheological modulus as a function of crystallinity and we show that the system can still be model by the generalized effective medium (GEM) theory, however the percolation threshold is significantly decreased because of extrusion and nanoparticle addition.
2. Materials and methods
Materials: We prepare two types of PCL nanocomposites each with three different CNC mass fractions. The PCL used in this work has a weight-average molar mass of 112 kg/mol and was received in pellet form from Scientific Polymer Products, Inc. In the first type of nanocomposite (unmodified), CNCs were obtained from the University of Maine in freeze dried powder form. These were melt mixed in a twin-screw extruder at 95 °C at three different quantities; (1, 5 and 10) percent by mass. For the second type (modified), the CNCs were obtained from a 12.1% by mass aqueous slurry of Na-CNCs from the University of Maine. The CNC surface was then modified with tertbutyl ammonium through the ion exchange method discussed above [21] to disrupt/minimize CNC-CNC interactions and improve dispersion in the PCL matrix. In this work we use the cationic surfactant, tetra butyl ammonium rather than imidazolium or phosphonium, to better match the aliphatic nature of PCL. The same concentrations in PCL are then prepared via the identical twin-screw protocol. We also employ two different 0% controls; the first is obtained by melt extruding the neat pellet PCL in the twin-screw extruder under the same conditions as utilized for the composite and is referred to as neat extruded PCL. The second PCL control is simply the as received PCL pellets from the vendor and is referred to as neat pellet PCL. The comparison between the two controls allows us to isolate the effect of the extrusion process itself on crystallization kinetics, which turns out to be significant.
Rheo-Raman and optical microscope: This experimental setup embodies the integration of a Raman microscope and rotational rheometer coupled through an optically transparent base. The detail of the instrument is described elsewhere [36]. We use the instrument to measure isothermal crystallization kinetics at 42 °C by simultaneous measurement of dynamic modulus, Raman spectroscopy and polarized optical microscopy. The Raman spectroscopy measurements in this paper were performed using 532 nm laser light operating with 10 mW power at the sample. For the experiments presented here, the exposure collection time was 5 s, and four sample exposures were averaged together. The sample of thickness 300 μm is heated to 100 °C, gradually cooled at 10 °C/min to 52 °C, then cooled at a slower rate of 2 °C/min to 42 °C and maintained isothermally to crystallize. The modulus was measured during small-amplitude oscillatory shear using a fixed strain amplitude of 0.01 from 100 °C to 42 °C and then at a lower strain of 0.004 at the crystallization temperature. The oscillation frequency was 6.28 rad/s. For these measurements, the objective was focused approximately 100 μm below the upper plate. The rheo-Raman microscope is capable of polarized optical microscopy in reflection mode. However, since the magnification of the images is too small for clear images, we instead integrate the intensity of the depolarized reflected light that reaches the camera CCD chip. This provides a sensitive measure for the onset of birefringent crystalline structures caused by crystallization.
Rheology: Separate measurements of the rheology only were conducted in the melt state in an ARES G2 strain controlled rheometer. Frequency sweep measurements in the range 0.4–100 rad/sec were performed for the neat extruded PCL and the nanocomposite samples. The amplitude of the strain was 0.03 and we used a parallel plate geometry of 25 mm diameter. The measurements were conducted at T = 105 °C because this is near the temperature at which annealing was carried out and also near the temperature at which the CNCs were mixed with polycaprolactone in the twin screw extruder.
TEM and optical imaging: All samples were cryo-microtomed at −120 °C (well below the glass transition temperature of PCL, which is −60 °C) into 100 nm and 500 nm sections for TEM and optical imaging, respectively. Optical imaging was performed with an Olympus BX 51 microscope operating in transmission mode. The cryo-microtomed sections were collected on a glass slide and imaged using a 50× objective. TEM sections were collected on copper grids and imaging was performed in an FEI Titan microscope at an accelerating voltage of 200 kV, with a zero-loss energy filter. This filtering has been shown to enhance density-based contrast variations in the sample [40]. To further enhance material contrast, a 40 μm objective aperture was employed.
Polarized Optical measurements (POM) for crystallization: The sample was cooled and placed between the quartz disks of a Linkam shear cell, heated to 100 °C, and compressed to a thickness of 100 μm. The isothermal crystallization experiments were performed at 42 °C. Imaging was performed in transmission mode using a 50× objective.
3. Results and discussion
Fig. 1a–d shows optical and TEM images of the 5% modified and 5% unmodified samples. We first compute the total area fraction, calculated by binarizing the images (Fig. S1) and summing the area occupied by larger aggregates observable in the optical images, and the smaller ones that require TEM. In the TEM image analysis, we do not distinguish between individualized CNCs and CNC aggregates. We find the total area fraction approximately agrees with the initial mass fraction of CNCs in the polymer matrix, indicated that both imaging modalities are required to account for the CNC content. Note that the aggregates are anisotropic. The details of the analysis are discussed in the SI (dispersion quantification).
Fig. 1.
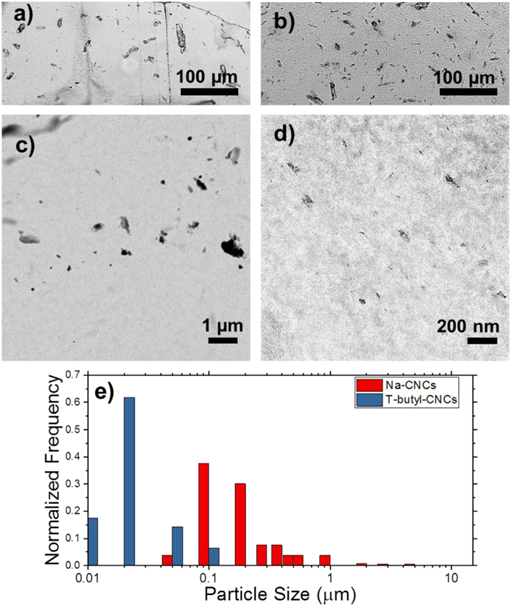
Optical images of a) 5% CNC unmodified and b) 5% CNC modified samples. TEM images of c) 5% CNC unmodified and d) 5% CNC modified samples. The scales are an order of magnitude different for better comparison of the CNC aggregates in the two images e) Calculated particle size distributions for the modified and unmodified samples.
As a measure of dispersion, the average area and the equivalent spherical diameters of the aggregates were calculated using the images from the two length scales. For the 5% by mass nanocomposites, the average area of the aggregates with modified CNCs was about 2 orders of magnitude smaller than that of the unmodified CNC sample. This roughly translates to an order of magnitude difference in the equivalent spherical diameter (Table 1). Uncertainties represent one standard deviation in calculated values from multiple replicants. Fig. 1e shows the peak-normalized particle size distributions for the 5% modified and unmodified CNCs estimated by summing weighted distributions from the optical and TEM measurements. It is apparent that the surface modification results in a significant reduction in the most probable particle size, but also note the broad distribution of sizes. A similar trend in aggregate dimension is observed in the 1% samples (Table 1). However, in the 10% CNC nanocomposites, the modified samples display highly aggregated morphologies. Analysis of the 10% modified samples reveals a significant degradation of the dispersion quality in going from 5% to 10% CNC by mass (Table 1). Images from all 1% and 10% modified nanocomposites are shown in Figs. S2 and S3 respectively. The 10% unmodified sample is highly heterogeneous, rendering it difficult to obtain a representative volume fraction of the material for statistically relevant quantification. We do not consider this sample further.
Table 1.
Average area of CNC aggregate Aagg, Effective Spherical Diameter Dagg and Area Fraction obtained from image analysis.
| Samples | Average area of CNC aggregate Aagg (nm2) | Effective Spherical Diameter Dagg (nm) | Area Fraction (%) |
|---|---|---|---|
| 1% modified | 5.22 × 10³ ± 4.17 × 10³ | 68 ± 29 | 1.64 ± 0.45 |
| 1% unmodified | 2.20 × 10⁵ ± 6.67 × 10⁴ | 526 ± 81 | 1.78 ± 0.05 |
| 5% modified | 1.57 × 10³ ± 5.26 × 10² | 44 ± 7 | 4.26 ± 0.26 |
| 5% unmodified | 2.01 × 10⁵ ± 6.80 × 10³ | 506 ± 93 | 5.24 ± 0.37 |
| 10% modified | 8.3 × 10⁵ ± 4.87 × 10⁵ | 890 ± 273 | 15.02 ± 0.63 |
| 10% unmodified | 16.11 × 10⁵ ± 13.63 × 10⁵ | 1204 ± 565 | 6.49 ± 0.41 |
The melt rheology results show a reinforcement effect with increasing mass fraction of CNC. In Fig. 2 we plot the complex viscosity and find a modest increase of viscosity in going from neat PCL to 1%, and then a stronger increase from (1–5) %. This is expected for nanoparticles with modest (∼20) length to diameter ratios and indicates successful dispersion in the melt state. The lack of increase from (5–10) % then indicates that further increase of CNC beyond 5% does not increase the number of dispersed particles, a result that is anticipated from the imaging data in Table 1 and Fig. S3.
Fig. 2.
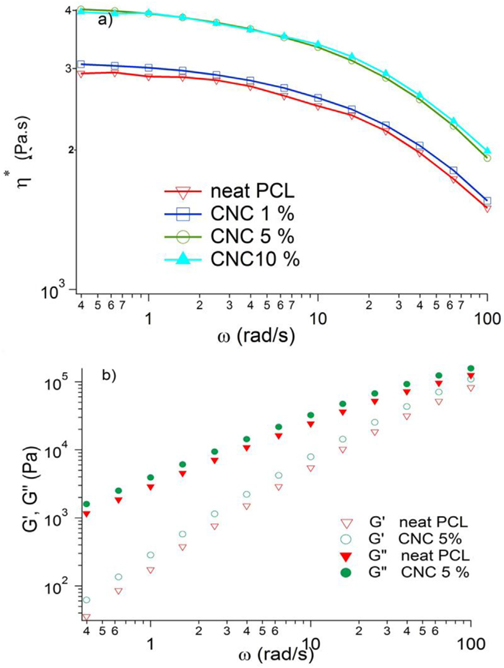
a) Magnitude of complex viscosity versus angular frequency for PCL and PCL/CNC nanocomposites b) storage modulus and loss modulus versus angular frequency for PCL and PCL/CNC (5%) nanocomposite. All measurements are done at 105 °C.
We now turn attention to the crystallization kinetics, first examining the effect of CNC surface modification on the crystallization kinetics using rheology alone and then the relative growth of crystallinity and modulus via the rheo-Raman measurements. The enhancement in modulus growth that is induced by the CNCs is measured via small amplitude rheology, following the isothermal protocol described above is shown in Fig. 3. There are two trends evident in this plot. The first is that for a given CNC loading, the upturn in the modulus growth occurs earlier upon surface modification; for example, one can compare the 5% modified against the 5% unmodified. This result is in accord with the increase in surface area that was reported earlier; it demonstrates that the surface-modification procedure not only enhances the melt rheology, but that with better dispersion of nanoparticles, there is an increase in the crystallization kinetics because CNCs act as nucleating agents. The second trend is the increase in modulus growth rate for a given modification type with increasing CNC content, up to 5%. This is true for both the modified and the unmodified CNCs. Fig. 3 also shows the growth of modulus between the two pure PCL samples: the neat extruded PCL and the neat pellet PCL. Remarkably, a significant enhancement in crystallization kinetics occurs when the sample has been through the twin-screw extruder, though the overall kinetics still do not exceed those of the 1%. This result is likely an indication that nano-particulate, such as from metal particles or gelled polymer particles are caused by the extrusion process itself, either by residual particles from previous extrusions or by nanoparticles that slough off the surface of the extruder during the process. We have determined from GPC measurements that there is negligible modification in the molar mass distribution upon extrusion (Fig. S4), indicating that it is unlikely that this observation is the result of chemical degradation of the polymer. This result is interesting from the general perspective of comparing 0% model crystallization studies with those that come from industrially extruded samples. Care should be taken to know if there is any pollution of the extruded samples by the extrusion process itself.
Fig. 3.
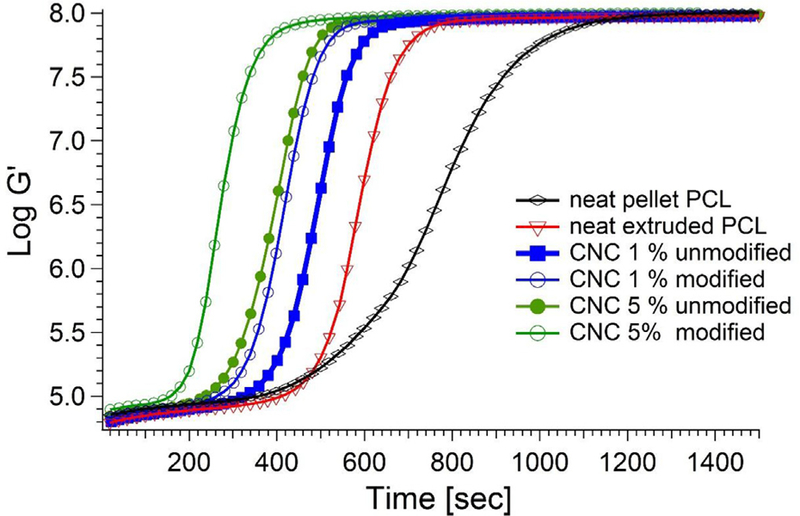
Storage modulus of the modified and unmodified 5% CNC, 1% CNC, neat pellet PCL and neat extruded PCL. All measurements are done at 42 °C.
We briefly describe the Raman spectra of molten and semi-crystalline states of neat extruded PCL and a PCL/CNC composite (Fig. 4). The differences between the spectra with and without CNC for a given temperature is negligible indicating that the CNC peaks are weak at these mass loading compared to the PCL, though CNCs are known to have spectral features in the range of (1000–1500) cm−1 [41]. To quantify the mass fraction of the crystalline phase, we use the approach of Kotula et al. [42] where the basis spectra were determined for the C=O peak. A linear relationship was found between DSC determined crystallinity and the normalized peak area of the basis spectra that contains a peak at 1722 cm−1, so that αc = βIcr / Itot where αc is the crystalline mass fraction, Icr is the Raman intensity of the basis spectra at 1722 cm−1, Itot is the total of that in the C=O region and β was found to be 1.26. Fig. 4b shows the deconvolution of the Raman spectra in the C=O region into three basis spectra including the one with a peak at 1722 cm−1. To understand the relative growth of modulus and crystallinity induced by the extrusion and the nanoparticles, we simultaneously measure the modulus from rheology, the crystalline mass fraction from Raman spectroscopy and the reflected cross polarized light during isothermal crystallization.
Fig. 4.
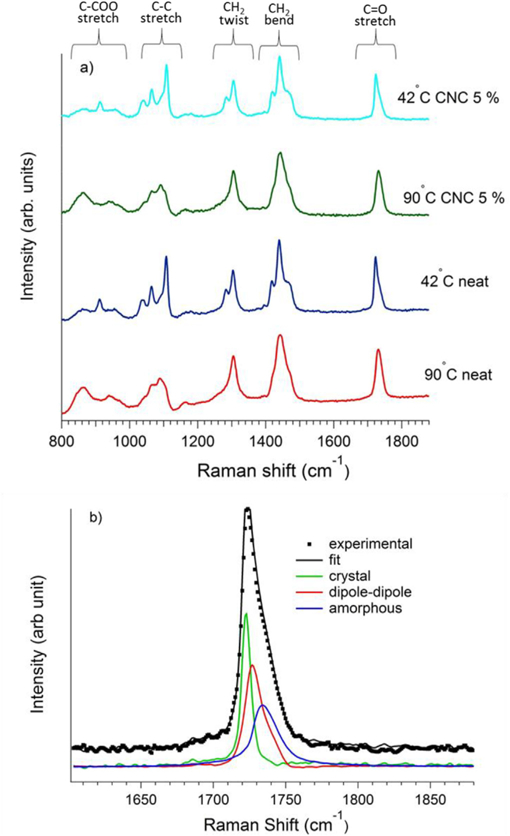
a) Raman spectra of the 5% PCL/CNC nanocomposite (upper two curves) and the neat pellet PCL (lower two curves) in the melt (90 °C) and semi-crystalline (42 °C) states. b) Raman spectra in the C=O region showing the deconvolution of the curve peak into melt (amorphous and dipole-dipole) and crystal basis spectra at 1733 cm−1 and in the 1722 cm−1 respectively.
Fig. 5 shows the rheo-Raman results of the isothermal crystallization of three modified samples (1, 5 and 10) % as well as the controls that do not contain CNCs (for clarity, we only show results from the modified CNCs). For the rheological and modulus measurements (Fig. 5a) we note the trend identified previously regarding the relative increase in crystallization kinetics with increasing CNC content (Fig. 3). The modulus value reported here is consistent with the measurements of Wang et al. [43]. We do not observe an increase in modulus with increasing CNC mass fraction; this is likely due to the effect being small at these volume fractions and our use of a sub-optimal geometry to make such a measurement (parallel plate rheometry is not accurate compared to standard DMA for measurement of crystalline modulus). Fig. 5b shows the crystalline mass fraction during the isothermal crystallization. However, the modified 10% nanocomposite does not show an increased rate. This is likely due to the reduction in available nucleating area due to the significant degradation of dispersion quality (Fig. S3), despite the two-fold increase in the number of potential nucleating centers (Table 1). By simple inspection, the same trend regarding the increase in crystallization rate can be gleaned from the Raman measurements as was seen previously for the modulus enhancements. The αc starts at negligible values, then increases measurably at times ranging from 200 s to 600 s depending on the concentrations of CNCs. The crystallinity grows to an average mass fraction of 0.42 ± 0.01. An interesting feature of this data concerns the upturn of the modulus as compared to the upturn in the crystallinity for a given sample. For the neat pellet PCL, the two upturns occur at roughly the same time point; however, for all the extruded samples, the upturn in modulus curve occurs well before that of the crystallinity. We return to this point in further discussion.
Fig. 5.
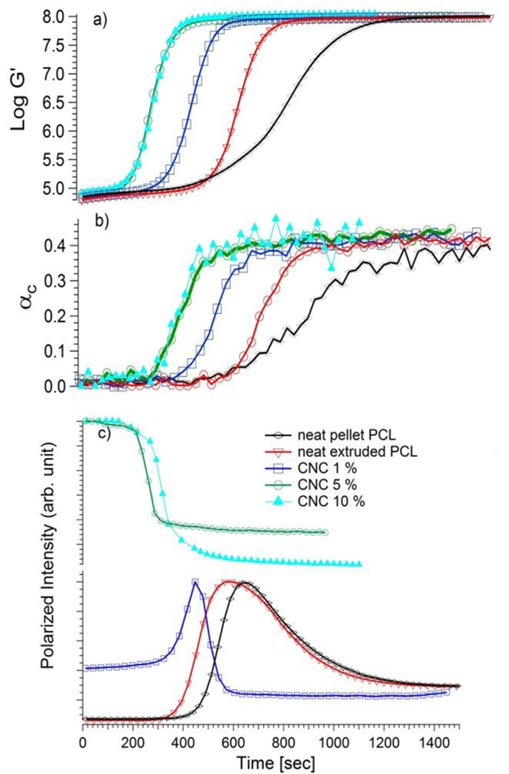
a) storage modulus b) Raman crystallinity c) Intensity profile for neat (pure and extruded) PCL and PCL/CNC (modified) composites, all measurements were carried at isothermal temp, 42 °C.
Fig. 5c shows the simultaneous reflected mode polarized optical microscopy measurements for the same five samples. At, t = 0 s, the reflected depolarized intensity is negligible for the two control PCL samples since they are fully molten and non-birefringent, but as CNCs are added it becomes finite and increases with the mass fraction of CNC. This non-zero intensity at t = 0 s, before crystallization starts, is due to the birefringent nature of the CNCs themselves. The changes in reflected light intensity with time, rather than the magnitude of the intensity itself then serves as a marker for the crystallization. For all cases, the integrated pixel intensity is initially constant with time; the reflection mode imaging showed no structural features under crossed polarizers. In separate measurements, polarized transmission optical microscopy at higher magnification with a thinner sample did not reveal significant growth of spherulites, instead a non-distinct “grainy” structure appeared during crystallization (Fig. S5). At approximately 480 s for neat pellet and 360s for neat extruded PCL, the intensity increased due to the appearance of birefringent structures and then after reaching the peak value, the intensity decreased as sample became increasingly turbid due to light scattering structures growing in the bulk [44]. It should be noted that the increase in average pixel intensity appears prior to any observable conformational change in Raman spectra or modulus change in both the neat PCL and 1% CNC sample. Prior results have also shown that light scattering appears well before crystallinity in rheology and X-ray scattering measurements [45–47]. In the 5% and 10% samples there is only a decrease in intensity of the polarized intensity; this is due to the birefringence and turbidity of these samples from the CNCs themselves. Interestingly, the time at which the birefringent structures change coincides with the upturn in rheology. It is unclear at this point that the effect stems from an optical interaction between the CNCs and the crystallizing sample, or if it is from a change in the nature of the crystallinity itself.
A straightforward method to extract the changes in the relationship between the growth of modulus and that of crystallinity as a function of nanoparticle content is to plot the times to reach 50% of the logarithm of final elastic modulus value and 50% of the final crystallinity value for each condition. Fig. 6 shows this analysis extracted from the data in Fig. 5a and b; note that both controls at 0% CNC are shown. First, there is the decrease in the time scales as CNC content is increased, and there is a decrease in time scale from the case of neat pellet PCL to neat extruded PCL; this effect was noted in Fig. 5. A closer examination reveals that the ratio of time scales for 50% growth, , is near unity (1.05) for the neat pellet PCL whereas it is 1.26 for the 5% samples. This reflects that the nanoparticles cause the upturn in the modulus to occur before the upturn in crystallinity.
Fig. 6.
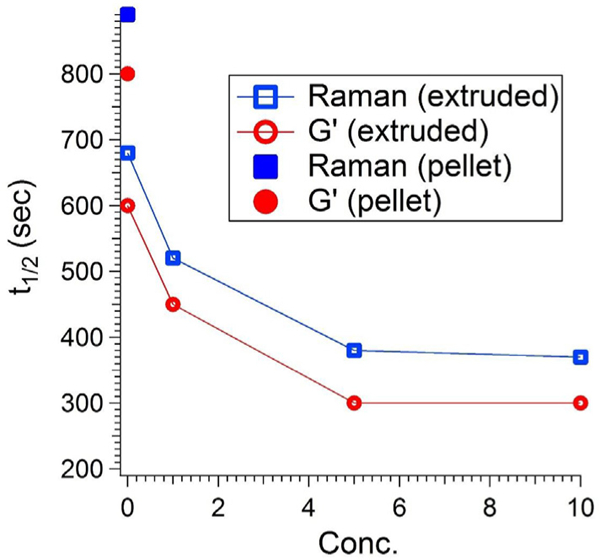
Half-time crystallization from storage modulus (rheology), and Raman crystallinity of neat pellet PCL (solid symbol) and extruded PCL and PCL/CNC composites (hollow symbol) at 42 °C.
In Fig. 7 we construct a plot of the modulus as a function of the degree of space filling of the crystalline domains, ξ, where . Here we define ϕ as the crystalline volume fraction calculated from the mass fraction (αc) obtained using Raman measurements (equation (1)):
| (1) |
Here νm and νc are the specific volume of the melt and crystal phases, respectively and have been reported in the literature: νm =9.1 × 10⁻⁷m3/g and νc =8.5 × 10⁻⁷m3/g [48]. As the modulus and crystallinity data are sampled at different rates, the modulus data is interpolated so that they can be effectively be reported at the same time. For clarity, we show only the 0% controls and the 5%. The (1 and 10) % curves lie near that of the 5% data. We can observe the stark difference between the neat pellet PCL and the other curves, which is again a reflection of the fact noted above that for the CNC containing samples and the extruded control, the upturn in modulus occurs before that of crystallinity.
Fig. 7.
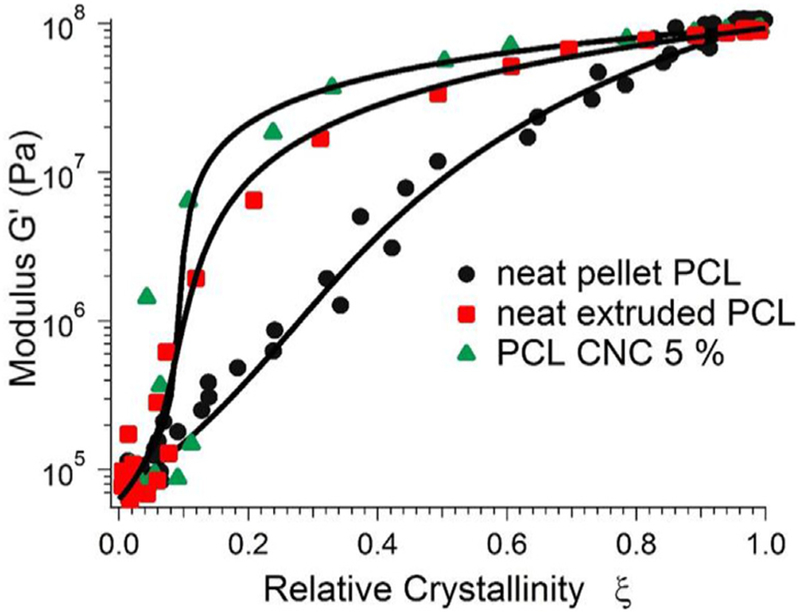
Representative fit for GEM percolation model for neat pellet PCL, neat extruded PCL and 5% PCL/CNC nanocomposite; all measurements done at 42°C.
We can fit the data in Fig. 7 to the GEM model, which is based on the elastic version of the Krieger- Dougherty equation to develop a suspension-based model across the percolation transition [48]. The GEM equation utilized is shown in Equation (2):
| (2) |
Here, is the magnitude of the complex modulus at t=0 during isothermal crystallization, is the magnitude of the modulus at when crystallinity has filled the space, and is the magnitude of the complex modulus at time t. q is the scaling exponent and A is defined as:
| (3) |
is then the critical percolation threshold.
We fit Equation (2) to A and the scaling exponent q as shown in Table 2. We therefore define an intrinsic modulus that describes an increase in the modulus due to small addition of crystalline material. The values reported in Table 2 further show that for the extruded samples the intrinsic modulus is higher indicative of non-spherical domains as in agreement with lower percolation resulting in high aspect ratio of the crystalline domains [49]. The fitting results in Fig. 7 show that the model provides an acceptable fit to the storage modulus over the entire crystallization process. The critical percolation threshold only accounts for the melt and semi-crystalline phases of the polycaprolactone matrix. To calculate the critical percolation fraction of the composite material, we multiply the critical percolation fraction by the volume fraction of polycaprolactone, where xp is the polymer mass fraction, ρp is the polymer density in the melt state (1.1kg/m3), and ρCNC is the CNC density(1.6kg/m3). The critical percolation fraction of the composite is reported in Fig. 8, where at zero volume fraction . The primary result is that the percolation threshold drops from 0.33 for the neat pellet PCL to values of approximately 0.1 for the other samples (i.e. the extruded pellet PCL, and the CNC containing samples). There is a slight decrease in the composite critical percolation fraction at the 10% CNC loadings. However, the decrease is comparable to the experimental uncertainty and so we do not wish to overinterpret that result. The scaling exponent q is related to the sharpness of the fitting curve at the point of the critical percolation fraction; lower numbers indicate a sharper transition. While the relative error in this fitted exponent is large, there is a clear trend towards lower values for the neat extruded and then the CNC containing samples compared to the neat pellet. This is another indication of the change in crystalline kinetics, as manifest through the crystalline-modulus relationship with the addition of particulates and CNCs. The values and q are reported in Table 2.
Table 2.
Composite critical percolation concentration , exponent (q) and as function of concentration of CNCs.
| Samples | q | ||
|---|---|---|---|
| neat pellet PCL | 0.33 ± 0.04 | 2.11 ± 0.37 | 6.40 ± 1.37 |
| neat extruded PCL | 0.11 ± 0.03 | 1.04 ± 0.08 | 9.45 ± 2.42 |
| 1% modified CNC | 0.12 ± 0.03 | 0.79 ± 0.09 | 6.67 ± 1.68 |
| 5% modified CNC | 0.09 ± 0.02 | 0.70 ± 0.07 | 7.77 ± 1.62 |
| 10% modified CNC | 0.1 ± 0.03 | 0.78 ± 0.17 | 8.21 ± 2.50 |
Fig. 8.
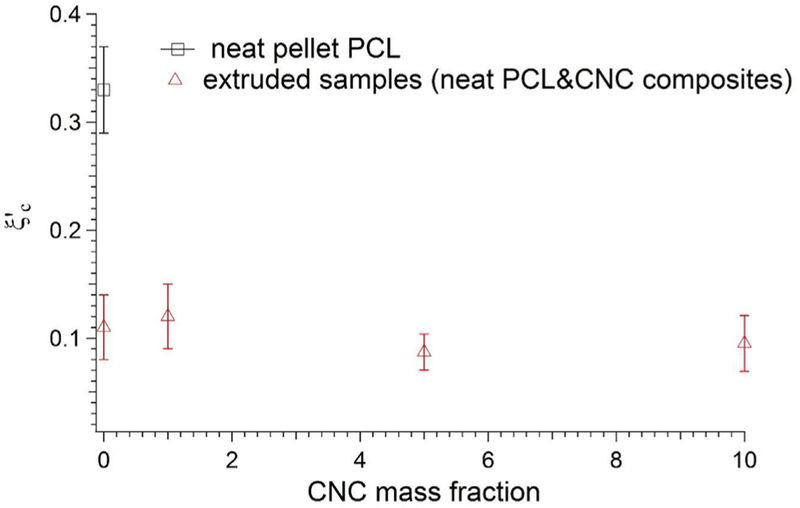
Percolation transition conc. for neat pellet PCL, neat extruded PCL and PCL/CNC composites, pellet form of the neat PCL has higher percolation conc. than the extruded forms.
We can thus consider two distinct trends that are embedded in the data: changes of crystallization rate and of percolation threshold. The progressive increase in crystallization rate in going from neat pellet PCL to extruded pellet PCL and with the further increase in the 1% and then 5% CNC samples is clearly observed. (The 5% and 10% are similar, as discussed previously). The second trend is the shift in the percolation threshold that is exhibited in the extruded samples, either with or without added CNCs. In considering the origin of these two effects, we first consider the role of the CNCs (or impurities in the case of extruded pellet PCL). As discussed earlier, it is known that CNCs and nanoparticles in general can increase density of nucleation sites and thus increase the crystallization rate. This effect is certainly responsible for the increased crystallization rate that we observe here. However, it does not explain the decrease in the percolation threshold. Another way to increase the nucleation density would be to decrease the crystallization temperature in an isothermal crystallization experiment. This was done in the previous work that modeled PCL crystallization via GEM, and it was found that this threshold is independent of temperature [50]. Since is reflective of the underlying geometry of the crystallizing entities, it is also intuitive that it should not be a function of nucleation density in the case where the nucleation density simply changes.
There is a limited temperature range over which these experiments can be conducted. At lower values of Tc, the crystallization commences before temperature equilibrium is achieved. At higher temperatures, the experiments become quite slow and difficult to reproduce. The crystallization kinetics of polycaprolactone (without filler) was measured within the temperatures range of 40–44 °C by Kotula et al. [50]. Though it is a limited temperature range, there were no qualitative changes in the kinetics, just quantitative changes in rates. In the current experiments, we have found qualitatively similar behavior at 40 °C.
An explanation for the change in percolation threshold comes from considering changes in the symmetry of crystallization. Nominally, we expect that spherulites will growin an isotropic fashion. However, if the crystallization proceeds in an anisotropic fashion, then GEM predicts that the percolation threshold will drop. As discussed in the Introduction, it is known that nano-fibers can template polymer crystallization, so the resulting crystalline domains can be highly elongated. In the theoretical case of overlapping ellipsoids, the percolation threshold is inversely proportional to the ellipse aspect ratio [48]. We hypothesize that the crystals nucleated by the high aspect ratio CNCs, or even from small particles present from the extrusion process grow as anisotropic domains. If the impingement (percolation) occurs while these domains are still anisotropic, then a reduced percolation threshold will be observed. The effect of the filler particles on the percolation threshold is schematically illustrated in Fig. 9.
Fig. 9.
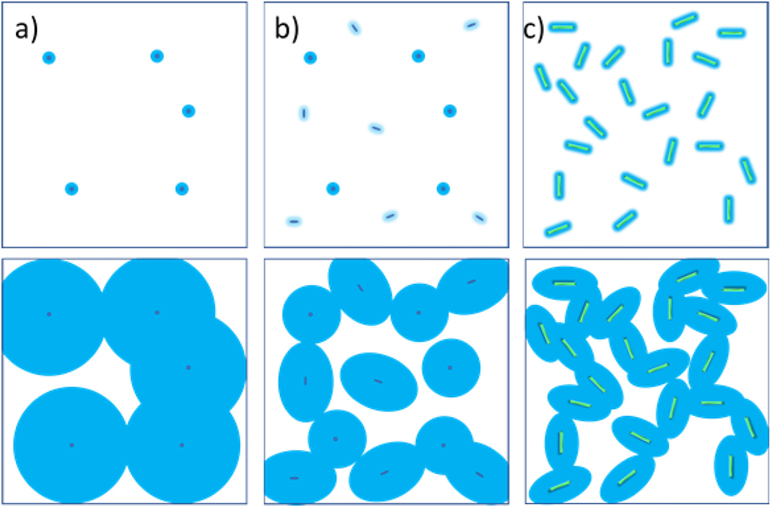
Schematic showing crystallization and percolation in a) pellet neat PCL b) pellet extruded PCL c) CNC filling samples. In neat PCL, the crystalline domains have to be fairly large in order to overlap and percolate. The crystalline fraction at which this happens is higher. In the neat extruded PCL, small particles present due to extrusion grow as anisotropic domains, as similar to the CNC filled composite, which results in smaller percolation and the overall crystalline fraction being lower for these samples.
4. Conclusions
The modification of mechanical properties of bio-compatible semi-crystalline nanocomposites is complex because of the inter-related issues of dispersion, processing and crystallization phenomena. Controlling nanoparticle dispersion in polymer melts is a significant challenge and measurement of its effect on crystallization is non-trivial. Here, we introduce a novel system for the study of a bio-derived nanoparticle in a biocompatible semi-crystalline polymer by modification of a simple ion-exchange method. The simple ion exchange method improves the thermal stability while lowering the surface energies of CNCs to allow for melt blending with hydrophobic polymers like PCL. We showed that the CNCs effectively act as nucleating agents enhancing the overall crystallization rate and by analyzing the modulus-crystallinity data using a generalized effective medium equation, we find a critical percolation threshold which decreases with the addition of nanoparticles and extrusion. Overall, this work illustrates the complexity of crystallization phenomena in CNC nanocomposites and how various parameters including nanofiller surface area (greater surface area through modification of CNCs), percolation threshold and dispersion quality in polymer matrix coordinate to govern the crystallization kinetics. Making such connections between nanoparticle dispersion and organization with macroscale properties is a crucial aspect for the optimization of the processing conditions and the properties of the end product.
Supplementary Material
HIGHLIGHTS.
Rheo-Raman captures growth of modulus and crystallinity during crystallization.
CNCs strongly increase crystallization kinetics of PCL.
CNCs decrease percolation threshold and induces anisotropic crystalline structures.
Acknowledgements
The authors wish to thank Wesley Farrell for performing GPC measurements.
Appendix A. Supplementary data
Supplementary data related to this article can be found at https://doi.org/10.1016/j.polymer.2018.08.007.
Footnotes
Official contribution of the National Institute of Standards and Technology; not subject to copyright in the United States.
Publisher's Disclaimer: Disclaimer
Certain commercial equipment, instruments, or materials are identified in this paper in order to adequately specify experimental procedure. Such identification does not imply recommendation or endorsement by the National Institute of Standards and Technology, nor does it imply that the materials or equipment identified are necessarily the best available for the purpose.
References
- [1].Mi H-Y, Jing X, Peng J, Salick MR, Peng X-F, Turng L-S, Poly(ε-caprolactone) (PCL)/cellulose nano-crystal (CNC) nanocomposites and foams, Cellulose 21 (2014) 2727–2741. [Google Scholar]
- [2].Xiang C, Taylor AG, Hinestroza JP, Frey MW, Controlled release of nonionic compounds from poly(lactic acid)/cellulose nanocrystal nanocomposite fibers, J. Appl. Polym. Sci 127 (2013) 79–86. [Google Scholar]
- [3].Yang J, Zhao J-J, Han C-R, Duan J-F, Xu F, Sun R-C, Tough nanocomposite hydrogels from cellulose nanocrystals/poly(acrylamide) clusters: influence of the charge density, aspect ratio and surface coating with PEG, Cellulose 21 (2014) 541–551. [Google Scholar]
- [4].Juntaro J, Ummartyotin S, Sain M, Manuspiya H, Bacterial cellulose reinforced polyurethane-based resin nanocomposite: a study of how ethanol and processing pressure affect physical, mechanical and dielectric properties, Carbohydr. Polym 87 (2012) 2464–2469. [Google Scholar]
- [5].Kumar A, Negi YS, Bhardwaj NK, Choudhary V, Synthesis and characterization of cellulose nanocrystals/PVA based bionanocomposite, Adv. Mater. Lett 4 (2013) 626–631. [Google Scholar]
- [6].Sain S, Sengupta S, Kar A, Mukhopadhyay A, Sengupta S, Kar T, Ray D, Effect of modified cellulose fibres on the biodegradation behaviour of in-situ formed PMMA/cellulose composites in soil environment: isolation and identification of the composite degrading fungus, Polym. Degrad. Stabil 99 (2014) 156–165. [Google Scholar]
- [7].Khoshkava V, Kamal MR, Effect of Cellulose Nanocrystals (CNC) Particle morphology on dispersion and rheological and mechanical properties of polypropylene/CNC nanocomposites, ACS Appl. Mater. Interfaces 6 (2014) 8146–8157. [DOI] [PubMed] [Google Scholar]
- [8].Qua EH, Hornsby PR, Preparation and characterisation of nanocellulose reinforced polyamide-6, Plast. Rubber Compos 40 (2011) 300–306. [Google Scholar]
- [9].Junior de Menezes A, Siqueira G, Curvelo AAS, Dufresne A, Extrusion and characterization of functionalized cellulose whiskers reinforced polyethylene nanocomposites, Polymer 50 (2009) 4552–4563. [Google Scholar]
- [10].Tian C, Fu SY, Meng QJ, Lucia LA, New insights into the material chemistry of polycaprolactone-grafted cellulose nanofibrils/polyurethane nanocomposites, Cellulose 23 (2016) 2457–2473. [Google Scholar]
- [11].Wang Y, Xu C, Wu D, Xie W, Wang K, Xia Q, Yang H, Rheology of the cellulose nanocrystals filled poly (є-caprolactone ) biocomposites, Polymer 140 (2018) 167–168. [Google Scholar]
- [12].Zimmermann T, Pöhler E, Geiger T, Cellulose fibrils for polymer reinforcement, Adv. Eng. Mater 6 (2004) 754–761. [Google Scholar]
- [13].Siqueira G, Bras J, Dufresne A, Cellulose bionanocomposites: a review of preparation, properties and applications, Polymers 2 (2010) 728–765. [Google Scholar]
- [14].Azizi Samir MAS, Alloin F, Dufresne A, Review of recent research into cellulosic whiskers, their properties and their application in nanocomposite field, Biomacromolecules 6 (2) (2005) 612–626. [DOI] [PubMed] [Google Scholar]
- [15].Wambua P, Ivens J, Verpoest I, Natural fibres: can they replace glass in fibre reinforced plastics, Compos. Sci. Technol 63 (2003) 1259–1264. [Google Scholar]
- [16].Oksman K, Mathew AP, Bondeson D, Kvien I, Manufacturing process of cellulose whiskers/polylactic acid nanocomposites, Compos. Sci. Technol 66 (2006) 2776–2784. [Google Scholar]
- [17].Woodruff MA, Hutmacher DW, The return of a forgotten polymer-Polycaprolactone in the 21st century, Prog. Polym. Sci 35 (2010) 1217–1256. [Google Scholar]
- [18].Sinha VR, Bansal K, Kaushik R, Kumria R, Trehan A, Poly-є-Caprolactone microspheres and nanospheres:an overview, Int. J. Pharm 278 (2004) 1–23. [DOI] [PubMed] [Google Scholar]
- [19].Melchels FPW, Domingos Marco A.N., Klein Travis J., Malda J, Bartolo PJ, Hutmacher DW, Additive manufacturing of tissues and organs 37 (2012) 1079–1104. [Google Scholar]
- [20].Zhou T, Zha J-W, Hou Y, Wang D, Zhao J, Dang Z-M, Surface-functionalized MWNTs with emeraldine base: preparation and improving dielectric properties of polymer nanocomposites, ACS Appl. Mater. Interfaces 3 (2011) 4557–4560. [DOI] [PubMed] [Google Scholar]
- [21].Fox DM, Rodriguez RS, Devilbiss MN, Woodcock J, Davis CS, Sinko R, Keten S, Gilman JW, Simultaneously tailoring surface energies and thermal stabilities of cellulose nanocrystals using ion exchange: effects on polymer composite properties for transportation, infrastructure, and renewable energy applications, ACS Appl. Mater. Interfaces 8 (2016) 27270–27281. [DOI] [PubMed] [Google Scholar]
- [22].Loo Y-L, Register RA, Ryan AJ, Dee GT, Polymer crystallization confined in one, two, or three dimensions, Macromolecules 34 (2001) 8968–8977. [Google Scholar]
- [23].Loo Y-L, Register RA, Ryan AJ, Modes of Crystallization in block copolymer microdomains: breakout, templated, and confined, Macromolecules 35 (2002) 2365–2374. [Google Scholar]
- [24].Chan CM, Wu J, Li JX, Cheung YK, Polypropylene/calcium Carbonate Nanocomposites, 43 (2002), pp. 2981–2992. [Google Scholar]
- [25].Varga J, Mudra I, Ehrenstein GW, Highly Active Thermally Stable Β-nucleating Agents for Isotactic Polypropylene, 74 (1999), pp. 2357–2368. [Google Scholar]
- [26].Shephard TA, Delsorbo CR, Louth RM, Walborn JL, Norman DA, Harvey NG, Spontak RJ, Self-Organization and Polyolefin nucleation efficiency of 1,3:2,4-Di-p-methylbenzylidene sorbitrol, J. Polym. Sci. B Polym. Phys 16 (1997) 2617–2628. [Google Scholar]
- [27].Di Maio E, Iannace S, Sorrentino L, Nicolais L, Isothermal crystallization in PCL/clay nanocomposites investigated with thermal and rheometric methods, Polymer 45 (2004) 8893–8900. [Google Scholar]
- [28].Lamberti G, Peters GWM, Titomanlio G, Crystallinity and linear rheological properties of polymers, Int. Polym. Process 22 (2007) 303–310. [Google Scholar]
- [29].Housmans J-W, Steenbakkers RJA, Roozemond PC, Peters GWM, Meijer HEH, Saturation of pointlike nuclei and the transition to oriented structures in flow-induced crystallization of isotactic polypropylene, Macromolecules 42 (2009) 5728–5740. [Google Scholar]
- [30].Roozemond PC, Janssens V, Puyvelde PV, Peters GWM, Suspension-like hardening behavior of HDPE and time-hardening superposition, Rheol. Acta 51 (2012) 97–109. [Google Scholar]
- [31].Pogodina NV, Winter HH, Polypropylene crystallization as a physical gelation process, Macromolecules 31 (1998) 8164–8172. [Google Scholar]
- [32].Hafsia KB, Ponçot M, Chapron D, Royaud I, Dahoun A, Bourson P, A novel approach to study the isothermal and non-isothermal crystallization kinetics of Poly (Ethylene Terephthalate) by Raman spectroscopy, J. Polym. Res 23 (2016) 1–14. [Google Scholar]
- [33].Hu Y, Liang JK, Myerson AS, Taylor LS, Crystallization monitoring by Raman spectroscopy: simultaneous measurement of desupersaturation profile and polymorphic form in flufenamic acid systems, Ind. Eng. Chem. Res 44 (2005) 1233–1240. [Google Scholar]
- [34].Amer M, Raman Spectroscopy for Soft Matter Applications, John Wiley & Sons, 2009. [Google Scholar]
- [35].Kelarakis A, Mai SM, Booth C, Ryan AJ, Can rheometry measure crystallization kinetics? A comparative study using block copolymers, Polymer 46 (2009) 2739–2747. [Google Scholar]
- [36].Kotula AP, Meyer MW, De Vito F, Plog J, Hight Walker AR, Migler KB, The rheo-Raman microscope: simultaneous chemical, conformational, mechanical, and microstructural measures of soft materials, Rev. Sci. Instrum 87 (2016) 105105. [DOI] [PubMed] [Google Scholar]
- [37].Zhang S, Minus ML, Zhu L, Wong C-P, Kumar S, Polymer transcrystallinity induced by Carbon nanotubes, Polymer 49 (2008) 1356–1364. [Google Scholar]
- [38].Lu K, Grossiord N, Koning CE, Miltner HE, Mele BV, Loos J, Carbon nano-tube/isotactic Polypropylene composites prepared by latex technology: morphology analysis of CNT-induced nucleation, Macromolecules, 41 (2208) 8081–8085. [Google Scholar]
- [39].Li L, Li CY, Ni C, Polymer crystallization-driven, periodic patterning on Carbon nanotubes, J. Am. Chem. Soc 128 (2006) 1692–1699. [DOI] [PubMed] [Google Scholar]
- [40].Natarajan B, Lachman N, Lam T, Jacobs D, Long C, Zhao M, Wardle BA, Sharma R, Liddle JA, The evolution of carbon nanotube network sturcture in unidirectional nanocomposites resolved by quantitative electron tomography, ACS Nano 9 (2015) 6050–6058. [DOI] [PubMed] [Google Scholar]
- [41].Lewandoska AE, Eichhorn SJ, Quantification of the degree of mixing of cellulose nanocrystals in the thermoplastics using Raman spectroscopy, J. Raman Spectrosc 47 (2016) 1337–1342. [Google Scholar]
- [42].Kotula AP, Snyder CR, Migler KB, Determining conformational order and crystallinity in polycaprolactone via Raman spectroscopy, Polymer 117 (2017) 1–10. [DOI] [PMC free article] [PubMed] [Google Scholar]
- [43].Wang Y, R-Perez M, Reis RL, Mano JF, Thermal and thermomechanical behaviour of polycaprolactone and starch/polycaprolactone blends for biomedical applications macromol, Mater. Eng 290 (2005) 792–801. [Google Scholar]
- [44].Migler KB, Kotula AP, Hight Walker AR, Trans-Rich Structures in early stage crystallization of polyethylene, Macromolecules 48 (2015) 4555–4561. [Google Scholar]
- [45].Tiang JS, Dealy JM, Shear -induced crystallization of isotactic polypropylene studied by simultaneous light intensity and rheological measurements, Polym. Eng. Sci 52 (2012) 835–848. [Google Scholar]
- [46].Xiao Z, Akpalu YA, New insights into the characteristics of early stage crystallization of a polyethylene, Polymer 48 (2007) 5388–5397. [Google Scholar]
- [47].Heck B, Kawai T, Strobl G, Time dependent light attenuation measurements used in studies of the kinetics of polymer crystallization, Polymer 47 (2006) 5538–5543. [Google Scholar]
- [48].Cotugno S, Di Maio E, Ciardiello C, Iannace S, Mensitieri G, Nicolais L, Sorption thermodynamics and mutual diffusivity of carbon dioxide in molten poly-caprolactone, Ind. Eng. Chem. Res 42 (2003) 4398–4405. [Google Scholar]
- [49].Garboczi EJ, Snyder KA, Douglas JF, Thorpe MF, Geometrical percolation threshold of overlapping ellipsoids, Phys. Rev 52 (1995) 819–828. [DOI] [PubMed] [Google Scholar]
- [50].Kotula AP, Migler KB, Evaluating models for polycaprolactone crystallization via simulatneous rheology and Raman spectroscopy, J. Rheol 62 (2018) 342–356. [DOI] [PMC free article] [PubMed] [Google Scholar]
Associated Data
This section collects any data citations, data availability statements, or supplementary materials included in this article.


