Abstract
We report the use of reflection-mode terahertz (THz) imaging in a transgenic mouse model of breast cancer. Unlike tumor xenografts that are grown from established cell lines, these tumors were spontaneously generated in the mammary fat pad of mice, and are a better representation of human breast cancer. THz imaging results from 7 tumors that recapitulate the compartmental complexity of breast cancer are presented here. Imaging was first performed on freshly excised tumors within an hour of excision and then repeated after fixation with formalin and paraffin. These THz images were then compared with histopathology to determine reflection-mode signals from specific regions within tumor. Our results demonstrate that the THz signal was consistently higher in cancerous tissue compared with fat, muscle, and fibrous tissue. Almost all tumors presented in this work demonstrated advanced stages where cancer infiltrated other tissues like fat and fibrous stroma. As the first known THz investigation in a transgenic model, these results hold promise for THz imaging at different stages of breast cancer.
Keywords: Terahertz imaging, reflection mode, breast cancer, transgenic, pathology
I. Introduction
Breast cancer accounts for 30% of all new cancer diagnoses [1] and is the most frequently diagnosed cancer in women in the United States [2]. For early-stage breast cancer, the current standard of care is breast-conserving surgery (BCS) followed by chemotherapy. Unfortunately, a dire limitation to this procedure is the incomplete local excision of the tumor, resulting in positive margins at the time of final pathology [3]. This leads to approximately 20% of patients requiring further surgery to attain clear margins [4]. In light of this, there is a critical need for an intra-operative imaging technology that can reliably evaluate the margins for possible presence of cancerous tissue. Such an evaluation requires the ability to accurately differentiate between normal and cancerous tissue as well as between different components of breast tissue – fat, muscle, and fibrous tissue.
Nearly 20 years ago, Hu et al employed terahertz (THz) imaging and demonstrated its capacity to differentiate between fat and muscle within porcine tissue [5]. Since then, THz technology has taken great strides, and noteworthy research has unveiled its significant potential for biomedical applications. Investigators have demonstrated the sensitivity of THz imaging in differentiating between different types of tissue present in both formalin-fixed, paraffin-embedded (FFPE) and fresh samples [6–13]. THz radiation is very sensitive to polar substances, such as water and hydration state. Therefore, THz waves can provide a better contrast for soft tissues than X-rays [14]. Physiologic changes associated with tumors generally lead to increased water content and decreased lipid concentration compared with normal tissue [15]. This suggested that water content and lipid concentration might lead to strong changes in the terahertz reflection. Nevertheless, a number of studies have imaged biologic samples that were fixed in formalin, dehydrated, and paraffin embedded for histopathologic examination and still found contrast between tumor and the surrounding normal tissue [7–13] suggesting that in addition to lipid changes, other factors such as increased cell density or the presence of certain proteins may also be responsible for contrast [16].
However, imaging of fresh human tissue from breast and other types of cancer outside of a surgical context is challenging. To circumvent this obstacle, many investigators have turned to mouse-model tumor xenografts to carry out their studies. Chen et al performed in vivo THz imaging on a subcutaneous xenograft mouse model and successfully detected early breast cancer [17]. They were also able to differentiate between cancerous and fatty tissue within fresh ex vivo. Also, Bowman et al successfully performed THz imaging and statistical analysis of fixed and fresh xenograft breast tumors [18]. A reflection-type THz imaging system was used on an orthotopic glioma rat model to demonstrate that the THz reflection intensity was higher in brain tumors than in the surrounding normal tissue [19], [20].
Although these studies have provided a wealth of information, tumor xenograft models fall short in closely mimicking the stages of cancer progression and underlying mechanisms. A recent study from our group demonstrated the ability of THz imaging to clearly distinguish between cancerous and fatty tissue in breast tumor xenografts grown from murine breast cancer cells [18]. However, the xenograft models were devoid of fibrous tissue, and therefore could not adequately represent human tissue. Transgenic mouse models offer a promising alternative to the conventional xenograft models for imaging, biological, and therapeutic investigations. Whereas xenograft models based on human breast cancer cells require the impairment of the immune system, genetically engineered mice provide a competent immune system where the tumor can grow, and its development can be followed from early time points [21]. The MMTV-PyMT transgenic mouse model has been widely used to investigate breast cancer due to its metastatic potential and how closely it reflects the many changes and aspects of human breast cancer progression. In this model, the promoter/enhancer mouse mammary tumor virus long terminal repeat (MMTV LTR) drives the expression of the oncoprotein polyoma middle T antigen (PyMT), resulting in the development of multifocal adenocarcinomas within the mammary epithelium, and also in metastatic lesions within the lymph nodes and lungs [22].
Plodinec et al investigated the nanomechanical signatures of normal and benign samples from both human breast biopsies and MMTV-PyMT mammary tissue. In contrast to the human breast samples, they found that healthy mammary fat pad tissue from this transgenic mouse model exhibited extensive amounts of adipose tissue (70–80%). At the early cancer stage, they observed basement membrane degradation, and the absence of collagen I at the soft core of the tumor. They noted that collagen I was instead increasingly present towards the periphery of the tumor.
Furthermore, they monitored the loss of integrin β1 expression in the MMTV-PyMT specimens at different tumor progressions stages, and found that the fibrous tissue was lost significantly early [23]. Similar findings were reported by Lin et al, wherein they noted the loss of β1-integrins was strongly associated with the MMTV-PyMT tumor progression [24]. They also observed that adipocytes formed the majority of the mouse mammary glands and they were located very close to the epithelial structures. This was very different from the human breast tissue, where extensive extracellular connective tissue stroma was present, resulting in the adipocytes being less proximal to the ductal epithelium. Almholt et al likewise observed that adipose tissue surrounded the epithelium in the MMTV-PyMT mouse gland in great amounts, whereas the human mammary epithelium was instead surrounded by a specialized fibroblastoid stroma not adjacent to the adipocytes [25].
In spite of these structural differences, the MMTV-PyMT breast cancer model has been proven to be a reliable model for metastatic breast cancer, sharing many more similarities than differences with human luminal breast cancer on a molecular and histological level [22,24,26]. While the MMTV-PyMT model possesses a high percentage of adipose tissue, it still results in a tumor microenvironment where some fibrous tissue is present. Moreover, this transgenic mouse model poses a level of complexity that more closely mimics that of human breast cancer tissue, and therefore presents a better model for investigating the THz reflection signatures acquired from breast tissue components in the native microenvironment.
The objective of this study is to determine the THz reflection differentiation between cancer and noncancerous (fibrous, fat, and muscle) tissue in a spontaneous model of breast cancer. Specifically, we use the MMTV-PyMT mouse model of breast cancer to obtain spontaneously generated breast tumors for THz imaging. To the best of our knowledge, this is the first time THz imaging has been investigated for imaging freshly excised breast cancer tumors derived from a transgenic mouse model. In addition to providing new knowledge about THz reflection from fat, fibrous and muscle tissue in orthotopic breast tumors, these results also lay the groundwork for investigating THz imaging at different stages of breast cancer progression.
This work is organized as follows: methodology including terahertz imaging system and mice tumor sample preparation in Sec. II; the experimental results of THz image correlation with pathology in Sec. III; and discussion and concluding remarks in Sec. IV.
II. Methods
Mice tumor sample preparation.
Protocols for all mouse experiments were approved by the Institutional Animal Care & Use Committee (IACUC) of the University of Arkansas. Four MMTV-PyMT mice between 3–4 weeks of age were purchased from The Jackson Laboratories. Mice were maintained under standard 12-hour light/dark cycles with regular access to food and water. Tumors were excised at between 5 and 11 weeks.
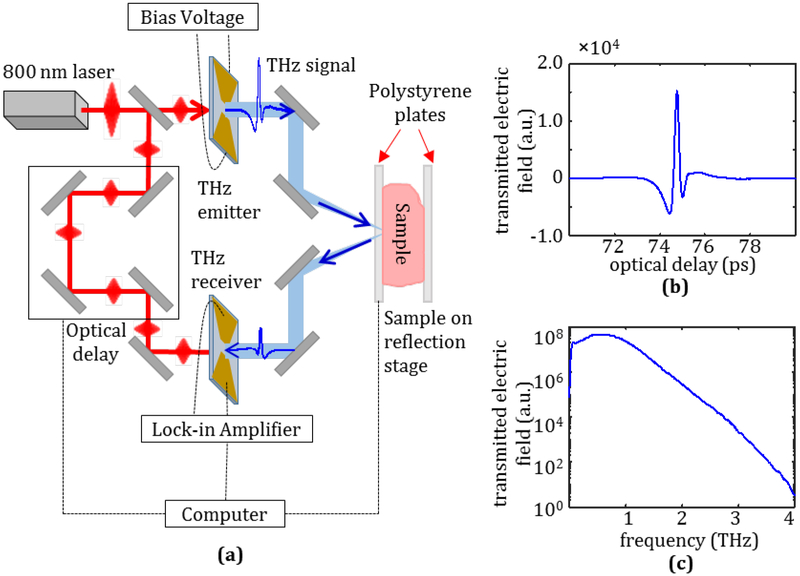
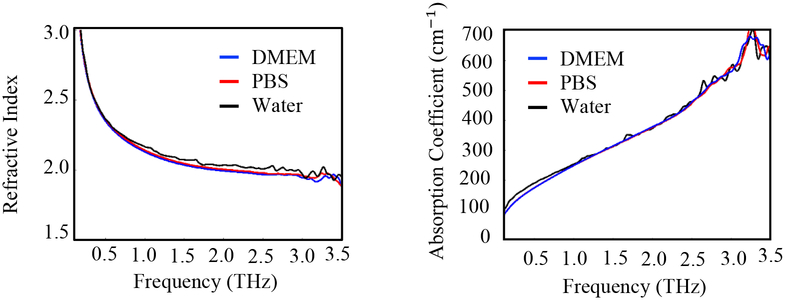
Upon excision of the tumor, the tissue was immersed in phosphate buffered saline (PBS) or in Dulbecco’s Modified Eagle Medium (DMEM). DMEM is often utilized in biobanks when handling human breast tissue and is investigated here to study potential changes in THz imaging from refrigeration and shipping of fresh tissue. Tissues in PBS were imaged an hour after excision, while tissues in DMEM were stored in a refrigerator and imaged within 24 hours, mimicking overnight shipping from a biobank. Upon conducting THz spectroscopy of DMEM and PBS, it was found that they have THz signature similar to water (see Appendix A). Therefore, the choice of solution when immersing fresh tissue did not affect the imaging. After being removed from medium, the tissue was dried using filter paper and positioned between two polystyrene plates with slight pressure to make its surface as flat as possible. The tissue sample was then positioned on the THz imaging scanner window prepared for the reflection mode (see Fig. 2). After THz imaging, the tissue was immersed in formalin and shipped to the Oklahoma Animal Disease Diagnostic Laboratory (OADDL), where it was embedded in paraffin for histopathology. Formalin fixed paraffin embedded (FFPE) tissue slices of 3–4 μm thickness were stained with hematoxylin and eosin (H&E) to produce the pathology image. The thickness of the fresh tissues handled in this work is approximately 5 mm while that of the corresponding FFPE tissues is between 3–4 mm due to possible shrinkage incurred during formalin fixation and slicing during the histopathology procedure. Subsequent THz imaging was performed on the FFPE block. The tissues in blocks were mounted on standard plastic pathology cassettes which prevented transmission imaging without destructive sectioning of the samples, so reflection imaging is observed here. The procedure is described in the diagram of Fig. 1. THz imaging of both fresh and FFPE tissue will be presented in Section III in order to compare the image contrast based on the water content in the tissue.
Fig. 2.
(a) Terahertz imaging system diagram for the reflection mode of fresh tumors, (b) Incident time domain THz pulse, and (c) frequency domain signal following Fourier transform.
Fig. 1.
Summary of imaging procedure of transgenic tumors
Experimental Terahertz Imaging System.
Terahertz imaging in this work is performed using a commercial THz system from TeraView, Ltd shown in the diagram in Fig. 2a. An 800 nm pulse from a Ti:Sapphire laser is passed through a beam splitter. One path of the laser is used to excite a biased THz emitter consisting of a gold bowtie antenna on a GaAs substrate, which emits a resulting time domain pulse in the THz range seen in Fig. 2b. The Fourier transform of the pulse is shown in Fig. 2c, demonstrating the spectral power of the pulse from 0.1 to 4 THz. The incident pulse is directed using mirrors to reflect off the sample under test, then a second set of mirrors directs the reflected signal to a THz receiver with the same construction as the emitter. The second path of the laser excites the receiver after passing through an optical delay line such that the incident THz field generates a current on the receiver measured by the computer. The sample stage moves in set increments using stepper motors to obtain the reflected signal at each point. For all results presented in this work the step size of the motor was 200μm while the spot size of the beam on the tissue surface at each point was function of frequency, e.g. at 1 THz the radius of the beam spot size is ~0.7271mm and at 2 THz it is ~0.3554mm.
Following the acquisition of the THz signal at each point, the THz image is produced by one of two methods. For fresh tissue samples mounted between polystyrene plates (see Fig. 2a), a power spectrum integration of the reflected frequency domain signal is taken at each point using the equation:
| (1) |
where Esamp is the measured sample signal, Eref is the reference reflection signal from the airpolystyrene interface, and f1 and f2 are the selected frequencies over which to perform the integration. This kind of power integration has been suggested as a principal signal component to provide distinction between tissue regions [27]. The authors previously found this calculation to provide consistently good images for freshly excised xenograft mice tumors for an integration range from 0.5 to 1.0 THz, so the same frequency range will be used here [18]. For imaging the FFPE tissue, the top of the tissue block is positioned directly on the scanning window of the system. In this case, the THz images are obtained by taking the peak value of the reflected time domain electric field signal normalized against the peak signal measured from a gold mirror reference.
III. Experimental Results
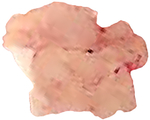
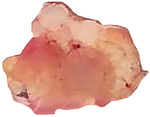
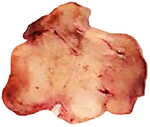
In this work, 15 breast tumors were excised from 4 transgenic mice and imaged using the THz imaging system. As predicted from literature [22], the transgenic mice tumors share complex structures in their tissues with multiple regions of cancer, cancer infiltrated fat, fat, cystic areas, fibro, and others as will be discussed in this Section. This contrasts with previously studied tumor xenografts, which consisted mostly of cancer and fat [18]. Seven tumors are selected here, as described in Table 1, to present the THz reflection imaging results for both freshly excised tumor tissue and FFPE tissue block for each tumor. The tumors are numbered from 1–7 with an additional code referring to the sequence of excision. In all results presented here, we observed that the histopathology process altered the tumor tissue shape and size, causing the THz images of fresh tissue and the pathology images to be different. The 15 tumor tissues were scanned over a full year from June 2017 to July 2018 and showed consistent contrast in all images as will be seen below.
Table. 1:
Summary of presented tumors
| Sample no. | Tumor 1 (14-A) | Tumor 2 (15-A) | Tumor 3 (15-D) | Tumor 4 (15-E) | Tumor 5 (15-B) | Tumor 6 (14-C) | Tumor 7 (12-A) |
|---|---|---|---|---|---|---|---|
| Photo of fresh tissue |  |
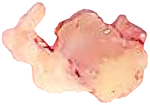 |
 |
 |
 |
 |
 |
| Size (mm) | ~14×9×5 | ~19×12×5 | ~21×8×5 | ~25×8×5 | ~16×11×5 | ~18×14×5 | ~20×17×5 |
| Solution | PBS | PBS | DMEM | DMEM | PBS | DMEM | PBS |
Tumor 1.
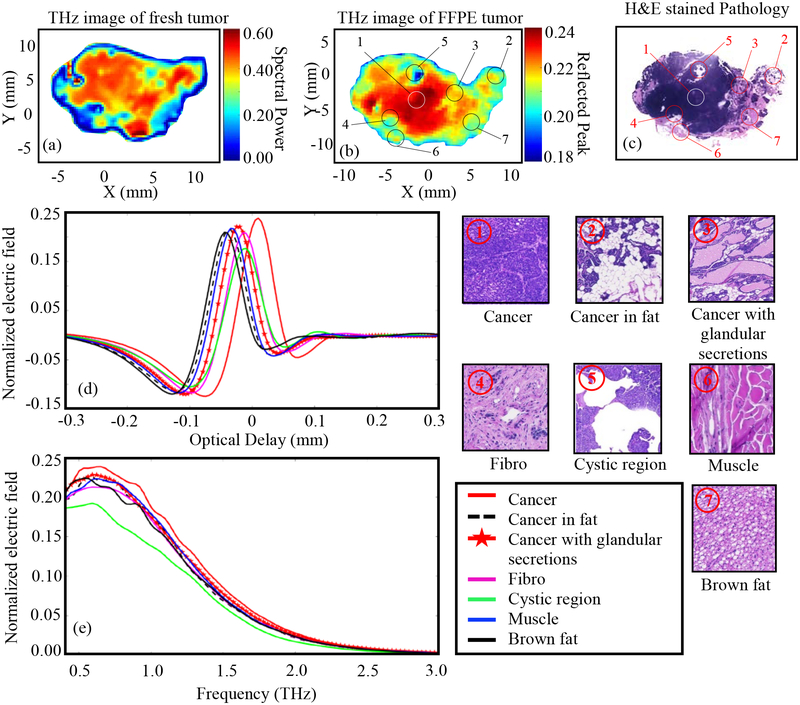
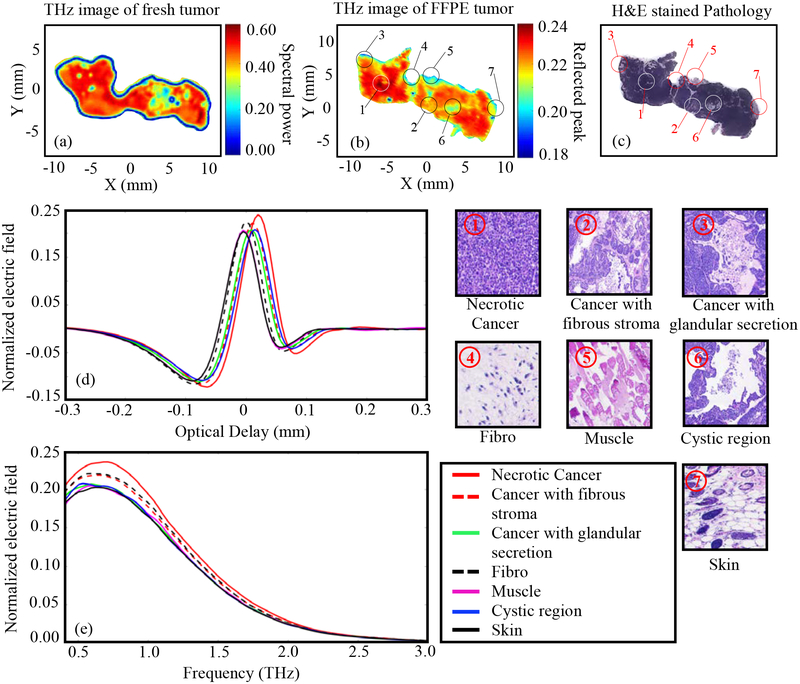
The results of Fig. 3 represent THz imaging of Tumor 1 (14-A). Fig. 3a shows the THz image of the freshly excised tumor represented in the frequency domain spectral power between 0.5 and 1.0 THz. Adding frequencies above 1THz to the spectral power did not improve the results. Fig. 3b shows the normalized THz time-domain peak from the FFPE tissue block. The low power pathology image of tissue sliced at 3–4 μm from the top surface of the FFPE block is shown in Fig. 3c. The pixels in the pathology image marked as ①-⑦ are selected from different tissue types based on the pathology report. The high power images of the surrounding regions of these pixels are shown in the figure. The time domain signals (from FFPE THz imaging data) at different tissue types marked as ①-⑦ are plotted in Fig. 3d showing the difference in THz signal magnitude of each type. The spectra of the reflected electric field signals of Fig. 3d are demonstrated in Fig. 3e. All THz reflected signals are normalized with respect to the reflected signal from the gold mirror. The baseline noise of the system is usually around ± 0.01 to ± 0.035 for the raw measured electric field without normalization. For the reference peaks taken across the scans in this work, this correlates to a noise level of about ± 0.0005 to ± 0.00175 in the normalized scan values, which is insignificant compared to the normalized measured data from the tissue.
Fig. 3.
THz reflection images of transgenic mice breast tumor 1(14-A), (a) Frequency domain THz image of freshly excised tumor represented by spectral power, (b) Time domain THz image of FFPE tumor tissue block represented by peak value, (c) Low power pathology image (d) Time domain signals of normalized reflected electric field at selected pixels ①-⑦, (e) Spectrum of normalized reflected electric field of the signals shown in (d). The high power pathology images of surrounding regions of ①-⑦ are shown. All THz signals are normalized with respect to a reference signal reflected from a gold mirror.
The results of Fig. 3d demonstrate that the magnitude of the reflected THz signal from the cancer region is more than that of any other region in the tissue. This can be seen in the THz images of both fresh and FFPE tissue in Figs. 3a–b, where the cancer region (represented in red color in the image color bar) dominates the tumor. The THz image of the FFPE tissue is particularly effective in differentiating between the cancer and other regions. For example, the cancer with glandular secretions can be seen as yellowish-red region and the cancer infiltrated in fat can be seen as yellow-greenish region in Fig. 3b. The dark blue region in this image represents the cystic region in the cancer. Although fibrous, muscle, and brown fat regions show almost similar reflection in the THz image, they are well differentiated from cancer. For the THz image of fresh tissue in Fig. 3a, the cancerous and non-cancerous regions are well differentiated. The dark blue boundary in the image of fresh tumor represents an edge effect due to the difference in surface level of the tissue with respect to the polystyrene slide, which is not the case with the FFPE tissue. Considering the complexity of the transgenic mouse tumor shown in Fig. 3, a good agreement between the THz and pathology images is demonstrated, with slightly better results for the FFPE tissue than that of fresh tissue. It should be noted that THz imaging of all fresh tissues was conducted blindly with respect to the pathology, where the histopathological imaging was processed afterward.
Tumor 2.
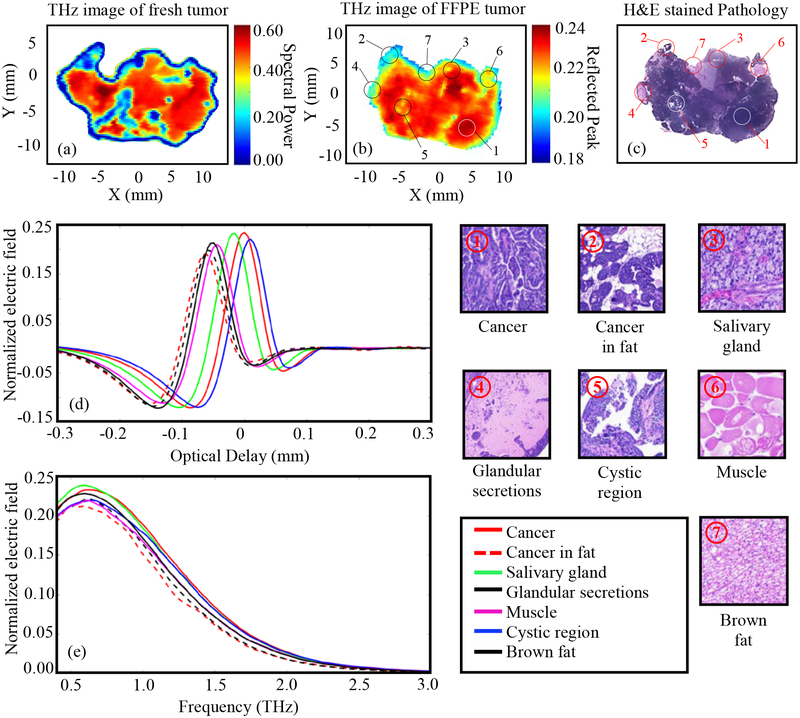
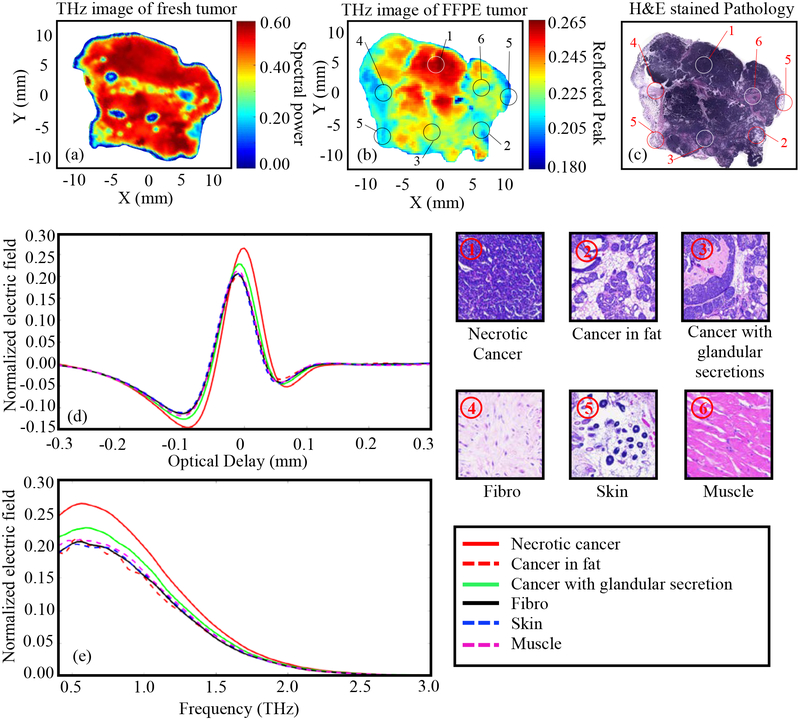
The results of Fig. 4 represent THz imaging of Tumor 2 (15-A). From Fig. 4c it can be seen that most of tumor 2 is cancer (the red color in Figs. 4a and 4b image color bars). Meanwhile, other regions show intensity differentiation in the THz image in Fig. 4b. For example, muscle ⑥ shows a yellowish-red color, cancer in fat ② appears cyan, the cystic area in the cancer ⑤ is yellow, the glandular secretions ④ show a greenish-blue color, and brown fat ⑦ shows a light blue color. It should be noted here that the differentiation in THz images for fresh (Fig. 4a) and tissue block (Fig. 4b) is primarily due to the difference in the imaging surfaces which results in different features in the image. For example, the cancer in fat region in Fig. 4c ② shows dark blue color in Fig. 4a which demonstrates the presence of more fat in that region. After the histopathology slicing of the block, another tissue layer of cancer infiltrated in the fat becomes visible in Fig. 4b (② in Fig. 4c). There are additional regions of low reflection across the center of the tissue in Fig. 4a which are due to air bubbles that arise while mounting the fresh tissue on the polystyrene plate for scanning rather than from fat. One differentiation that THz imaging could not demonstrate in this tumor is between cancer and salivary glands, indicated by ① and ③ in Fig. 4c. These two regions do not show any color difference in the THz images in both Figs. 4a and Fig.4b. The presence of salivary gland in this tumor is due to the natural tendency of transgenic mice tumors to grow around the neck of the mouse, and salivary gland would not exist in human breast tumors. In conclusion, we can see that the THz image in Fig. 4b is a better representation of the pathology image of Fig. 4c compared with the fresh tumor image in Fig. 4a.
Fig. 4.
THz reflection images of transgenic mice breast tumor 2 (15-A), (a) Frequency domain THz image of freshly excised tumor represented by spectral power, (b) Time domain THz image of FFPE tissue block represented by peak value, (c) Low power pathology image (d) Time domain signals of normalized reflected electric field at selected pixels ①-⑦, (e) Spectrum of normalized reflected electric field of the signals shown in (d). The high power pathology images of surrounding regions of ①-⑦ are shown. All THz signals are normalized with respect to a reference signal reflected from a gold mirror.
Tumor 3.
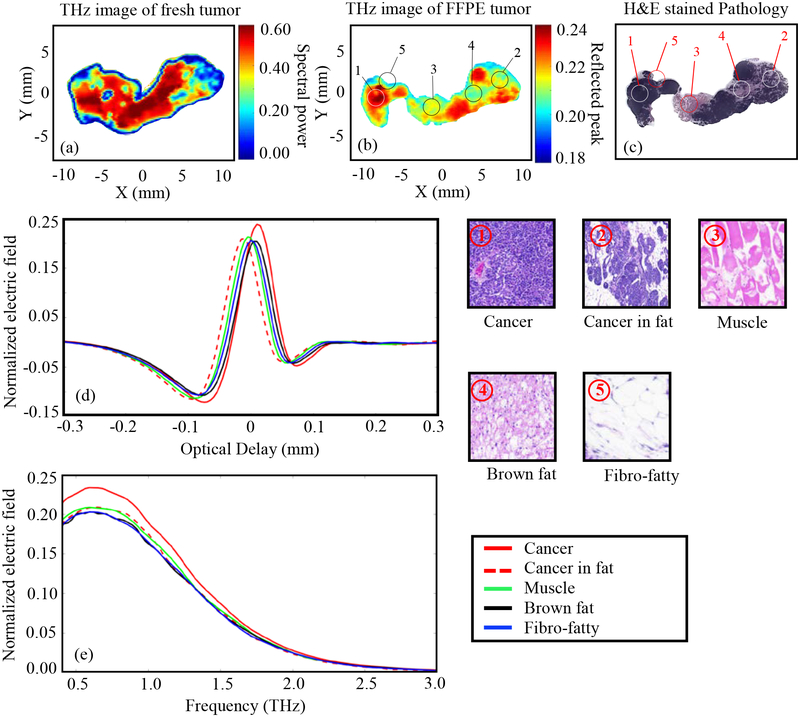
The results of Fig. 5 represent THz imaging of Tumor 3 (15-D). Tumor 3 is consistent with the previous samples in proving the capability of THz imaging in differentiating tissue types. The red color in the THz images in Fig. 5a and 5b denotes the cancer region. The yellowish-blue region in both Fig. 5a and 5b indicates cancer infiltrated in fat ② The dark blue region in Fig. 5a signifies the presence of fat tissue which is totally infiltrated with cancer in the FFPE tissue (Fig. 5b) upon conducting the histopathology process on the fresh tissue. The high reflections observed diagonally along the center of the image in Fig. 5a is most likely due to excess fluid beneath the tissue while it was freshly excised. The higher reflection from this fluid was spread over the areas that would normally be muscle ③ in Fig. 5b. There is also a possibility that the surface of the tissue has changed significantly from where the THz fresh image was taken (Fig. 5a) to where the pathology image was taken (Fig. 5c), resulting in different features in these images. From Figs. 5d and 5e, we can see that the signal for the fibro-fatty ⑤ and brown fat ④ regions show almost equal amplitudes, which can also be seen in the THz image in Fig. 5b. Likewise, the signal amplitudes of muscle ③ and the cancer in fat ② regions are similar, leading to displaying similar color intensities in THz image of Fig. 5b. However, despite their similarities to each other, all these regions show significant differentiation from the cancer region ①.
Fig. 5.
THz reflection images of transgenic mice breast tumor 3 (15-D), (a) Frequency domain THz image of freshly excised tumor represented by spectral power, (b) Time domain THz image of FFPE tumor tissue block represented by peak value, (c) Low power pathology image (d) Time domain signals of normalized reflected electric field at selected pixels ①-⑤, (e) Spectrum of normalized reflected electric field of the signals shown in (d). The high power pathology images of surrounding regions of ①-⑤ are shown. All THz signals are normalized with respect to a reference signal reflected from a gold mirror.
Tumor 4.
The results of Fig. 6 represent THz imaging of Tumor 4 (15-E). The results demonstrate a more advanced cancer stage which has undergone necrosis (designated based on the pathology report) that is seen in the form of several cracks (lumens) in the interior of the solid cancer region in the pathology image Fig. 6c. These cracks are displayed as cystic gaps ⑥. These cystic gaps show significant contrast (green color) in the THz image in Fig. 6b. At this stage, cancer starts producing glandular structures ③ filled with some secretions which can be seen as yellowish-red color in Fig. 6b. The regions of cancer with fibrous stroma ② and dense fibrous ④ regions in the tissue show almost similar signal amplitudes in Fig. 6d. This can primarily be due to the cell densities of the two regions. One unique feature compared to the previous samples is that the THz image in Fig. 6b shows the presence of skin ⑦ in the tumor tissue as reported in Fig. 6c. The skin could not be clearly seen in the THz image of fresh tissue in Fig. 6a but folded down during the histopathology process. The yellow-greenish and blue color regions in Fig. 6a are due to air bubbles that occurred during settling the tissue on the polystyrene plate. The fresh tissue image shows a high reflection over the entire tissue which is primarily due to the fact that most of the tumor is cancerous. This could also be due to fluid pooled beneath the tissue due to secretions from the necrotic cancer during the pressure made on the tissue when positioned between two polystyrene plates.
Fig. 6.
THz reflection images of transgenic mice breast tumor 4 (15-E), (a) Frequency domain THz image of freshly excised tumor represented by spectral power, (b) Time domain THz image of FFPE tissue block represented by peak value, (c) Low power pathology image (d) Time domain signals of normalized reflected electric field at selected pixels ①-⑦, (e) Spectrum of normalized reflected electric field of the signals shown in (d). The high power pathology images of surrounding regions of ①-⑦ are shown. All THz signals are normalized with respect to a reference signal reflected from a gold mirror.
Tumor 5.
The results of Tumor 5 (15-B) are presented in Fig. 7. Like previous results, the red color in the THz images represents the highest reflected amplitude which belongs to the cancer tissue ①. The regions of high reflections in the Fig. 7a is primarily due to blood and PBS on the surface of tissue that was not properly absorbed using filter paper. In some cases, the excised tumors continue to release fluids even after drying, causing the reflection to be stronger than other noncancerous regions in the tumor. This is a remaining challenge in imaging freshly excised tumors. The THz image of the fresh tissue shows clear differentiation between cancer and fat (② as seen in pathology image) where fat is the blue color in the lower right part of Fig. 7a. This differentiation was often observed in tumor xenografts grown in mice [18]. The dark blue spots throughout the center of Fig. 7a are due to the air bubbles that could be observed when zooming in on the photograph in Table 1. The yellow-blush region in the lower left corner of Fig. 7a is a large area of skin ⑤. The yellow color slightly above the center of the tissue is most likely some surface roughness and separation of the tissue from the polystyrene, but may also be some loose fatty tissue that was removed in the histopathology process. The highest reflection (dark red color) in Fig. 7b is primarily because of the higher density of cancer cells in that region ①. Almost all the regions indicated in Fig. 7c shows clear intensity differentiation in Fig. 7b, except the fibro ④ and the skin ⑤ that show similar cyan color. This similarity can also be seen in the signal amplitudes in Fig. 7d and 7e (solid black and dashed blue lines). It should be noted that the skin present in Fig. 7c and 7b cannot be seen in fresh tissue imaging in Fig. 7a as it was on the upper surface and was folded over with the imaging surface during the histopathology process. Additionally, the cystic areas represented by the light lumens (cracks) within the dark purple region seen in Fig. 7c are primarily revealed during slicing the FFPE block in the histology process. This is attributed in the pathology report to the aggressiveness of the cancer in this sample.
Fig. 7.
THz reflection images of transgenic mice breast tumor 5 (15-B), (a) Frequency domain THz image of freshly excised tumor represented by spectral power, (b) Time domain THz image of FFPE tissue block represented by peak value, (c) Low power pathology image (d) Time domain signals of normalized reflected electric field at selected pixels ①-⑥, (e) Spectrum of normalized reflected electric field of the signals shown in (d). The high power pathology images of surrounding regions of ①-⑥ are shown. All THz signals are normalized with respect to a reference signal reflected from a gold mirror.
Tumor 6.
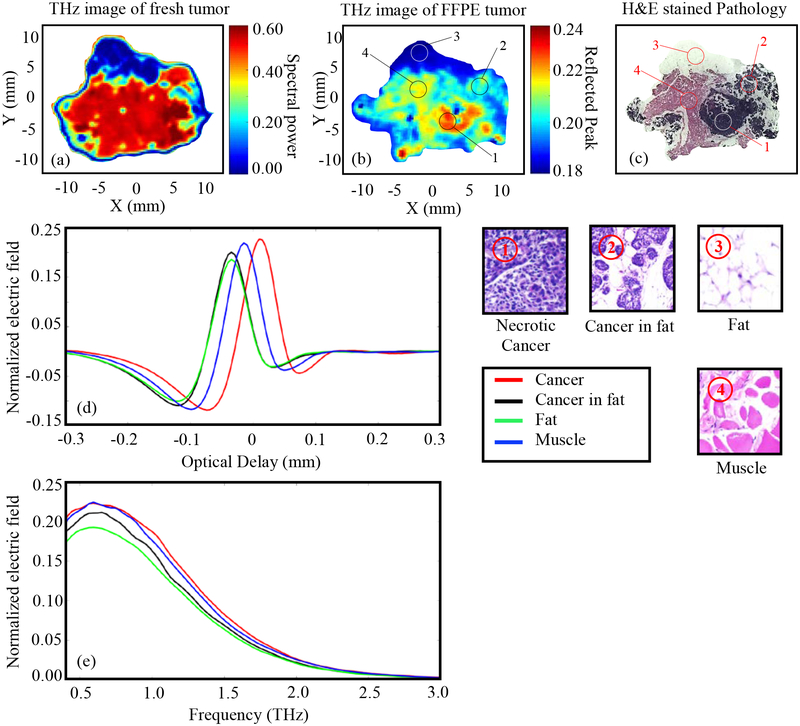
The results in Fig. 8 represents THz imaging of Tumor 6 (14-C). The THz image of fresh tissue in Fig. 8a is dominated with the high intensity reflection of cancerous and muscle tissues which is also clear in Fig. 8c. The dark blue region at the top of Fig. 8a is the mostly fat ③ as can be seen in the THz image of FFPE in Fig. 8b and the pathology in Fig. 8c. The high reflection (red color) on the left side of the tissue in Fig. 8a is most likely excess fluid that was not fully removed by the filter paper and seeped from the muscle tissue during imaging. Additional blood or protein secretions from within the necrotic cancer region might also have emerged when the tissue was pressed between the two polystyrene plates. Furthermore, the regions of cancer infiltrated in fat ② in Fig. 8c result in the dark and light blue color areas on the right side in Fig. 8a demonstrating the significant contrast provided by THz imaging even in the mingled cancer and fat regions of freshly excised tumor. Similar to all other FFPE tissues discussed above in this section, Fig. 8b is a reasonable representation of the pathology image in Fig. 8c where cancer ① can be seen with a red color, cancer infiltrated in fat ② with a yellowish-blue color, fat ③ as a dark blue region, and muscle ④ as a yellow region.
Fig. 8.
THz reflection images of transgenic mice breast tumor 6 (14-C), (a) Frequency domain THz image of freshly excised tumor represented by spectral power, (b) Time domain THz image of FFPE tissue block represented by peak value, (c) Low power pathology image (d) Time domain signals of normalized reflected electric field at selected pixels ①-④, (e) Spectrum of normalized reflected electric field of the signals shown in (d). The high power pathology images of surrounding regions of ①-④ are shown. All THz signals are normalized with respect to a reference signal reflected from a gold mirror.
Tumor 7.
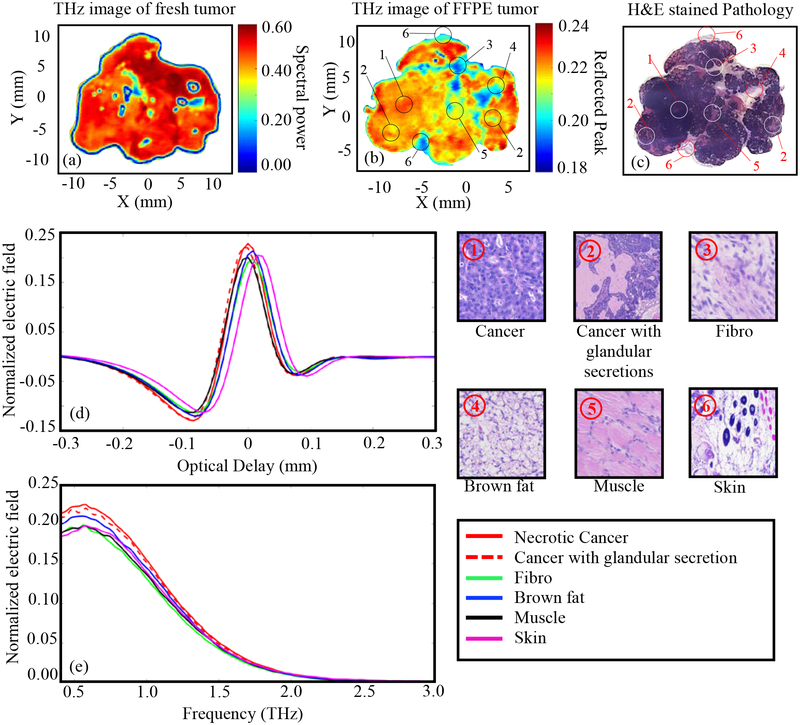
The results of Tumor 7 (12-A) are shown in Fig. 9. The THz image of the freshly excised tumor in Fig. 9a shows little contrast between different tissue types. As can be seen from Fig. 9c, the tumor is mostly cancerous with a little bit of fibrous, fat and muscle tissue within the cancerous regions. The fat region ④ is partially shown in blue color in Fig. 9a with clear differentiation from the cancer region ① (red color). Many of the dark blue spots in Fig. 9a could be due to air bubbles (which can be seen in the zoomed photograph in Table 1). The blue outline of the image is due to the edge effect as discussed earlier. The higher reflection region in Fig. 9a is primarily due to excessive fluid or blood beneath the tissue surface because of the pressure when the tissue was positioned between two polystyrene plates. The light yellow regions mixed in red color regions in the lower left side of the image in Fig. 9a are the less dense cancer regions. Here cancer cells are forming glandular structures ② filled with some protein secretions. The THz image of the FFPE tissue in Fig. 9b shows good agreement with the pathology image in Fig.9c as demonstrated in the other tumors. The regions of cancer ① are shown in red, the cancer with glandular secretion ② is shown in yellowish-red, the muscle ⑤ is shown in yellow, the fibro ③ is shown in dark blue, the brown fat ④ is shown in yellowish-blue, and the skin ⑥ is shown in cyan. It should be noted that the skin is not present in the fresh tissue image in Fig. 9a because it was on the upper surface and was folded over during the histopathology process. The time domain and frequency domain signals in Fig. 9d and 9e are in good correlation with the THz image in Fig. 9b, showing the high reflection comes from the cancer regions and the lower reflection comes from the fibro region.
Fig. 9.
THz reflection images of transgenic mice breast tumor 7(12-A), (a) Frequency domain THz image of freshly excised tumor represented by spectral power, (b) Time domain THz image of FFPE tissue block represented by peak value, (c) Low power pathology image (d) Time domain signals of normalized reflected electric field at selected pixels ①-⑥, (e) Spectrum of normalized reflected electric field of the signals shown in (d). The high power pathology images of surrounding regions of ①-⑥ are shown. All THz signals are normalized with respect to a reference signal reflected from a gold mirror.
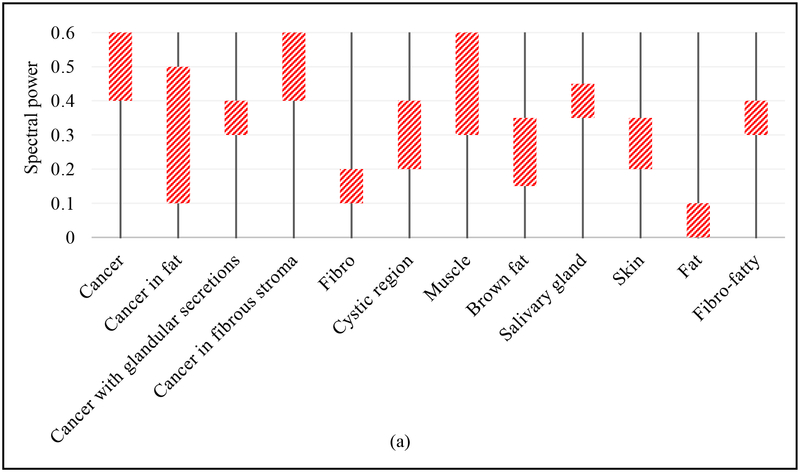
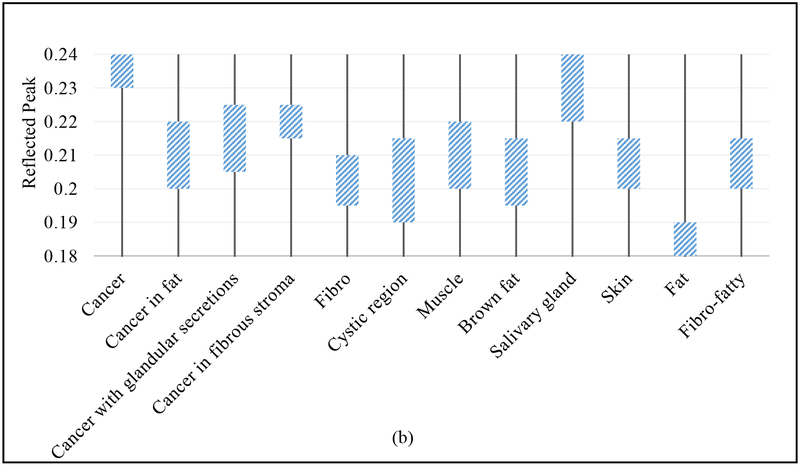
The above discussion is summarized in Fig. 10, where the estimated limits of the THz spectral power and reflected peak obtained from the THz images in Figs. 3–9 is presented in Fig. 10a and 10b, respectively.
Fig. 10.
Summary Charts for (a) Fresh tumors, and (b) FFPE tissue block.
IV. Conclusions
In this work we presented THz images of fresh and FFPE tissue block tumors excised from transgenic mice. The images were obtained using the reflection mode of the THz imaging system where no contrast agent or staining ink was used. The MMTV-PyMT breast cancer transgenic model was used in this work. The transgenic mice spontaneously produced multiple tumors without the need to inject carcinogens, with the tumors exhibiting complex structures with multiple tissue types like fat, cancer, fibro, muscle, cancer with glandular secretions, fat infiltrated with cancer, and others. A total of fifteen tumors were excised from four transgenic mice and were imaged using pathology and THz techniques, seven of which were presented here. Both fresh and FFPE tissue block were scanned on the THz imager and their images were compared with the low power pathology images. At the same time, high power pathology images were produced to demonstrate the complexities of the transgenic mice tumors and to designate different regions in the THz images. Almost all tumors presented in this work demonstrated advanced stages where cancer infiltrated other tissues like fat and fibrous stroma, and in some cases cancer became necrotic. In spite of the aggressiveness of the cancer in these tumors, their maximum size did not exceed 2.5 cm. Furthermore, we observed that the transgenic mice tumors did not contain significant fibroblast tissues surrounding the cancer that we clearly saw in our research on human breast tumors [28]. Therefore, while THz imaging is shown here to be effective in distinguishing between the complex tissue regions, the transgenic tumors were not suitable for us to investigate the margins of these tumors as a direct parallel to human breast cancer.
The results of this work demonstrated a partial success in differentiation between the cancer and the diverse tissue regions within the tumor. The summary in the Figs. 10a and b demonstrated the range of the signal amplitude for each tissue type. For example, in fresh tissue the signal of aggressive cancer ranges from 0.4 to 0.6, cancer in fat ranges from 0.1 to 0.5, etc., while in FFPE tissue, it was 0.23 to 0.24, 0.2 to 0.22, etc. The pathology reports indicated each tissue type and were used to qualitatively validate the THz images. The results of Fig. 10 demonstrated that THz imaging of FFPE tissue blocks clearly differentiates between aggressive cancer (i.e. complete invasion of tissue) and other tissue types. However, when cancer partially invaded fat and fibro regions and/or when cancer has glandular secretions, the differentiation was not seen. In the meantime, only 50% of the fifteen fresh tumors investigated here showed reasonable correlation between THz images with pathology. This observation is consistent with our preliminary work on human breast tumors [28]. The results show that THz imaging demonstrates contrast between cancer and healthy tissue even without the strong interaction of water (FFPE tissue), though water’s effect must be considered for surgical procedures. It has been observed that some of the tumors release more fluid than others during the fresh tissue imaging procedure despite the effort to dry it using filter paper before positioning on the scanner. The main challenges in differentiating between different tissue types in fresh tumors imaging are (i) the possible presence of fluid (water, necrotic secretions, blood, etc.) beneath the tissue surface, (ii) the degradation of fibrous and fatty tissues once the cancer invades the surrounding regions, especially in the transgenic mice tumors in this work, and (iii) the histopathology process sometimes alters the tumor tissue shape, size, and imaging surface making the correlation with pathology more challenging compared with THz images of FFPE tissue block. Overcoming these challenges (i)-(iii) is an ongoing research objective for advancing THz imaging of fresh tumors for its use in in-vivo clinical diagnosis. Additional future work is to conduct biochemistry analysis of cancer and fibro tissues in order to understand the difference in the THz response from these tissue types.
Acknowledgments
This work was funded by the National Institutes of Health Award No. R15CA208798. It was also funded in part by the National Science Foundation (NSF) Award No. 1408007. Funding for the pulsed THz system was obtained through NSF/MRI Award No. 1228958.
Appendix A
We conducted spectroscopy experiments of Dulbecco’s Modified Eagle Medium (DMEM) and Phosphate-Buffered Saline (PBS) solutions. A 100 μm thick quantity of the solution is placed in the liquid sample holder of the system. The extracted refractive index and absorption coefficients compared with distilled water are shown in Fig. A1. The results show that these solutions have THz signature similar to water.
Fig. A1.
Refractive index and absorption coefficient of DMEM, PBS, and water vs frequency.
References
- 1.Siegel RL, Miller KD, and Jemal A, “Cancer statistics, 2018,” CA. Cancer J. Clin 68(1), 7–30 (2018). [DOI] [PubMed] [Google Scholar]
- 2.American Cancer Society, “Cancer Facts & Figures 2016,” Cancer Facts Fig. 2016 1–9 (2016). [Google Scholar]
- 3.Grootendorst MR, Cariati M, Pinder SE, Kothari A, Douek M, Kovacs T, Hamed H, Pawa A, Nimmo F, Owen J, Ramalingam V, Sethi S, Mistry S, Vyas K, Tuch DS, Britten A, Van Hemelrijck M,Cook GJ, Sibley-Allen C, Allen S, and Purushotham A, “Intraoperative Assessment of Tumor Resection Margins in Breast-Conserving Surgery Using 18 F-FDG Cerenkov Luminescence Imaging: A First-in-Human Feasibility Study,” J. Nucl. Med 58(6), 891–898 (2017). [DOI] [PubMed] [Google Scholar]
- 4.Blair KJ and Legenza M, “Re-Excision Rates Following Breast Conserving Therapy : A Single Institutions Experience Over Ten Years,” Marshall J. Med 3(3), (2017). [Google Scholar]
- 5.Hu BB and Nuss MC, “Imaging with terahertz waves,” Opt. Lett 20(16), 1716 (1995). [DOI] [PubMed] [Google Scholar]
- 6.Ashworth PC, Pickwell-macpherson E, Provenzano E, Pinder SE, Purushotham AD, Pepper M, and Wallace VP, “Terahertz pulsed spectroscopy of freshly excised human breast cancer,” 17(15), 93–94 (2009). [DOI] [PubMed] [Google Scholar]
- 7.Löffler T, Bauer T, Siebert K, Roskos H, Fitzgerald A, and Czasch S, “Terahertz dark-field imaging of biomedical tissue,” Opt. Express 9(12), 616–621 (2001). [DOI] [PubMed] [Google Scholar]
- 8.Fitzgerald AJ, Wallace VP, Jimenez-Linan M, Bobrow L, Pye RJ, Purushotham AD, and Arnone DD, “Terahertz Pulsed Imaging of Human Breast Tumors,” Radiology 239(2), 533–540 (2006). [DOI] [PubMed] [Google Scholar]
- 9.Knobloch P, Schmalstieg K, Koch M, Rehberg E, Vauti F, Donhuijsen K, Hochfrequenztechnik I, Braunschweig TU, Braunschweig D, Witten HDU, and Katholischen D, “THz imaging of histo-pathological samples Frequency (Hz),” Proc. SPIE - Int. Soc. Optival Eng 4434, Hybrid Nov. Imaging New Opt. Instrum. Biomed. Appl. 239 (October 24, 2001); doi 10.1117/12.446686 4434, 239–245 (2001). [DOI] [Google Scholar]
- 10.Bowman T, El-Shenawee M, and Campbell LK, “Terahertz transmission vs reflection imaging and model-based characterization for excised breast carcinomas,” Biomed. Opt. Express 7, 3756–3783 (2016). [DOI] [PMC free article] [PubMed] [Google Scholar]
- 11.Bowman TC, El-Shenawee M, and Campbell LK, “Terahertz imaging of excised breast tumor tissue on paraffin sections,” IEEE Trans. Antennas Propag 63, 2088–2097 (2015). [Google Scholar]
- 12.Bowman T, Wu Y, Gauch J, Campbell LK, and El-Shenawee M., “Terahertz imaging of threedimensional dehydrated breast cancer tumors,” J. Infrared Millimeter Terahertz Waves 38, 766–786 (2017). [Google Scholar]
- 13.Png GM, Choi JW, W-HNg B, Mickan SP, Abbott D and Zhang X-C, “The impact of hydration changes in fresh bio-tissue on THz spectroscopic measurements,” Phys. Med. Biol 53, 3501–3517, (2008). [DOI] [PubMed] [Google Scholar]
- 14.Yu C, Fan S, Sun Y, Pickwell-MacPherson E. “The potential of terahertz imaging for cancer diagnosis: A review of investigations to date”, Quant Imaging Med Surg; 2:33–45, (2012). [DOI] [PMC free article] [PubMed] [Google Scholar]
- 15.Jakubowski DB, Cerussi AE, Beilacqua F, et al. Monitoring neoadjuvant chemotherapy in breast cancer using quantitative diffuse optical spectroscopy: a case study. J Biomed Opt;9(1):230–238 (2004). [DOI] [PubMed] [Google Scholar]
- 16.Chen JY; Knab JR, Markelz AG et al. Terahertz dielectric response sensitivity to protein oxidation state. Lasers and Electro-Optics Society, 2007. LEOS 2007. The 20th Annual Meeting o f the IEEE, (2007). [Google Scholar]
- 17.Chen H, Chen T-H, Tseng T-F, Lu J-T, Kuo C-C, Fu S-C, Lee W-J, Tsai Y-F, Huang Y-Y, Chuang EY, Hwang Y-J, and Sun C-K, “High-sensitivity in vivo THz transmission imaging of early human breast cancer in a subcutaneous xenograft mouse model,” Opt. Express 19(22), 21552 (2011). [DOI] [PubMed] [Google Scholar]
- 18.Bowman T, Chavez T, Khan K, Wu J, Chakraborty A, Rajaram N, Bailey K, and El-Shenawee M, “Pulsed terahertz imaging of breast cancer in freshly excised murine tumors,” J. Biomed. Opt, vol. 23, no. 2, (2018). [DOI] [PMC free article] [PubMed] [Google Scholar]
- 19.Oh SJ, Kim S-H, Bin Ji Y, Jeong K, Park Y, Yang J, Park DW, Noh SK, Kang S-G, Huh Y-M, Son J-H, and Suh J-S, “Study of freshly excised brain tissues using terahertz imaging,” Biomed. Opt. Express 5(8), 2837 (2014). [DOI] [PMC free article] [PubMed] [Google Scholar]
- 20.Yamaguchi S, Fukushi Y, Kubota O, Itsuji T, Ouchi T, and Yamamoto S, “Brain tumor imaging of rat fresh tissue using terahertz spectroscopy,” Sci. Rep, vol. 6, no. 30124, pp. 1–6, (2016). [DOI] [PMC free article] [PubMed] [Google Scholar]
- 21.Richmond A and Su Y, “Mouse xenograft models vs GEM models for human cancer therapeutics,” Dis. Model. Mech 1(2–3), 78–82 (2008). [DOI] [PMC free article] [PubMed] [Google Scholar]
- 22.Guy CT, Cardiff RD, and Muller WJ, “Induction of mammary tumors by expression of polyomavirus middle T oncogene: a transgenic mouse model for metastatic disease.,” Mol. Cell. Biol 12(3), 954–961 (1992). [DOI] [PMC free article] [PubMed] [Google Scholar]
- 23.Plodinec M, Loparic M, Monnier CA, Obermann EC, Zanetti-Dallenbach R, Oertle P, Hyotyla JT, Aebi U, Bentires-Alj M, Lim RYH, and Schoenenberger CA, “The nanomechanical signature of breast cancer,” Nat. Nanotechnol (2012). [DOI] [PubMed] [Google Scholar]
- 24.Lin EY, Jones JG, Li P, Zhu L, Whitney KD, Muller WJ, and Pollard JW, “Progression to Malignancy in the Polyoma Middle T Oncoprotein Mouse Breast Cancer Model Provides a Reliable Model for Human Diseases,” Am. J. Pathol 163(5), 2113–2126 (2003). [DOI] [PMC free article] [PubMed] [Google Scholar]
- 25.Almholt K, Green KA, Juncker-Jensen A, Nielsen BS, Lund LR, and Rømer J, “Extracellular proteolysis in transgenic mouse models of breast cancer,” J. Mammary Gland Biol. Neoplasia 12(1), 83–97 (2007). [DOI] [PMC free article] [PubMed] [Google Scholar]
- 26.Maglione JE, Moghanaki D, Young LJT, Manner CK, Ellies LG, Joseph SO, Nicholson B, Cardiff RD, and MacLeod CL, “Transgenic Polyoma middle-T mice model premalignant mammary disease,” Cancer Res. 61(22), 8298–8305 (2001). [PubMed] [Google Scholar]
- 27.Reid CB, Fitzgerald A, Reese G, Goldin R, Tekkis P, O’Kelly PS, Pickwell-MacPherson E, Gibson AP, and Wallace VP, “Terahertz pulsed imaging of freshly excised human colonic tissues,” Phys. Med. Biol, vol. 56, no. 1, pp. 4333–4353, (2011). [DOI] [PubMed] [Google Scholar]
- 28.El-Shenawee M, Bowman T, Esparza T, Khan K, Wu J, Chakraborty A, and Bailey K, “Statistical Signal Processing For Quantitative Assessment Of Pulsed Terahertz Imaging Of Human Breast Tumors,” Proc. o f the 42ndInternational Conference on Infrared, Millimeter and Terahertz Waves, Cancun, Mexico, 27 August (2017). [Google Scholar]


