

Abstract
Adaptive behavior relies on combining bottom-up sensory inputs with top-down control signals to guide responses in line with current goals and task demands. Over the past decade, accumulating evidence has suggested that the dorsal and ventral frontoparietal attentional systems are recruited interactively in this process. This fMRI study used concurrent transcranial magnetic stimulation (TMS) as a causal perturbation approach to investigate the interactions between dorsal and ventral attentional systems and sensory processing areas. In a sustained spatial attention paradigm, human participants detected weak visual targets that were presented in the lower-left visual field on 50% of the trials. Further, we manipulated the presence/absence of task-irrelevant auditory signals. Critically, on each trial we applied 10 Hz bursts of four TMS (or Sham) pulses to the intraparietal sulcus (IPS). IPS-TMS relative to Sham-TMS increased activation in the parietal cortex regardless of sensory stimulation, confirming the neural effectiveness of TMS stimulation. Visual targets increased activations in the anterior insula, a component of the ventral attentional system responsible for salience detection. Conversely, they decreased activations in the ventral visual areas. Importantly, IPS-TMS abolished target-evoked activation increases in the right temporoparietal junction (TPJ) of the ventral attentional system, whereas it eliminated target-evoked activation decreases in the right fusiform. Our results demonstrate that IPS-TMS exerts profound directional causal influences not only on visual areas but also on the TPJ as a critical component of the ventral attentional system. They reveal a complex interplay between dorsal and ventral attentional systems during target detection under sustained spatial attention.
SIGNIFICANCE STATEMENT Adaptive behavior relies on combining bottom-up sensory inputs with top-down attentional control. Although the dorsal and ventral frontoparietal systems are key players in attentional control, their distinct contributions remain unclear. In this TMS-fMRI study, participants attended to the left visual field to detect weak visual targets presented on half of the trials. We applied brief TMS bursts (or Sham-TMS) to the dorsal intraparietal sulcus (IPS) 100 ms after visual stimulus onset. IPS-TMS abolished the visual induced response suppression in the ventral occipitotemporal cortex and the response enhancement to visual targets in the temporoparietal junction. Our results demonstrate that IPS causally influences neural activity in the ventral attentional system 100 ms poststimulus. They have important implications for our understanding of the neural mechanisms underlying attentional control.
Keywords: detection, interleaved/concurrent TMS-fMRI, multisensory, neglect, right parietal cortex, spatial attention
Introduction
In our natural multisensory environment, the brain needs to detect and respond rapidly to task-relevant sensory events that may occur concurrently with additional task-irrelevant signals. Adaptive behavior requires rapid integration of these bottom-up sensory inputs with top-down control signals to guide responses in line with current goals and task-demands. Over the past decade, accumulating evidence has suggested that the dorsal and ventral frontoparietal attentional systems play distinct roles in this process (Corbetta and Shulman, 2002; Corbetta et al., 2008).
The dorsal system, including the intraparietal sulcus and frontal eye fields, is thought to send top-down biases to sensory areas (Corbetta et al., 2000; Hopfinger et al., 2000; Serences et al., 2004; Kincade et al., 2005; Ruff et al., 2006, 2008). For instance, top-down spatial attention has been shown to enhance sensory processing for prioritized spatial locations (Kastner et al., 1999). Further, it imposes “filtering settings” onto the ventral system for discriminating between relevant and irrelevant stimuli (Corbetta et al., 2008). Conversely, the ventral system encompassing the temporoparietal junction (TPJ) and anterior insula has been implicated in detecting task-relevant events, in particular, but not solely, when they are unexpected (Linden et al., 1999; Corbetta et al., 2000; Indovina and Macaluso, 2007; Geng and Mangun, 2011; Diquattro et al., 2014). Successful target detection is then thought to update the expectations and biases of the dorsal attentional system (Geng and Vossel, 2013).
Dorsal and ventral systems can be segregated based on their resting-state functional connectivity (Fox et al., 2006; He et al., 2007) and distinct response profiles in attentional cuing paradigms. Yet, in many real-life situations, adaptive behavior will inevitably recruit both systems interactively. Most notably, target detection has been shown to evoke activations in both dorsal and ventral attentional systems (Corbetta et al., 2000; Hampshire et al., 2007). Moreover, neglect-like symptoms, such as impaired target detection in the left hemifield, are most commonly observed in stroke patients with lesions to the right ventral frontoparietal system (Corbetta et al., 2005; Verdon et al., 2010), but can also occur when lesions are restricted to dorsal parietal regions (Gillebert et al., 2011) or be evoked by transcranial magnetic stimulation (TMS) to the dorsal right parietal cortex in healthy volunteers (Hilgetag et al., 2001). Furthermore, in support of close interactions between the two systems, TPJ lesions in stroke patients with neglect have been shown to evoke profound activation changes in the dorsal attentional system, which in turn correlated with neglect severity (He et al., 2007).
This fMRI study used concurrent TMS as a causal perturbation approach to investigate the causal and directional interactions between dorsal and ventral attentional systems and sensory processing areas. In a sustained spatial attention paradigm, participants had to detect weak visual targets that were presented in a placeholder in their lower-left visual field on 50% of the trials. Across runs, we manipulated the sensory context, i.e., the presence or absence of a task-irrelevant auditory signal. Critically, on each trial we applied 10 Hz bursts of four TMS (or Sham) pulses to the right dorsal parietal cortex. This allowed us to investigate the causal influence of dorsal parietal cortex on remote areas of the dorsoventral attentional and visual systems during task performance.
Materials and Methods
Participants
Ten right-handed participants (4 male; mean age: 31.5 years; SD: 8.1; Edinburgh Handedness inventory score (mean ± SD of 78 ± 16.8) participated in the experiment. Participants had no history of neurological illness, had normal or corrected-to-normal vision, and reported normal hearing. All participants gave informed consent before participation and the study was approved by the Human Research Ethics Committee of the Medical Faculty at the University of Tübingen.
Experimental design and task
In a sustained spatial attention paradigm, participants had to detect visual targets that were presented in a placeholder in the left lower quadrant on 50% of the trials. Across sessions, we manipulated whether TMS or Sham-TMS was applied to parietal cortex. Moreover, we also manipulated the presence versus absence of concurrent task-irrelevant auditory inputs across runs. In short, the paradigm conformed to a 2 × 2 × 2 factorial design with the factors: (1) task-relevant visual input (V present, V absent), (2) TMS condition [right anterior intraparietal sulcus (IPS), Sham], and (3) auditory context (A present, A absent; Fig. 1A). Hence, our design included the following four trial types: (1) visual target present, without sound (V), (2) visual target absent, without sound (¬V), (3) visual target present with sound (AV), and (4) visual target absent with sound (A). Each trial type was presented with IPS- and Sham-TMS resulting in eight conditions in total. We limited the presentation of the visual target to the left hemifield because right parietal TMS has previously been shown to elicit different effects for contralateral and ipsilateral visual stimuli (Hilgetag et al., 2001). In all trial types, participants reported whether they had detected the visual target (see Visual and auditory stimuli) via a two choice key press. They were instructed to use a strict decision criterion and report that they had detected a target only when being confident and to report “unseen” otherwise. Participants fixated on a cross presented in the center of the screen throughout the entire scanning session.
Figure 1.

Experimental design. A, 2 × 2 × 2 factorial design manipulating (1) task-relevant visual input (V present, V absent), (2) auditory context (A present, A absent), and (3) TMS condition (right anterior IPS, Sham). B, Timeline example of stimuli presentation. Blocks of 12 trials started and ended with a gray fixation cross and were interleaved with baseline periods, during which the fixation cross turned red. A trial began when the fixation cross turned blue. In target present trials, the visual stimulus was presented 100 ms after trial begin. After a total period of 600 ms the fixation cross turned back to gray and remained like this until the next trial. C, Illustration of the concurrent TMS-fMRI protocol and stimuli presentation timing during auditory present runs. Within a block the fixation cross was gray during volume acquisition and blue during the acquisition gaps. At 100 ms after trial begin (i.e., 2790 ms after begin of volume acquisition), the task-relevant visual stimulus was either present (first depicted trial) or absent (second depicted trial). Bursts of four TMS pulses were applied during acquisiton gaps at 10 Hz and started 100 ms after the target onset time (i.e., 2890 ms after begin of volume acquisition).
At the beginning of each trial, the fixation cross changed color from gray to blue (Fig. 1B). After 100 ms, the visual target was presented for a duration of 16 ms with 50% probability. On each trial, we applied bursts of four TMS pulses (or Sham-TMS) 200 ms after trial onset (i.e., 100 ms after target onset in V and AV trials; see Data acquisition and TMS procedures; Fig. 1C). At 600 ms of trial onset, the fixation cross turned back to gray for a duration of 2690 ms until a change in the color of the fixation cross indicated the onset of the next trial. The interstimulus interval amounted thus to 3290 ms, equaling one TR of the EPI acquisition.
In one-half of the runs, a sound (see Visual and auditory stimuli) was presented synchronously with target onset, regardless of the presence/absence of the task-relevant visual input. Hence, the sound did not predict the presence of the visual stimulus. Nevertheless, the presence of the sounds may have reduced participants' uncertainty about the temporal onset of the visual target.
Blocks of 12 trials were interleaved with fixation baseline periods of 13 s. The fixation periods were indicated by a red fixation cross. The beginning and end of the activation blocks were indicated by a gray fixation cross and the detection trials by a blue fixation cross. Hence, the color of the fixation cross indicated changes in the attentional settings: whereas blue and gray were associated with a high attentional load, red indicated little attentional demands.
Each run encompassed seven activation blocks (i.e., 84 trials per run). The data of the main experiment were acquired in two sessions on different days with each session including eight runs. Across days/sessions, we manipulated whether IPS-TMS or Sham-TMS was applied. On each day, we manipulated the auditory context across runs within an ABBA design counterbalanced across participants (i.e., 4 “auditory context present” and 4 “auditory context absent” runs per day). The visual target presence was randomized within and across runs. Hence, we obtained a total of 168 trials for each condition (e.g., 42 target-present trials per run × 4 runs with auditory context present × 1 session parietal TMS). Each participant was trained in a minimum of six runs before the actual fMRI experiment.
Visual and auditory stimuli
Visual stimuli.
The task-relevant visual stimulus consisted of a small (9 × 9 pixels, visual angle: 0.52°) square presented for one frame (i.e., 16 ms) on a gray background. The visual stimulus was presented in the center of a blue placeholder (40 × 40 pixels, visual angle: 2.3°) that was positioned 12° left and 5° down relative to the fixation cross. The placeholder was displayed throughout the entire run (i.e., including fixation periods).
The “overall gray level of the target square” was adjusted with the help of dithering for each participant in a Quest procedure (Watson and Pelli, 1983) inside the scanner aiming at a detection threshold of 70% and using the same parameters as in the main experiment. In other words, the “overall gray level” was adjusted by manipulating the density of white pixels within the square. This detection threshold was selected to place increased demands on cognitive resources, such as spatial attention. Importantly, identical gray levels were used across IPS and Sham stimulation and across auditory contexts.
Auditory stimuli.
To ensure that auditory stimuli were easily segregated from the scanner noise and TMS clicks we generated an auditory stimulus by adding sinusoidal tones with base frequencies of 130.81, 164.81, and 196 Hz and the following six terms of their respective geometric progressions (i.e., adding the terms 2n · f, where f represents each of the three base frequencies and 1 ≤ n ≤ 6). Hence, the auditory sound spanned a total of 7 octaves and ranged from 130.81 to 12,543.58 Hz. The duration of each auditory stimulus was 40 ms.
Next, we convolved this auditory signal with spatially specific head-related transfer functions (HRTFs) to create a left localized stimulus. This will provide participants with audiovisual spatial localization cues and thereby enhance audiovisual integration. The HRTFs were pseudo-individualized by matching participants' head width, height, depth and circumference to the anthropometry of participants in the CIPIC database (Algazi et al., 2001).
Stimulus presentation
Visual and auditory stimuli were presented using Psychophysics Toolbox version 3.0.10 (Brainard, 1997; Kleiner et al., 2007) running on MATLAB 7.9 (MathWorks) and a Macintosh laptop running OS-X 10.6.8 (Apple). The visual stimulus was back-projected onto a frosted Plexiglas screen using a LCD projector (JVC; resolution: 800 × 600 pixels, refresh rate: 60 Hz, viewing distance: 48 cm) visible to the participant through a mirror mounted on the MR-head coil. Auditory stimuli were presented via MR-compatible electrodynamic headphones at a sampling frequency of 44,100 Hz (MR Confon GmbH). Furthermore, earplugs were used to attenuate both scanner and TMS noise.
Participants indicated their response (i.e., visual target seen or unseen) with their right hand using a MR-compatible custom-built button device connected to the stimulus computer.
TMS sites
TMS was applied over the right anterior IPS as the experimental site and Sham-TMS was included as a control condition.
The MNI coordinates (x = 42.3, y = −50.3, z = 64.4) reported by Oliver et al. (2009) as a position over which TMS disrupted visuospatial processing were adopted for the parietal stimulation site. Individual stimulation coordinates were determined by inverse transforming the MNI coordinates from Oliver et al. (2009) into native space using the parameters obtained from spatial normalization. A posteriori coil reconstruction of the coil position was based on custom-written MATLAB (MathWorks) scripts and a water tube attached to the coil, which was clearly visible on the MR images. Across participants, the target IPS coordinates were obtained with a mean deviance of 10 mm ± 6.2 (mean, SD). The mean reached coordinate in MNI space was (x = 34.1, y = −50.7, z = 64.3).
In the Sham condition, 2-cm-thick plastic plates were fixed between the TMS coil and the skull. Given the quadratic decay of the TMS-induced magnetic field, this Sham condition precluded the effects of direct brain stimulation. Indeed, when tested over the finger region of the motor cortex, this Sham condition did not induce muscular twitches on preactivated finger muscles even at 100% of total output intensity. During the Sham condition, the coil was placed over the right hemisphere as close as possible to the experimental stimulation condition, given the space constraints inside the MR coil. Critically, the Sham-TMS condition tightly controlled for the TMS side effects such as the TMS-noise and feelings of vibrations. Furthermore, comparing IPS-TMS with Sham-TMS did not elicit significant activations in the auditory cortex. Hence, we concluded that this particular application of Sham-TMS inside the scanner is a better control than low intensity TMS that does not control effectively for auditory confounds (see Data acquisition and TMS procedures; Leitão et al., 2013).
Data acquisition and TMS procedures
A 3T TIM Trio System (Siemens) was used to acquire both high-resolution structural images (176 sagittal slices, TR = 2300 ms, TE = 2.98 ms, TI = 1100 ms, flip angle = 9°, FOV = 240 mm × 256 mm, image matrix = 240 × 256, voxel size = 1 mm × 1 × 1 mm, using a 12-channel head coil) and T2*-weighted axial echoplanar images (EPI) with blood oxygenation level-dependent (BOLD) contrast (GE-EPI, TR = 3290 ms, TE = 35 ms, flip angle = 90°, FOV = 192 × 192 mm, image matrix 64 × 64, 40 axial slices acquired sequentially in ascending direction, slice thickness = 3 mm, interslice gap = 0.3 mm, voxel size = 3 × 3 × 3.3 mm, using a 1-channel Tx/Rx head coil). Each participant took part in a total of eight experimental runs per TMS condition. A total of 124 volume images were acquired for each run.
After each EPI run, a fast structural image [fast low-angle shot (FLASH), 100 axial slices, TR = 564 ms, TE = 2.46 ms, TI = 300 ms, FOV = 256 × 256 mm, image matrix = 256 × 256, voxel size = 1 × 1 × 3 mm] was acquired to enable a posteriori reconstruction of the TMS coil position inside the scanner, as described previously (Leitão et al., 2013).
The EPI sequence was adapted for concurrent TMS-fMRI experiments by introducing gaps of 600 ms after every volume acquisition. Each gap was introduced to allow the delivery of four TMS pulses without interference with image quality (Bestmann et al., 2003; Moisa et al., 2009). Bursts of four pulses at 10 Hz were applied every trial, with the first pulse applied 2890 ms after begin of volume acquisition, i.e., 100 ms after stimulus onset on target present trials (Fig. 1C). TMS pulses were applied after stimulus onset to minimize cross-modal interaction effects between our stimuli and the TMS-induced auditory and somatosensory side effects (Duecker and Sack, 2013; Leitão et al., 2013). Similar TMS protocols have been used both in TMS studies outside the scanner (Chambers et al., 2004; Oliver et al., 2009) and in concurrent TMS-fMRI studies investigating visuospatial processing (Ruff et al., 2006, 2008, 2009; Sack et al., 2007; Blankenburg et al., 2010; Heinen et al., 2011).
Biphasic stimuli were delivered using a MagPro X100 stimulator (MagVenture) and a MR-compatible figure of eight TMS coil (MRi-B88), using the same coil-holding device as described by Moisa et al. (2009).
During IPS stimulation, a fixed TMS intensity of 69% of total stimulator output was used for all participants. This corresponded to 125% of the mean resting motor threshold, as determined across 24 participants in prior studies using the same coil (M. Moisa, Laboratory for Social and Neural Systems Research, University of Zurich, Zurich, Switzerland, personal communication). To ensure similar somatosensory side effects between IPS- and Sham-TMS the TMS intensity was increased to 75% during the Sham condition based on the subjective report of two naive participants that participated in a pilot test.
Extensive image quality tests of our setup were reported previously (Moisa et al., 2009, 2010, their supplemental material). For completeness, we acquired EPI data with a phantom using the same experimental design. After realignment, data were entered in a first level analysis using the same model as for the real participants. Computing all the relevant contrasts (height threshold: p < 0.01 uncorrected) yielded only spurious and randomly distributed activation patterns.
Behavioral data analysis
The percentage of correct responses and reaction times were computed for each of the eight conditions in our factorial design. Both percentage correct and reaction times (median RT for each subject) were entered in separate 2 (task-relevant visual input: V present, V absent) × 2 (TMS: IPS, Sham) × 2 (auditory context: A present, A absent) repeated-measures ANOVA (RM-ANOVA).
fMRI data analysis
The fMRI data were analyzed using SPM8 (Wellcome Department of Imaging Neuroscience, London; www.fil.ion.ucl.ac.uk/spm; Friston et al., 1995). Scans from each subject were realigned using the first as a reference, unwarped, spatially normalized into MNI space, resampled to a spatial resolution of 2 × 2 × 2 mm3, and spatially smoothed with a Gaussian kernel of 8 mm full-width at half-maximum. The time series of all voxels were high-pass filtered to 1/128 Hz. The first three volumes were discarded to allow for T1-equilibration effects.
The fMRI experiment was modeled as a mixed block/event-related design. Individual trials were modeled as events and entered into a design matrix after convolution with a canonical hemodynamic function and its first temporal derivative. Each run modeled only visual present versus visual absent trials as two types of events, as the factors auditory context and TMS were manipulated across runs and sessions, respectively. In addition to modeling these two trial types, our statistical model modeled block begin and end (i.e., the periods during which the fixation was gray at the beginning and end of a block; see Experimental Design) as mini blocks of 2.69 s and 3.29 s duration, respectively. These additional regressors were included to explicitly account for the increased attentional demands at the beginning and end of the task blocks (note that models that did not include these additional regressors provided basically equivalent results for contrasts combining the remaining regressors). For computational reasons we concatenated the four runs for each of the 2 (IPS vs Sham-TMS) × 2 (auditory present vs absent) combinations and modeled the run-specific means as separate regressors. Nuisance covariates included the realignment parameters to account for residual motion artifacts.
For each participant, condition specific effects were estimated according to the general linear model by creating contrast images of each condition (i.e., limited to the canonical hemodynamic response) relative to the arbitrary baseline. The following statistical comparisons were entered in independent second-level one-sample t tests to allow for random effects analyses and inferences at the population level (Friston et al., 1999).
General experimental event and brief contextual block effects at the beginning and end of the task blocks.
We evaluated general trial (i.e., active experimental task events in the context of IPS-TMS or Sham-TMS) driven activations by comparing all events > baseline. Likewise, we evaluated general attentional effects by comparing block begin + block end > baseline pooled (i.e., summed) over TMS conditions.
Main effects of TMS.
We compared IPS versus Sham pooled (i.e., summed) over visual and auditory conditions.
Effects of task-relevant visual input and its interactions with TMS and auditory context.
First, we tested for main effects of task-relevant visual input by comparing visual target present (= AV + V) and visual target absent trials (= A + ¬V) pooled (i.e., summed) over auditory contexts and IPS and Sham stimulation (i.e., we performed the comparisons “target present > target absent” and “target absent > target present” pooled over the remaining factors).
Second, we assessed whether IPS-TMS relative to Sham-TMS exerted effects that depended on the presence of the task-relevant visual input. Specifically, we evaluated state-dependent TMS effects (Silvanto et al., 2008) by testing for the interactions between TMS and task-relevant visual input [i.e., (target present > target absent)IPS > (target present > target absent)Sham and (target absent > target present)IPS > (target absent > target present)Sham].
Third, we investigated whether any of the clusters that showed interaction effects between visual input and TMS (i.e., interaction effects between task-relevant bottom-up and top-down signals) were also modulated by auditory contexts. In other words, we tested in those ROIs also for a three-way interaction. For this, we extracted parameter estimates for each condition from each significant cluster and entered the cluster means into 2 (task-relevant visual input: V present, V absent) × 2 (TMS: IPS, Sham) × 2 (auditory context: A present, A absent) RM-ANOVAs. Clusters were identified using an uncorrected auxiliary height threshold of p = 0.01 and no extent threshold. Please note that constraining our inferences to these ROIs does not bias statistical inference, as the contrasts used for defining the regions of interest are orthogonal to those used for testing for the three-way interaction (Friston et al., 2006).
Effects of auditory context and its interaction with TMS.
Likewise, we first tested for main effects of auditory context by comparing auditory present (= AV + A) and auditory absent trials (= V + ¬V), pooled (i.e., summed) over IPS and Sham stimulation. In short, we performed the comparisons “auditory present > auditory absent” and “auditory absent > auditory present” pooled over TMS conditions.
Second, we investigated whether TMS modulates auditory processing by testing for the interaction between auditory context and TMS [(auditory present > auditory absent)IPS > (auditory present > auditory absent)Sham and (auditory absent > auditory present)IPS > (auditory absent > auditory present)Sham].
Search volume constraints.
Unless otherwise stated, effects were tested for within the entire brain. Based on our a priori hypothesis, the auditory effects were also tested for within the auditory cortices. The region of interest for the auditory cortex was defined using the SPM Anatomy Toolbox (Eickhoff et al., 2005). The anatomical mask encompassed 975 voxels in the bilateral cytoarchitectonic maps TE 1.0, TE 1.1, and TE 1.2.
Unless stated otherwise, we report activation at p < 0.05 at the cluster level using an auxiliary uncorrected voxel threshold of p = 0.01 (Hayasaka and Nichols, 2003) corrected for multiple comparisons (familywise error rate) based on Gaussian random-field theory within the entire brain.
Eye monitoring (outside the scanner)
To ensure that the observed activation pattern did not result from eye movements, twitches, or startle effects, eight additional participants took part in a supplementary TMS-psychophysics experiment outside the scanner performed with equivalent parameters. One experimental run was acquired per participant for each TMS condition. To account for the absence of the high-current filter used in the concurrent TMS-MRI setup (Moisa et al., 2009), the TMS intensity was reduced to 63% of total output.
Horizontal and vertical eye movements were recorded using an iView XTM RED-III remote eyetracker system (SensoMotoric Instruments; 50 Hz sampling rate). The eye-tracking system was calibrated using a 13 point calibration. Eye position data were automatically corrected for blinks and converted to radial velocity.
For each trial the mean distance (degrees) from the fixation cross, the number of saccades (defined by a radial eye velocity threshold >30°/s for a minimum of 60 ms duration and radial amplitude larger than 5°), and the proportion of blinks were quantified for the entire trial duration separately for each individual condition and for baseline periods.
Across all participants, saccades were almost completely absent, hence no further analyses were performed for this index. For the two remaining indices, we first evaluated whether they differed for activation trials and baseline periods. We therefore compared each index pooled (i.e., averaging) over all activation conditions with baseline periods in a paired t test. Second, to test for differences across individual task conditions, the two indices were independently entered into 2 (task-relevant visual input: V present, V absent) × 2 (TMS: IPS, Sham) × 2 (auditory context: A present, A absent) RM-ANOVAs.
Results
Behavioral data
In a sustained spatial attention paradigm, participants reported whether they had detected a visual target that was presented on 50% of the trials. For each participant, the behavioral indices were calculated for visual target present and visual target absent trials separately for each auditory context and TMS condition. Across participants' mean (±SD) of percentage correct responses and reaction time data are summarized for each condition in Table 1. Note that, during the Sham condition, the percentage correct responses for visual target present trial amounted to ∼75%, indicating that, on average, the quest procedure successfully converged to the prespecified threshold (see Visual and auditory stimuli).
Table 1.
Behavioral responses averaged across participants (±SD)
| TMS sites | Percentage correct |
Reaction time, ms |
||||||
|---|---|---|---|---|---|---|---|---|
| Auditory present |
Auditory absent |
Auditory present |
Auditory absent |
|||||
| Target present | Target absent | Target present | Target absent | Target present | Target absent | Target present | Target absent | |
| IPS | 75 ± 19 | 98 ± 1 | 74 ± 23 | 98 ± 1 | 704 ± 89 | 695 ± 79 | 710 ± 84 | 718 ± 63 |
| Sham | 75 ± 14 | 99 ± 1 | 75 ± 13 | 99 ± 1 | 699 ± 93 | 675 ± 98 | 712 ± 99 | 704 ± 89 |
For percentage correct responses, a 2 (visual input: V present, V absent) × 2 (TMS: IPS, Sham) × 2 (auditory context: A present, A absent) RM-ANOVA revealed a significant main effect of visual input (F(1,9) = 27.142; p < 0.001). None of the other main effects, two-way, or three-way interactions were significant.
For reaction times, a 2 (visual input: V present, V absent) × 2 (TMS: IPS, Sham) × 2 (auditory context: A present, A absent) RM-ANOVA revealed a significant main effect of auditory context (F(1,9) = 6.145; p = 0.035) and a significant interaction between auditory context and visual input (F(1,9) = 7.644; p = 0.022). More specifically, auditory context shortened reaction times more when the visual signal was absent, than when it was present. This suggests that the auditory signal served as a precise temporal cue for “target onset” in particular when the target was not presented leading to faster ‘no’ responses. None of the other main effects, two-way or three-way interactions were significant.
Importantly, in line with previous concurrent TMS-fMRI studies (Blankenburg et al., 2010; Moisa et al., 2012), our TMS manipulation did not elicit any behavioral changes in terms of percentage correct or reaction times. Hence, our TMS manipulation functioned as a purely physiological perturbation method that allowed us to examine the influences on remote interconnected brain areas unconfounded by behavioral differences.
Eye-tracker data
Eye movements were assessed by computing the mean distance from the fixation cross and the proportion of blinks separately for each individual experimental condition, as well as for baseline periods.
First, we compared eye movements during task trials (pooled, i.e., averaged across all task conditions) with baseline conditions in paired t tests separately for each index. Indeed, the mean distance from the fixation cross was significantly greater during baseline periods (1.362° ± 0.48) than task trials (0.894° ± 0.29; paired t test: t(7) = −2.8695, p = 0.024). We also observed a nonsignificant (t(7) = −1.136, p = 0.293) increase in eye blinks for fixation baseline periods (1.746 ± 0.61) relative to activation trials (1.381 ± 0.59).
Importantly, there was no significant difference in eye movements among our experimental conditions, as confirmed by 2 (task-relevant visual input: V present, V absent) × 2 (TMS: IPS, Sham) × 2 (auditory context: A present, A absent) RM-ANOVAs performed independently for the mean distance from the fixation cross and the proportion of blinks, respectively. Neither of the two RM-ANOVAs revealed any significant main effects or interactions.
Collectively, these results demonstrate that differences in eye movements across task conditions are unlikely to account for activation differences across the eight task conditions. However, activation differences between task conditions and fixation baseline may result from eye movements that participants made during the fixation conditions when they recovered from the very demanding sustained attention task. Activations and deactivations relative to fixation baseline may in part be accounted for by eye movement confounds. Hence, the parameter estimate plots should be interpreted only by comparing the eight task conditions, whereas the activation or deactivation relative to fixation should not be further interpreted.
Neuroimaging data
The neuroimaging data were analyzed in four steps. First, the general task event driven versus contextual block effects were evaluated. Second, we evaluated the main effects of TMS pooled over sensory contexts. Third, the effects of task-relevant visual input were characterized as main effects and in interaction with TMS and auditory context. Fourth, the main effects of auditory context and its interaction with TMS were identified.
General experimental event and brief contextual block effects at the beginning and end of the task blocks
We initially contrasted blocks and experimental events against the fixation baseline period to evaluate general experimental events and contextual block effects. Events elicited significant activations in the bilateral auditory cortices likely as a result of the TMS clicks that were absent during baseline periods (Fig. 2A). Furthermore, significant effects were also observable in a motor network comprising the left motor cortex (Fig. 2A) and the right cerebellum (data not shown), which is consistent with button responses given with the right hand.
Figure 2.

General experimental event and brief contextual block effects. Activations induced by contrasting (A) events and (B) block begin + block end periods against the unmodeled baseline are rendered on an inflated SPM template of the entire brain. For illustrational purposes only, effects are displayed at a height threshold of p = 0.01 uncorrected and an extent threshold of 100 voxels.
As expected, the brief block periods at the beginning and end of the task blocks increased activations in the attentional network that included bilateral frontoparietal regions and the bilateral insulae, plus areas of the occipital, motor, and temporal cortices (Fig. 2B).
Main effects of TMS
Main effects of TMS were identified by directly comparing IPS- and Sham-TMS conditions while pooling over auditory contexts and visual input. IPS-TMS relative to Sham-TMS increased activations in the right parietal cortex. More specifically, significant activation clusters were found in the right superior parietal lobe, extending to the right postcentral gyrus and the right paracentral lobule (Fig. 3; Table 2). The average coil position for IPS stimulation is shown in Figure 3, green circle. Note that IPS-TMS relative to Sham-TMS did not activate the auditory and somatosensory cortices, suggesting that the Sham condition served as an excellent control for nonspecific TMS effects in this study (Leitão et al., 2013).
Figure 3.

Main effects of TMS. Activations induced in the right parietal cortex by IPS- relative to Sham-TMS. The green circle marks the averaged reached position of the TMS coil during IPS stimulation. All effects are rendered on an inflated SPM template of the entire brain and displayed on sagittal and axial slices of a mean image created by averaging the subjects' normalized structural images. For illustrational purposes only, effects are displayed at a height threshold of p = 0.01 uncorrected and an extent threshold of 100 voxels. Bar plots represent mean cluster parameter estimates (SEM) at the respective locations displayed on the left, which were obtained by averaging across voxelwise values extracted from each cluster for each individual condition. The bar graphs represent the size of the effect in nondimensional units (corresponding to percentage whole-brain mean).
Table 2.
Main effects of TMS
| Brain regions | MNI coordinates, mm |
Z-score (peak) | No. of voxels in cluster | pFWE value (cluster) | ||
|---|---|---|---|---|---|---|
| x | y | z | ||||
| IPS > Sham | ||||||
| Right superior parietal lobule | 16 | −68 | 58 | 4.15 | 737 | 0.009 |
| Right postcentral gyrus | 12 | −40 | 70 | 3.99 | ||
| Right paracentral lobule | 8 | −44 | 68 | 3.96 | ||
p values are reported at the cluster level and corrected for multiple comparisons within the entire brain using an auxiliary uncorrected voxel threshold of p = 0.01 and an extent threshold of 0 voxels. FWE, Familywise error correction.
The comparison for Sham-TMS relative to IPS-TMS did not reveal any significant effects
Effects of task-relevant visual input and its interactions with TMS and auditory context
Main effects of task-relevant visual input
Main effects of task-relevant visual input were calculated by pooling over auditory contexts and TMS conditions. The presence of visual targets increased activations in the right anterior insula, extending to the right inferior frontal gyrus (Fig. 4A; Table 3), a region that was often reported to be part of the salience network (Menon and Uddin, 2010). Notably, targets did not activate the primary visual cortex. This can be explained by the nature of our visual stimuli. Their size and duration, together with their peripheral location were probably not strong enough to produce BOLD activations in primary visual areas that could be reliably detected at the spatial resolution of our whole-brain EPI images.
Figure 4.
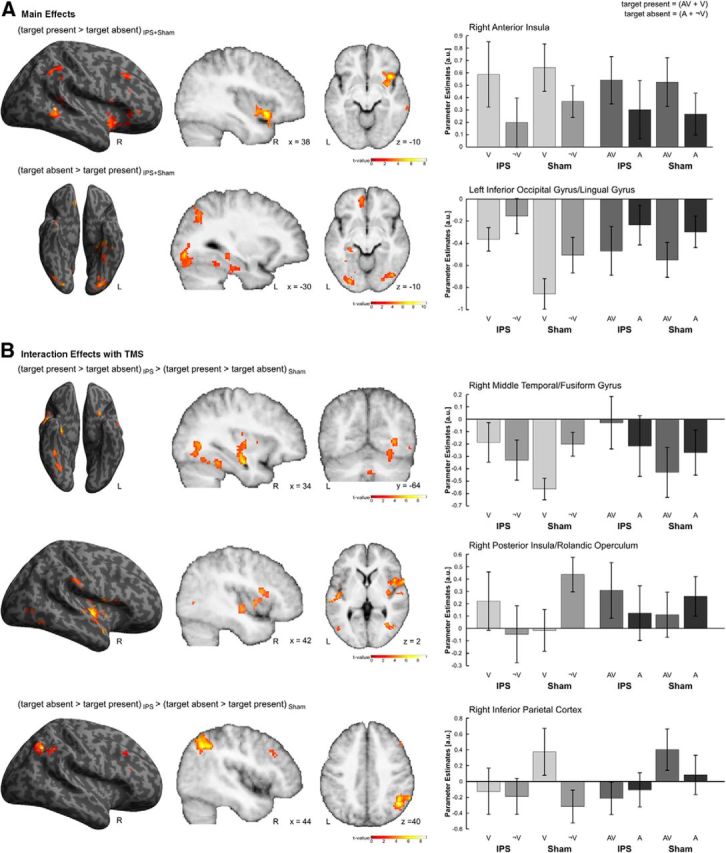
Effects of task-relevant visual input. A, Main effects. Activations induced in the right anterior insula by comparing target present relative to target absent and in the inferior occipital/lingual gyrus by comparing target absent relative to target present trials. B, Interaction effects with TMS. Interaction effects between task-relevant visual input and TMS in the right middle temporal/fusiform gyrus, the right posterior insula and in the right inferior parietal cortex. All effects are rendered on an inflated SPM template of the entire brain and displayed on sagittal and axial slices of a mean image created by averaging the subjects' normalized structural images. For illustrational purposes only, effects are displayed at a height threshold of p = 0.01 uncorrected and an extent threshold of 100 voxels. Bar plots represent mean cluster parameter estimates (±SEM) at the respective locations displayed on the left, which were obtained by averaging across voxelwise β values extracted from each cluster for each individual condition. The bar graphs represent the size of the effect in nondimensional units (corresponding to percentage whole-brain mean).
Table 3.
Effects of task-relevant visual input and its interactions with TMS and auditory context
| Brain regions | MNI coordinates, mm |
Z-score (peak) | No. of voxels in cluster | pFWE value (cluster) | ||
|---|---|---|---|---|---|---|
| x | y | z | ||||
| Main effects | ||||||
| (target present > target absent)IPS + Sham | ||||||
| Right anterior insula | 38 | 16 | −10 | 3.89 | 443 | 0.009 |
| Right inferior frontal gyrus | 50 | 12 | 8 | 3.56 | ||
| (target absent > target present)IPS + Sham | ||||||
| Left inferior occipital gyrus | −30 | −84 | −8 | 4.04 | 410 | 0.032 |
| Left middle occipital gyrus | −28 | −78 | 4 | 3.49 | ||
| Left lingual gyrus | −26 | −86 | −16 | 3.27 | ||
| Left fusiform gyrus | −30 | −78 | −18 | 3.06 | ||
| Left hippocampus | −22 | −24 | −30 | 3.73 | 534 | 0.007 |
| Left parahippocampal gyrus | −18 | −26 | −18 | 3.57 | ||
| Left anterior fusiform gyrus | −36 | −22 | −28 | 3.34 | ||
| Left mid-orbital gyrus | −8 | 48 | −8 | 3.30 | 397 | 0.038 |
| Right rectal gyrus | 10 | 36 | −20 | 2.95 | ||
| Interaction between task-relevant visual input and TMS (state-dependent TMS effects) | ||||||
| (target present > target absent)IPS > (target present > target absent)Sham | ||||||
| Right posterior/middle insula | 44 | 4 | 2 | 3.80 | 478 | 0.010 |
| Right Rolandic operculum (BA44) | 60 | 8 | 2 | 3.72 | ||
| Right temporal pole | 54 | 4 | −2 | 3.47 | ||
| Right inferior frontal gyrus | 42 | 18 | 10 | 2.65 | ||
| Right inferior temporal gyrus | 54 | −58 | −10 | 3.69 | 420 | 0.022 |
| Right middle temporal gyrus | 46 | −68 | 2 | 3.47 | ||
| Right fusiform gyrus | 34 | −42 | −20 | 3.31 | ||
| (target present > target absent)Sham > (target present > target absent)IPS | ||||||
| Right angular gyrus | 44 | −58 | 40 | 4.43 | 444 | 0.016 |
| Right inferior parietal lobule | 44 | −52 | 40 | 3.92 | ||
p values are reported at the cluster level and corrected for multiple comparisons within the entire using an auxiliary uncorrected voxel threshold of p = 0.01 and an extent threshold of 0 voxels. FEW, Familywise error correction.
However, deactivations in the left lingual and middle occipital gyri and the bilateral inferior occipital and fusiform gyri were observed for the comparison between visual absent and visual present trials (Fig. 4A; Table 3). Specifically, independently of the TMS condition, deactivations in these areas were increased for visual absent relative to visual present trials. This relative activation increase for target absent trials may reflect the natural termination of the expectation period through the presentation of the target, which is in line with the idea that the expectation of a behaviorally relevant stimulus increases activations in visual areas even in the absence of visual stimulation (Kastner et al., 1999).
Further, significant activations were also observed in the left orbitofrontal cortex and parahippocampal gyrus (Table 3).
Interaction between task-relevant visual input and TMS (state-dependent TMS effects)
Modulatory effects of TMS on processing of the task-relevant visual signal were identified by testing for interactions between visual input and TMS conditions. The interaction contrast between target present > target absent and IPS > Sham revealed significant activation clusters in the right fusiform gyrus extending to the right inferior and middle temporal gyri (Fig. 4B, top; Table 3) and in the right posterior/middle insula extending laterally to the posterior part of BA44 (Fig. 4B, middle; Table 3). In visual areas, TMS abolished the visual-induced activation decreases.
The reverse interaction contrast between target present > target absent and Sham > IPS showed effects in the TPJ extending into the right angular gyrus and inferior parietal lobe (Fig. 4B, bottom; Table 3). Here, regardless of the auditory context, IPS-TMS abolished visual-evoked activations observed during normal processing conditions.
In summary, IPS-TMS abolished the visual-evoked activations in TPJ and deactivations in the fusiform gyri. Functionally, this suggests that IPS-TMS plays a critical causal role in shaping stimulus-evoked responses in the visual and the ventral attentional systems. While previous studies have shown a critical role for IPS in shaping visual evoked responses in occipital areas, our results suggest that the IPS also provides critical input to the TPJ. In line with leading accounts, IPS may for instance impose target-filtering settings on TPJ. However, as the TMS pulse was applied 100 ms poststimulus, TMS could interfere with filtering settings only during poststimulus processing leaving the prestimulus filtering settings unaffected. Thus, the timing of the TMS pulse may suggest a critical role for TPJ in postperceptual processing rather than as a circuit breaker that interrupts attentional processes in the dorsal system (Corbetta and Shulman, 2002). This conjecture converges with the reported response latencies of the dorsal and ventral systems, where the dorsal system responds already at ∼130–170 ms, whereas the TPJ is more clearly associated with the P300 response (for reviews, see Corbetta et al., 2008; Geng and Vossel, 2013). Based on these latency data, the TPJ responds too late to effectively break circuits in the dorsal attentional system and may instead play a more generic role in postperceptual contextual updating (Geng and Vossel, 2013), such as updating the target probability and expectations from trial to trial (Yu and Cohen, 2009; Arjona and Gómez, 2014). Thus, the observed IPS-TMS effects at 100 ms poststimulus on TPJ activations further support a role of TPJ in postperceptual updating. Moreover, they suggest that the IPS provides critical causal contributions to this contextual updating process.
Future studies manipulating the timing of TMS are needed to provide further insights into the role of IPS in prestimulus and poststimulus processing during sustained visuospatial attention. Regardless of the precise mechanism, our results reveal robust causal influences of IPS not only on visual areas but also on the ventral attentional system at 100 ms poststimulus.
Three-way interactions between task-relevant visual input, TMS, and auditory context
Finally, we investigated whether any of the three regions (i.e., fusiform, TPJ, middle/posterior insula; see above) showing a significant interaction between visual input and TMS were also modulated by auditory context. We observed a significant three-way interaction between visual input, auditory context, and TMS condition in the posterior insula (F(1,9) = 8.350; p = 0.018). In particular, in this region the auditory input reduced the interaction effects between visual input and TMS condition (Fig. 4B, middle, right).
We did not observe any significant three-way interaction effects when correcting for multiple comparisons within the entire brain at the cluster level.
Effects of auditory context and its interactions with TMS: main effects of auditory context
Main effects of auditory context were calculated by pooling over visual input and TMS conditions. Given the a priori hypotheses that auditory stimuli should activate auditory cortices, we tested for the main effect of auditory context in addition to our whole-brain analysis also constrained to the primary auditory cortex that was defined based on probabilistic cytoarchitectonic maps (see Search volume constraints). Indeed, the presence of auditory stimuli increased activations in bilateral auditory cortices, with a significant activation cluster in the right Heschl's gyrus (Fig. 5A; Table 4). The absence of significant activations in the left auditory cortex may be explained by the fact that the auditory cortex was already being strongly activated by the additional scanner noise and TMS clicks (see General experimental event and brief contextual block effects at the beginning and end of the task blocks). The reverse comparison did not reveal any effects.
Figure 5.

Effects of auditory context. A, Main effects. Activations induced in auditory cortices by comparing auditory present relative to auditory absent trials. B, Interaction effects with TMS. Activations in the right posterior middle temporal gyrus that resulted from the interaction between auditory context and TMS. All effects are displayed on coronal, sagittal, and axial slices of a mean image created by averaging the subjects' normalized structural images. For illustrational purposes only, effects are displayed at a height threshold of p = 0.01 uncorrected and an extent threshold of 100 voxels. Bar plots represent mean cluster parameter estimates (±SEM) at the locations displayed on the left, which were obtained by averaging across voxelwise β values extracted from each cluster for each individual condition. The bar graphs represent the size of the effect in nondimensional units (corresponding to percentage whole-brain mean).
Table 4.
Effects of auditory context and its interactions with TMS
| Brain regions | MNI coordinates, mm |
Z-score (peak) | No. of voxels in cluster | pFWE value | ||
|---|---|---|---|---|---|---|
| x | y | z | ||||
| Main effects | ||||||
| (auditory present > auditory absent)IPS + Sham | ||||||
| Right Heschl's gyrus | 46 | −24 | 12 | 4.05 | 101* | 0.025* |
| Right superior temporal gyrus | 50 | −14 | 4 | 2.62 | 0.323* | |
| Left superior temporal gyrus | −48 | −28 | 16 | 3.61 | 118* | 0.266* |
| Interaction between auditory context and TMS (state-dependent TMS effects) | ||||||
| (auditory present > auditory absent)IPS > (auditory present > auditory absent)Sham | ||||||
| Right middle temporal gyrus | 50 | −58 | 4 | 4.26 | 328 | 0.125 |
| Right angular gyrus | 50 | −68 | 30 | 3.52 | ||
| Right middle occipital gyrus | 54 | −68 | 24 | 3.23 | ||
p values are reported at the cluster level and corrected for multiple comparisons within the entire brain and at the peak level within the auditory cortex (*) using an auxiliary uncorrected voxel threshold of p = 0.01 and an extent threshold of 0 voxels. FWE, Familywise error correction.
Interaction between auditory context and TMS (state-dependent TMS effects)
We investigated the modulatory effects of TMS on auditory processing by testing for the interaction between auditory context and TMS. At an uncorrected threshold of significance, the interaction contrast between auditory present > auditory absent and IPS > Sham revealed effects in the right middle temporal gyrus extending to the right angular and middle occipital gyri (Fig. 5B; Table 4). We report this effect only for completeness, as its location closely corresponds to areas of the posterior superior temporal sulcus that not only exhibit response overlaps to both visual and auditory stimulation in isolation (Driver and Noesselt, 2008) but have also been implicated in audiovisual temporal and object processing (Lewis et al., 2005; Noesselt et al., 2007; Lee and Noppeney, 2014).
Discussion
The current study used concurrent TMS-fMRI as a causal perturbation method to elucidate the complex interactions between the dorsal and ventral attention systems and their influence on visual processing areas in a sustained spatial attention paradigm.
An influential model of attentional control postulates the existence of two anatomically separate systems, each performing distinct attentional functions (Corbetta and Shulman, 2002; Corbetta et al., 2008). The dorsal frontoparietal network, comprising the superior parietal lobe, the IPS, and the frontal eye fields, supports top-down endogenous attention based on prior knowledge, expectations, and current goals. The dorsal system is thought to modulate sensory processing and shape responses to behaviorally relevant signals in the ventral attentional system. Conversely, this mostly right lateralized ventral frontoparietal network composed of the TPJ, the ventral frontal cortex, and the anterior insula, is involved in detection of relevant sensory events, which in turn updates the expectations of the dorsal system. Yet, the role of TPJ in the dynamic deployment of attention remains debated. More recent views have proposed that the TPJ performs a more generic function of contextual updating. For instance, in our paradigm the TPJ may update participants' expectations about target presence in a sequence of trials (for reviews, see Corbetta et al., 2008; Geng and Vossel, 2013).
Our study demonstrates that the anterior insula plays a key role in detecting task-relevant visual inputs. Even though the visual inputs were too weak in our paradigm to evoke BOLD responses in visual areas, the anterior insula showed reliable response enhancement (Fig. 4A). Perhaps surprisingly, the fusiform showed pronounced deactivations for visual target “present” relative to “absent” trials (Fig. 4A). In other words, the activation increases in the anterior insula to visual targets were mirrored by activation decreases in the fusiform gyrus. This suppression of fusiform activations by visual input can be explained by the complex interplay between the two attentional systems and visual areas.
Numerous studies have shown that activity in extrastriate visual areas is profoundly modulated by attention (Martínez et al., 1999; Hopfinger et al., 2000; Yantis and Serences, 2003). For instance, Kastner et al. (1999) showed that the expectation of a behaviorally relevant stimulus increases activations in visual areas even in the absence of visual stimulation. In our study, the color change of the fixation cross indicates the beginning of the time interval where participants expect the target to be presented on 50% of the trials. This expectation period is naturally terminated by the target presentation. By contrast, during the target absent trials this expectation period may persist beyond those time constraints imposed by target presentation. Hence, the response suppression for target present relative to absent trials in our study most likely reflects the earlier termination of the expectation period upon “neural” target detection by the insula.
As the intraparietal sulcus is a prime candidate region for both exerting top-down effects on sensory areas (Kastner and Ungerleider, 2000; Macaluso and Driver, 2005; Ruff et al., 2008; Rohe and Noppeney, 2015) and shaping target-specific responses of the ventral attentional system, the current study investigated how perturbation of IPS by TMS affects the neural responses in these spatially remote visual and attentional areas. First, we demonstrate activation increases for IPS- relative to Sham-TMS stimulation regardless of sensory stimulation in the right superior parietal lobes. This finding provides strong evidence for the neural effectiveness of the TMS perturbation in the absence of behavioral effects (Fig. 3). Our paradigm thus enabled us to characterize neural effects induced by IPS-TMS unconfounded by concurrent behavioral changes (see Behavioral data in the results section for further methodological discussion).
Critically, our study reveals IPS-TMS influences on visual target processing in two distinct neural systems. First, IPS-TMS abolished the responses to visual targets in the TPJ, a key component of the ventral attentional system (Fig. 4B). These findings emphasize the critical importance of “normal” IPS inputs for shaping TPJ function. Second, IPS-TMS abolished the target-evoked response suppression in visual areas. In fact, the right fusiform gyrus showed nearly equivalent activations for target-present trials under IPS-TMS and target-absent trials without TMS (Fig. 4B). This finding demonstrates that the target-evoked TPJ activations and fusiform deactivations depend causally on direct or indirect inputs from IPS (Macaluso and Doricchi, 2013; Vossel et al., 2014).
Based on leading models of attentional control, we suggest that IPS signals may be critical for shaping the target filtering settings or the postperceptual updating processing in TPJ (e.g., updating expectations about target presence). As a consequence, IPS-TMS abolishes the differential TPJ responses for target and nontarget trials. This is an important novel finding which suggests that potentially it is not the TPJ that initially detects a target and then interrupts attentional processes in the IPS. Instead, the IPS, that has previously been suggested to respond faster to target stimuli than the TPJ, may be furnishing critical inputs for shaping neural processes and contextual updating in the TPJ (Corbetta et al., 2008; Geng and Vossel, 2013).
In addition to TPJ and visual areas, the middle/posterior insula exhibited target-evoked responses that were modulated by TMS stimulation. In contrast to the anterior insula, the middle/posterior insula has been implicated in multisensory (Calvert et al., 2001; Naghavi et al., 2007) and sensorimotor integration (Kurth et al., 2010; Cauda et al., 2011; Deen et al., 2011). Indeed, the visual target-evoked responses in the posterior insula were interactively modulated by both TMS and auditory context. Auditory context generally reduced the modulatory effect of TMS on visual target-evoked responses. Even though the auditory signal was task-irrelevant and did not predict the presence of the visual target, it reduced the temporal uncertainty about target onset and potentially also increased target salience via audiovisual integration (Alvarado et al., 2007; Stein and Stanford, 2008). In support of this conjecture, participants were generally faster when responding during the auditory context (for related findings, see Lippert et al., 2007; Lewis and Noppeney, 2010; Werner and Noppeney, 2010; Fiebelkorn et al., 2011; Kim et al., 2012). The posterior insula may thus integrate audiovisual signals with top-down control signals from the IPS to generate rapid adaptive responses to task-relevant signals in the environment.
In the light of these profound TMS effects on the neural processes underlying target detection and previous reports of IPS-TMS effects on behavior, one may be puzzled about the absence of any behavioral effects in the current study (Blankenburg et al., 2010). There are two main accounts to explain this neural-behavioral dissociation: First, there is likely to be substantial degeneracy (Edelman and Gally, 2001; Price and Friston, 2002; Noppeney et al., 2004) in the attentional systems, which might also contribute to the rapid recovery from neglect after stroke (Corbetta et al., 2005). For instance, in our study the anterior insula preserved normal response profiles under TMS stimulation and may thus compensate for disturbances in other components of the ventral system. Likewise, many regions in the visual system remained largely unaffected by TMS stimulation.
Second, it is increasingly recognized that BOLD-responses can be substantially influenced by subthreshold neural activity (Friston, 2008; Goense and Logothetis, 2008; Logothetis, 2008) that may not be translated into overt behavioral effects. In particular, our paradigm differed from previous paradigms by the fact that we presented signals only in participants' left hemifield within a predefined placeholder. By contrast, previous paradigms presented stimuli in participants' left and right hemifields in a stochastic fashion thereby placing different demands on participants' attentional resources. In our study, the attentional focus was small and constant across the entire experiment, whereas in studies with bilateral target presentation participants had to simultaneously monitor at least two different locations. Behavioral effects (e.g., interference effects) can often be more reliably measured in more difficult tasks that place extensive demands on cognitive resources, although they remain nonsignificant or subthreshold when demands are lowered (Mottaghy et al., 2003; Noppeney et al., 2010; Philiastides et al., 2011, their supplemental material). Future studies will need to build on the current study and explore TMS timing and parameters as well as compare the influence of various attentional contexts.
To our knowledge this is the first demonstration that IPS exerts profound causal influences not only on visual areas but also on the TPJ as a critical component of the ventral attentional system. Although IPS-TMS abolished target-evoked activation increases in the right TPJ, it eliminated target-evoked activation decreases in the right fusiform gyrus. Critically, the causal effects on fusiform and TPJ activations emerged when TMS was applied 100 ms poststimulus. These findings provide a novel perspective on the intricate interplay between dorsal and ventral attentional systems that jointly enable target detection under sustained spatial attention. They suggest a directional causal influence from IPS on TPJ processing 100 ms poststimulus thereby challenging traditional theories that have attributed a circuit breaker role to the TPJ with subsequent effects on neural processing in IPS.
Footnotes
This work was supported by the European Research Council (ERC-multsens) and by the Max Planck Society. We thank Julian Hofmeister and Simone Götze for helping with data acquisition, Mario Kleiner for technical assistance, medical doctors Daniel Zaldivar, Johannes Schultz, and Matthias Munk for their availability during data acquisition and participants' screening, and the two anonymous reviewers for their useful and constructive comments.
The authors declare no competing financial interests.
References
- Algazi VR, Duda RO, Thompson DM, Avendano C. The CIPIC HRTF database. IEEE Workshop on Applications of Signal Processing to Audio and Acoustics 2001; New Paltz, NY: IEEE; 2001. pp W2001-2001-W2001-2004. [Google Scholar]
- Alvarado JC, Vaughan JW, Stanford TR, Stein BE. Multisensory versus unisensory integration: contrasting modes in the superior colliculus. J Neurophysiol. 2007;97:3193–3205. doi: 10.1152/jn.00018.2007. [DOI] [PubMed] [Google Scholar]
- Arjona A, Gómez C. Sequential effects in the central cue PosnerParadigm: on-line Bayesian learning. In: Mangun G, editor. Cognitive electrophysiology of attention: signals of the mind. San Diego: Academic; 2014. pp. 45–57. [Google Scholar]
- Bestmann S, Baudewig J, Frahm J. On the synchronization of transcranial magnetic stimulation and functional echo-planar imaging. J Magn Reson Imaging. 2003;17:309–316. doi: 10.1002/jmri.10260. [DOI] [PubMed] [Google Scholar]
- Blankenburg F, Ruff CC, Bestmann S, Bjoertomt O, Josephs O, Deichmann R, Driver J. Studying the role of human parietal cortex in visuospatial attention with concurrent TMS-fMRI. Cereb Cortex. 2010;20:2702–2711. doi: 10.1093/cercor/bhq015. [DOI] [PMC free article] [PubMed] [Google Scholar]
- Brainard DH. The psychophysics toolbox. Spat Vis. 1997;10:433–436. doi: 10.1163/156856897X00357. [DOI] [PubMed] [Google Scholar]
- Calvert GA, Hansen PC, Iversen SD, Brammer MJ. Detection of audio-visual integration sites in humans by application of electrophysiological criteria to the BOLD effect. Neuroimage. 2001;14:427–438. doi: 10.1006/nimg.2001.0812. [DOI] [PubMed] [Google Scholar]
- Cauda F, D'Agata F, Sacco K, Duca S, Geminiani G, Vercelli A. Functional connectivity of the insula in the resting brain. Neuroimage. 2011;55:8–23. doi: 10.1016/j.neuroimage.2010.11.049. [DOI] [PubMed] [Google Scholar]
- Chambers CD, Stokes MG, Mattingley JB. Modality-specific control of strategic spatial attention in parietal cortex. Neuron. 2004;44:925–930. doi: 10.1016/j.neuron.2004.12.009. [DOI] [PubMed] [Google Scholar]
- Corbetta M, Shulman GL. Control of goal-directed and stimulus-driven attention in the brain. Nat Rev Neurosci. 2002;3:201–215. doi: 10.1038/nrn755. [DOI] [PubMed] [Google Scholar]
- Corbetta M, Kincade JM, Ollinger JM, McAvoy MP, Shulman GL. Voluntary orienting is dissociated from target detection in human posterior parietal cortex. Nat Neurosci. 2000;3:292–297. doi: 10.1038/73009. [DOI] [PubMed] [Google Scholar]
- Corbetta M, Kincade MJ, Lewis C, Snyder AZ, Sapir A. Neural basis and recovery of spatial attention deficits in spatial neglect. Nat Neurosci. 2005;8:1603–1610. doi: 10.1038/nn1574. [DOI] [PubMed] [Google Scholar]
- Corbetta M, Patel G, Shulman GL. The reorienting system of the human brain: from environment to theory of mind. Neuron. 2008;58:306–324. doi: 10.1016/j.neuron.2008.04.017. [DOI] [PMC free article] [PubMed] [Google Scholar]
- Deen B, Pitskel NB, Pelphrey KA. Three systems of insular functional connectivity identified with cluster analysis. Cereb Cortex. 2011;21:1498–1506. doi: 10.1093/cercor/bhq186. [DOI] [PMC free article] [PubMed] [Google Scholar]
- DiQuattro NE, Sawaki R, Geng JJ. Effective connectivity during feature-based attentional capture: evidence against the attentional reorienting hypothesis of TPJ. Cereb Cortex. 2014;24:3131–3341. doi: 10.1093/cercor/bht172. [DOI] [PubMed] [Google Scholar]
- Driver J, Noesselt T. Multisensory interplay reveals crossmodal influences on “sensory-specific” brain regions, neural responses, and judgments. Neuron. 2008;57:11–23. doi: 10.1016/j.neuron.2007.12.013. [DOI] [PMC free article] [PubMed] [Google Scholar]
- Duecker F, Sack AT. Pre-stimulus sham TMS facilitates target detection. PLoS One. 2013;8:e57765. doi: 10.1371/journal.pone.0057765. [DOI] [PMC free article] [PubMed] [Google Scholar]
- Edelman GM, Gally JA. Degeneracy and complexity in biological systems. Proc Natl Acad Sci U S A. 2001;98:13763–13768. doi: 10.1073/pnas.231499798. [DOI] [PMC free article] [PubMed] [Google Scholar]
- Eickhoff SB, Stephan KE, Mohlberg H, Grefkes C, Fink GR, Amunts K, Zilles K. A new SPM toolbox for combining probabilistic cytoarchitectonic maps and functional imaging data. Neuroimage. 2005;25:1325–1335. doi: 10.1016/j.neuroimage.2004.12.034. [DOI] [PubMed] [Google Scholar]
- Fiebelkorn IC, Foxe JJ, Butler JS, Molholm S. Auditory facilitation of visual-target detection persists regardless of retinal eccentricity and despite wide audiovisual misalignments. Exp brain Res. 2011;213:167–174. doi: 10.1007/s00221-011-2670-7. [DOI] [PubMed] [Google Scholar]
- Fox MD, Corbetta M, Snyder AZ, Vincent JL, Raichle ME. Spontaneous neuronal activity distinguishes human dorsal and ventral attention systems. Proc Natl Acad Sci U S A. 2006;103:10046–10051. doi: 10.1073/pnas.0604187103. [DOI] [PMC free article] [PubMed] [Google Scholar]
- Friston K. Neurophysiology: the brain at work. Curr Biol. 2008;18:R418–420. doi: 10.1016/j.cub.2008.03.042. [DOI] [PubMed] [Google Scholar]
- Friston KJ, Holmes AP, Worsley KJ, Poline JB, Frith CD, Frackowiak RSJ. Statistical parametric maps in functional imaging: a general linear approach. Hum Brain Mapp. 1995;2:189–210. [Google Scholar]
- Friston KJ, Holmes AP, Price CJ, Büchel C, Worsley KJ. Multisubject fMRI studies and conjunction analyses. Neuroimage. 1999;10:385–396. doi: 10.1006/nimg.1999.0484. [DOI] [PubMed] [Google Scholar]
- Friston KJ, Rotshtein P, Geng JJ, Sterzer P, Henson RN. A critique of functional localisers. Neuroimage. 2006;30:1077–1087. doi: 10.1016/j.neuroimage.2005.08.012. [DOI] [PubMed] [Google Scholar]
- Geng JJ, Mangun GR. Right temporoparietal junction activation by a salient contextual cue facilitates target discrimination. Neuroimage. 2011;54:594–601. doi: 10.1016/j.neuroimage.2010.08.025. [DOI] [PMC free article] [PubMed] [Google Scholar]
- Geng JJ, Vossel S. Re-evaluating the role of TPJ in attentional control: contextual updating? Neurosci Biobehav Rev. 2013;37:2608–2620. doi: 10.1016/j.neubiorev.2013.08.010. [DOI] [PMC free article] [PubMed] [Google Scholar]
- Gillebert CR, Mantini D, Thijs V, Sunaert S, Dupont P, Vandenberghe R. Lesion evidence for the critical role of the intraparietal sulcus in spatial attention. Brain. 2011;134:1694–1709. doi: 10.1093/brain/awr085. [DOI] [PubMed] [Google Scholar]
- Goense JB, Logothetis NK. Neurophysiology of the BOLD fMRI signal in awake monkeys. Curr Biol. 2008;18:631–640. doi: 10.1016/j.cub.2008.03.054. [DOI] [PubMed] [Google Scholar]
- Hampshire A, Duncan J, Owen AM. Selective tuning of the blood oxygenation level-dependent response during simple target detection dissociates human frontoparietal subregions. J Neurosci. 2007;27:6219–6223. doi: 10.1523/JNEUROSCI.0851-07.2007. [DOI] [PMC free article] [PubMed] [Google Scholar]
- Hayasaka S, Nichols TE. Validating cluster size inference: random field and permutation methods. Neuroimage. 2003;20:2343–2356. doi: 10.1016/j.neuroimage.2003.08.003. [DOI] [PubMed] [Google Scholar]
- He BJ, Snyder AZ, Vincent JL, Epstein A, Shulman GL, Corbetta M. Breakdown of functional connectivity in frontoparietal networks underlies behavioral deficits in spatial neglect. Neuron. 2007;53:905–918. doi: 10.1016/j.neuron.2007.02.013. [DOI] [PubMed] [Google Scholar]
- Heinen K, Ruff CC, Bjoertomt O, Schenkluhn B, Bestmann S, Blankenburg F, Driver J, Chambers CD. Concurrent TMS-fMRI reveals dynamic interhemispheric influences of the right parietal cortex during exogenously cued visuospatial attention. Eur J Neurosci. 2011;33:991–1000. doi: 10.1111/j.1460-9568.2010.07580.x. [DOI] [PMC free article] [PubMed] [Google Scholar]
- Hilgetag CC, Théoret H, Pascual-Leone A. Enhanced visual spatial attention ipsilateral to rTMS-induced “virtual lesions” of human parietal cortex. Nat Neurosci. 2001;4:953–957. doi: 10.1038/nn0901-953. [DOI] [PubMed] [Google Scholar]
- Hopfinger JB, Buonocore MH, Mangun GR. The neural mechanisms of top-down attentional control. Nat Neurosci. 2000;3:284–291. doi: 10.1038/72999. [DOI] [PubMed] [Google Scholar]
- Indovina I, Macaluso E. Dissociation of stimulus relevance and saliency factors during shifts of visuospatial attention. Cereb Cortex. 2007;17:1701–1711. doi: 10.1093/cercor/bhl081. [DOI] [PubMed] [Google Scholar]
- Kastner S, Ungerleider LG. Mechanisms of visual attention in the human cortex. Annu Rev Neurosci. 2000;23:315–341. doi: 10.1146/annurev.neuro.23.1.315. [DOI] [PubMed] [Google Scholar]
- Kastner S, Pinsk MA, De Weerd P, Desimone R, Ungerleider LG. Increased activity in human visual cortex during directed attention in the absence of visual stimulation. Neuron. 1999;22:751–761. doi: 10.1016/S0896-6273(00)80734-5. [DOI] [PubMed] [Google Scholar]
- Kim R, Peters MA, Shams L. 0 + 1 > 1: how adding noninformative sound improves performance on a visual task. Psychol Sci. 2012;23:6–12. doi: 10.1177/0956797611420662. [DOI] [PubMed] [Google Scholar]
- Kincade JM, Abrams RA, Astafiev SV, Shulman GL, Corbetta M. An event-related functional magnetic resonance imaging study of voluntary and stimulus-driven orienting of attention. J Neurosci. 2005;25:4593–4604. doi: 10.1523/JNEUROSCI.0236-05.2005. [DOI] [PMC free article] [PubMed] [Google Scholar]
- Kleiner M, Brainard D, Pelli D, Ingling A, Murray R, Broussard C. What's new in psychtoolbox-3? Perception. 2007;36:Abstr. [Google Scholar]
- Kurth F, Zilles K, Fox PT, Laird AR, Eickhoff SB. A link between the systems: functional differentiation and integration within the human insula revealed by meta-analysis. Brain Struct Funct. 2010;214:519–534. doi: 10.1007/s00429-010-0255-z. [DOI] [PMC free article] [PubMed] [Google Scholar]
- Lee H, Noppeney U. Temporal prediction errors in visual and auditory cortices. Curr Biol. 2014;24:R309–10. doi: 10.1016/j.cub.2014.02.007. [DOI] [PubMed] [Google Scholar]
- Leitão J, Thielscher A, Werner S, Pohmann R, Noppeney U. Effects of parietal TMS on visual and auditory processing at the primary cortical level: a concurrent TMS-fMRI study. Cereb Cortex. 2013;23:873–884. doi: 10.1093/cercor/bhs078. [DOI] [PubMed] [Google Scholar]
- Lewis JW, Brefczynski JA, Phinney RE, Janik JJ, DeYoe EA. Distinct cortical pathways for processing tool versus animal sounds. J Neurosci. 2005;25:5148–5158. doi: 10.1523/JNEUROSCI.0419-05.2005. [DOI] [PMC free article] [PubMed] [Google Scholar]
- Lewis R, Noppeney U. Audiovisual synchrony improves motion discrimination via enhanced connectivity between early visual and auditory areas. J Neurosci. 2010;30:12329–12339. doi: 10.1523/JNEUROSCI.5745-09.2010. [DOI] [PMC free article] [PubMed] [Google Scholar]
- Linden DE, Prvulovic D, Formisano E, Völlinger M, Zanella FE, Goebel R, Dierks T. The functional neuroanatomy of target detection: an fMRI study of visual and auditory oddball tasks. Cereb Cortex. 1999;9:815–823. doi: 10.1093/cercor/9.8.815. [DOI] [PubMed] [Google Scholar]
- Lippert M, Logothetis NK, Kayser C. Improvement of visual contrast detection by a simultaneous sound. Brain Res. 2007;1173:102–109. doi: 10.1016/j.brainres.2007.07.050. [DOI] [PubMed] [Google Scholar]
- Logothetis NK. What we can do and what we cannot do with fMRI. Nature. 2008;453:869–878. doi: 10.1038/nature06976. [DOI] [PubMed] [Google Scholar]
- Macaluso E, Doricchi F. Attention and predictions: control of spatial attention beyond the endogenous-exogenous dichotomy. Front Hum Neurosci. 2013;7:685. doi: 10.3389/fnhum.2013.00685. [DOI] [PMC free article] [PubMed] [Google Scholar]
- Macaluso E, Driver J. Multisensory spatial interactions: a window onto functional integration in the human brain. Trends Neurosci. 2005;28:264–271. doi: 10.1016/j.tins.2005.03.008. [DOI] [PubMed] [Google Scholar]
- Martínez A, Anllo-Vento L, Sereno MI, Frank LR, Buxton RB, Dubowitz DJ, Wong EC, Hinrichs H, Heinze HJ, Hillyard SA. Involvement of striate and extrastriate visual cortical areas in spatial attention. Nat Neurosci. 1999;2:364–369. doi: 10.1038/7274. [DOI] [PubMed] [Google Scholar]
- Menon V, Uddin LQ. Saliency, switching, attention and control: a network model of insula function. Brain Struct Funct. 2010;214:655–667. doi: 10.1007/s00429-010-0262-0. [DOI] [PMC free article] [PubMed] [Google Scholar]
- Moisa M, Pohmann R, Ewald L, Thielscher A. New coil positioning method for interleaved transcranial magnetic stimulation (TMS)/functional MRI (fMRI) and its validation in a motor cortex study. J Magn Reson Imaging. 2009;29:189–197. doi: 10.1002/jmri.21611. [DOI] [PubMed] [Google Scholar]
- Moisa M, Pohmann R, Uludaǧ K, Thielscher A. Interleaved TMS/CASL: comparison of different rTMS protocols. Neuroimage. 2010;49:612–620. doi: 10.1016/j.neuroimage.2009.07.010. [DOI] [PubMed] [Google Scholar]
- Moisa M, Siebner HR, Pohmann R, Thielscher A. Uncovering a context-specific connectional fingerprint of human dorsal premotor cortex. J Neurosci. 2012;32:7244–7252. doi: 10.1523/JNEUROSCI.2757-11.2012. [DOI] [PMC free article] [PubMed] [Google Scholar]
- Mottaghy FM, Pascual-Leone A, Kemna LJ, Töpper R, Herzog H, Müller-Gärtner HW, Krause BJ. Modulation of a brain-behavior relationship in verbal working memory by rTMS. Brain Res Cogn Brain Res. 2003;15:241–249. doi: 10.1016/S0926-6410(02)00196-9. [DOI] [PubMed] [Google Scholar]
- Naghavi HR, Eriksson J, Larsson A, Nyberg L. The claustrum/insula region integrates conceptually related sounds and pictures. Neurosci Lett. 2007;422:77–80. doi: 10.1016/j.neulet.2007.06.009. [DOI] [PubMed] [Google Scholar]
- Noesselt T, Rieger JW, Schoenfeld MA, Kanowski M, Hinrichs H, Heinze HJ, Driver J. Audiovisual temporal correspondence modulates human multisensory superior temporal sulcus plus primary sensory cortices. J Neurosci. 2007;27:11431–11441. doi: 10.1523/JNEUROSCI.2252-07.2007. [DOI] [PMC free article] [PubMed] [Google Scholar]
- Noppeney U, Friston KJ, Price CJ. Degenerate neuronal systems sustaining cognitive functions. J Anat. 2004;205:433–442. doi: 10.1111/j.0021-8782.2004.00343.x. [DOI] [PMC free article] [PubMed] [Google Scholar]
- Noppeney U, Ostwald D, Werner S. Perceptual decisions formed by accumulation of audiovisual evidence in prefrontal cortex. J Neurosci. 2010;30:7434–7446. doi: 10.1523/JNEUROSCI.0455-10.2010. [DOI] [PMC free article] [PubMed] [Google Scholar]
- Oliver R, Bjoertomt O, Driver J, Greenwood R, Rothwell J. Novel “hunting” method using transcranial magnetic stimulation over parietal cortex disrupts visuospatial sensitivity in relation to motor thresholds. Neuropsychologia. 2009;47:3152–3161. doi: 10.1016/j.neuropsychologia.2009.07.017. [DOI] [PMC free article] [PubMed] [Google Scholar]
- Philiastides MG, Auksztulewicz R, Heekeren HR, Blankenburg F. Causal role of dorsolateral prefrontal cortex in human perceptual decision making. Curr Biol. 2011;21:980–983. doi: 10.1016/j.cub.2011.04.034. [DOI] [PubMed] [Google Scholar]
- Price CJ, Friston KJ. Degeneracy and cognitive anatomy. Trends Cogn Sci. 2002;6:416–421. doi: 10.1016/S1364-6613(02)01976-9. [DOI] [PubMed] [Google Scholar]
- Rohe T, Noppeney U. Cortical hierarchies perform Bayesian causal inference for multisensory perception. PLOS Biol. 2015;13:e1002073. doi: 10.1371/journal.pbio.1002073. [DOI] [PMC free article] [PubMed] [Google Scholar]
- Ruff CC, Blankenburg F, Bjoertomt O, Bestmann S, Freeman E, Haynes JD, Rees G, Josephs O, Deichmann R, Driver J. Concurrent TMS-fMRI and psychophysics reveal frontal influences on human retinotopic visual cortex. Curr Biol. 2006;16:1479–1488. doi: 10.1016/j.cub.2006.06.057. [DOI] [PubMed] [Google Scholar]
- Ruff CC, Bestmann S, Blankenburg F, Bjoertomt O, Josephs O, Weiskopf N, Deichmann R, Driver J. Distinct causal influences of parietal versus frontal areas on human visual cortex: evidence from concurrent TMS-fMRI. Cereb Cortex. 2008;18:817–827. doi: 10.1093/cercor/bhm128. [DOI] [PMC free article] [PubMed] [Google Scholar]
- Ruff CC, Blankenburg F, Bjoertomt O, Bestmann S, Weiskopf N, Driver J. Hemispheric differences in frontal and parietal influences on human occipital cortex: direct confirmation with concurrent TMS-fMRI. J Cogn Neurosci. 2009;21:1146–1161. doi: 10.1162/jocn.2009.21097. [DOI] [PMC free article] [PubMed] [Google Scholar]
- Sack AT, Kohler A, Bestmann S, Linden DE, Dechent P, Goebel R, Baudewig J. Imaging the brain activity changes underlying impaired visuospatial judgments: simultaneous FMRI, TMS, and behavioral studies. Cereb Cortex. 2007;17:2841–2852. doi: 10.1093/cercor/bhm013. [DOI] [PubMed] [Google Scholar]
- Serences JT, Yantis S, Culberson A, Awh E. Preparatory activity in visual cortex indexes distractor suppression during covert spatial orienting. J Neurophysiol. 2004;92:3538–3545. doi: 10.1152/jn.00435.2004. [DOI] [PubMed] [Google Scholar]
- Silvanto J, Muggleton N, Walsh V. State-dependency in brain stimulation studies of perception and cognition. Trends Cogn Sci. 2008;12:447–454. doi: 10.1016/j.tics.2008.09.004. [DOI] [PubMed] [Google Scholar]
- Stein BE, Stanford TR. Multisensory integration: current issues from the perspective of the single neuron. Nat Rev Neurosci. 2008;9:255–266. doi: 10.1038/nrn2331. [DOI] [PubMed] [Google Scholar]
- Verdon V, Schwartz S, Lovblad KO, Hauert CA, Vuilleumier P. Neuroanatomy of hemispatial neglect and its functional components: a study using voxel-based lesion-symptom mapping. Brain. 2010;133:880–894. doi: 10.1093/brain/awp305. [DOI] [PubMed] [Google Scholar]
- Vossel S, Geng JJ, Fink GR. Dorsal and ventral attention systems: distinct neural circuits but collaborative roles. Neuroscientist. 2014;20:150–159. doi: 10.1177/1073858413494269. [DOI] [PMC free article] [PubMed] [Google Scholar]
- Watson AB, Pelli DG. QUEST: a Bayesian adaptive psychometric method. Percept Psychophys. 1983;33:113–120. doi: 10.3758/BF03202828. [DOI] [PubMed] [Google Scholar]
- Werner S, Noppeney U. Superadditive responses in superior temporal sulcus predict audiovisual benefits in object categorization. Cereb Cortex. 2010;20:1829–1842. doi: 10.1093/cercor/bhp248. [DOI] [PubMed] [Google Scholar]
- Yantis S, Serences JT. Cortical mechanisms of space-based and object-based attentional control. Curr Opin Neurobiol. 2003;13:187–193. doi: 10.1016/S0959-4388(03)00033-3. [DOI] [PubMed] [Google Scholar]
- Yu AJ, Cohen JD. Sequential effects: superstition or rational behavior? In: Koller D, Schuurmans D, Bengio Y, Bottou L, editors. NIPS 2008, Advances in neural information processing systems. Ed 21. Vancouver: MIT; 2009. pp. 1873–1880. [PMC free article] [PubMed] [Google Scholar]